使用matlab 2014b画图过程中的一些问题记录(是的2020年快2021年了我还在用2014版)
1. 线形、标记符和颜色代码
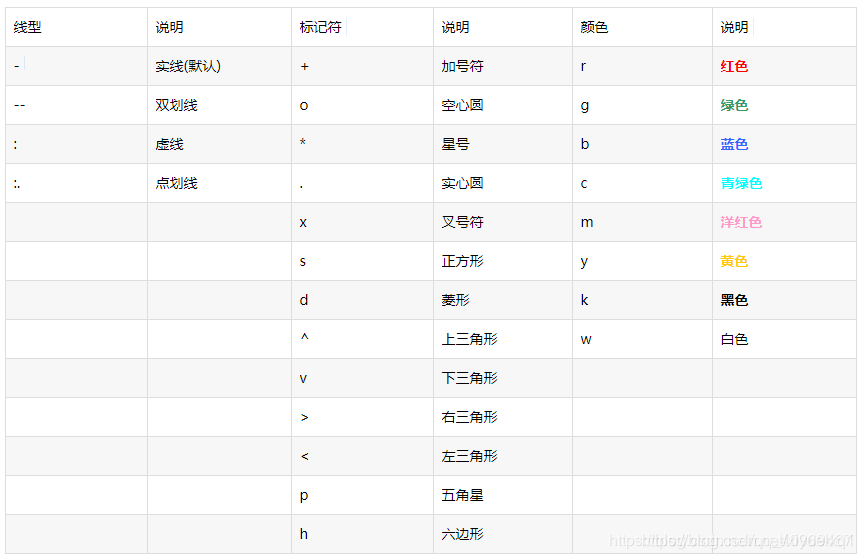
(上图源于网络 https://www.cnblogs.com/sggggr/p/12560428.html 侵删)
1.1 举个栗子:
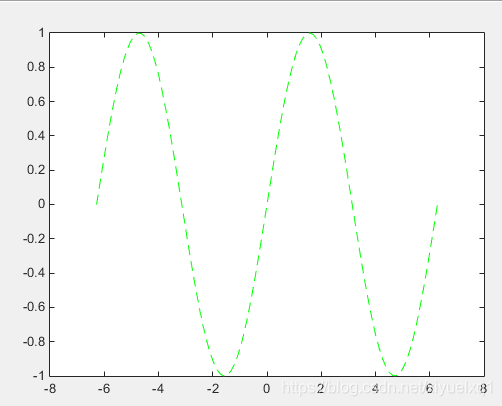
figure()
x = linspace(-2*pi,2*pi);
y = sin(x);
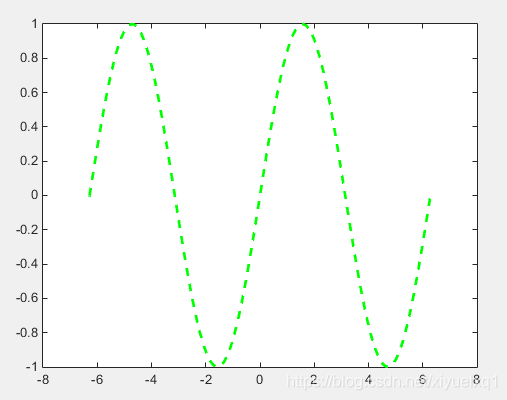
plot(x,y,'--g'); %线型和颜色直接放一起
画图结果:
1.2 加粗线形——设置LineWidth线宽的取值
plot(x,y,'--g','LineWidth',2);
1.3 标记x每一点幅值
plot(x,y,'--g','Marker','*&#