运用知识: js线程、Mandelbrot
1. js线程
js线程简介:
在HTML5中的线程是这样一种机制,它允许在Web程序中并发执行多个JS脚本,
每一个脚本执行流都称为一个线程,彼此间相互独立,并且有浏览器中JS引擎
负责管理。
HTML5中的Web worker可以分为两种不同线程类型,一个是专用线程DedicatedWorker,
一个是共享线程SharedWorker.
worker用法很简单,它要求将要放在子线程运行的代码独立到一个js文件,通过
new Worker("worker.js")将这个js文件运行在worker线程,通过worker.postMessage()
实现主线程向worker线程发送消息。
web worker总结:
我们可以做什么:
1.可以加载一个JS进行大量的复杂计算而不挂起主进程,并通过postMessage,onmessage进行通信
2.可以在worker中通过importScripts(url)加载另外的脚本文件
3.可以使用 setTimeout(), clearTimeout(), setInterval(), and clearInterval()
4.可以使用XMLHttpRequest来发送请求
5.可以访问navigator的部分属性
有那些局限性:
1.不能跨域加载JS
2.worker内代码不能访问DOM
3.各个浏览器对Worker的实现不大一致,例如FF里允许worker中创建新的worker,而Chrome中就不行
4.不是每个浏览器都支持这个新特性(IE9不支持)
2. 曼德勃罗(Mandelbrot)集合
分形简介:
尽管类似于柯赫雪花这样的自相似图形早已经出现。但是真正把这些问题系统地发展成一门学问,则是在二十世纪下半页。数学家本华·曼德勃罗(Benoit B. Mandelbrot)把这些部分与整体以某种方式相似的形体称为分形(fractal)。1975年,他创立了分形几何学(Fractal Geometry)。在此基础上,形成了研究分形性质及其应用的科学,称为分形理论(Fractal Theory)。因此,曼德勃罗也被称为“分形学之父”。现在,分形理论已经发展成为一门十分风靡和活跃的新理论、新学科,特别是把分形理论和混沌理论结合之后,更是衍生出一大片广阔的研究天地。分形的世界与我们平常所研究的几何学中很多直观的常识之间具有巨大的冲突。例如,平常我们说一个几何图形的维度,那么这个维度一般都应该是整数。例如平面上一个矩形就是二维的,空间中一个球体就是三维的。但是在分析几何中,几何图形的维度都是不是整数而是分数。这个维度又称为豪斯多夫维或豪斯多夫-贝塞科维奇维(Hausdorff-Becikovich Dimesion),它是由数学家豪斯多夫于1918年引入的。通过豪斯多夫维可以给一个任意复杂的点集合比如分形赋予一个维度
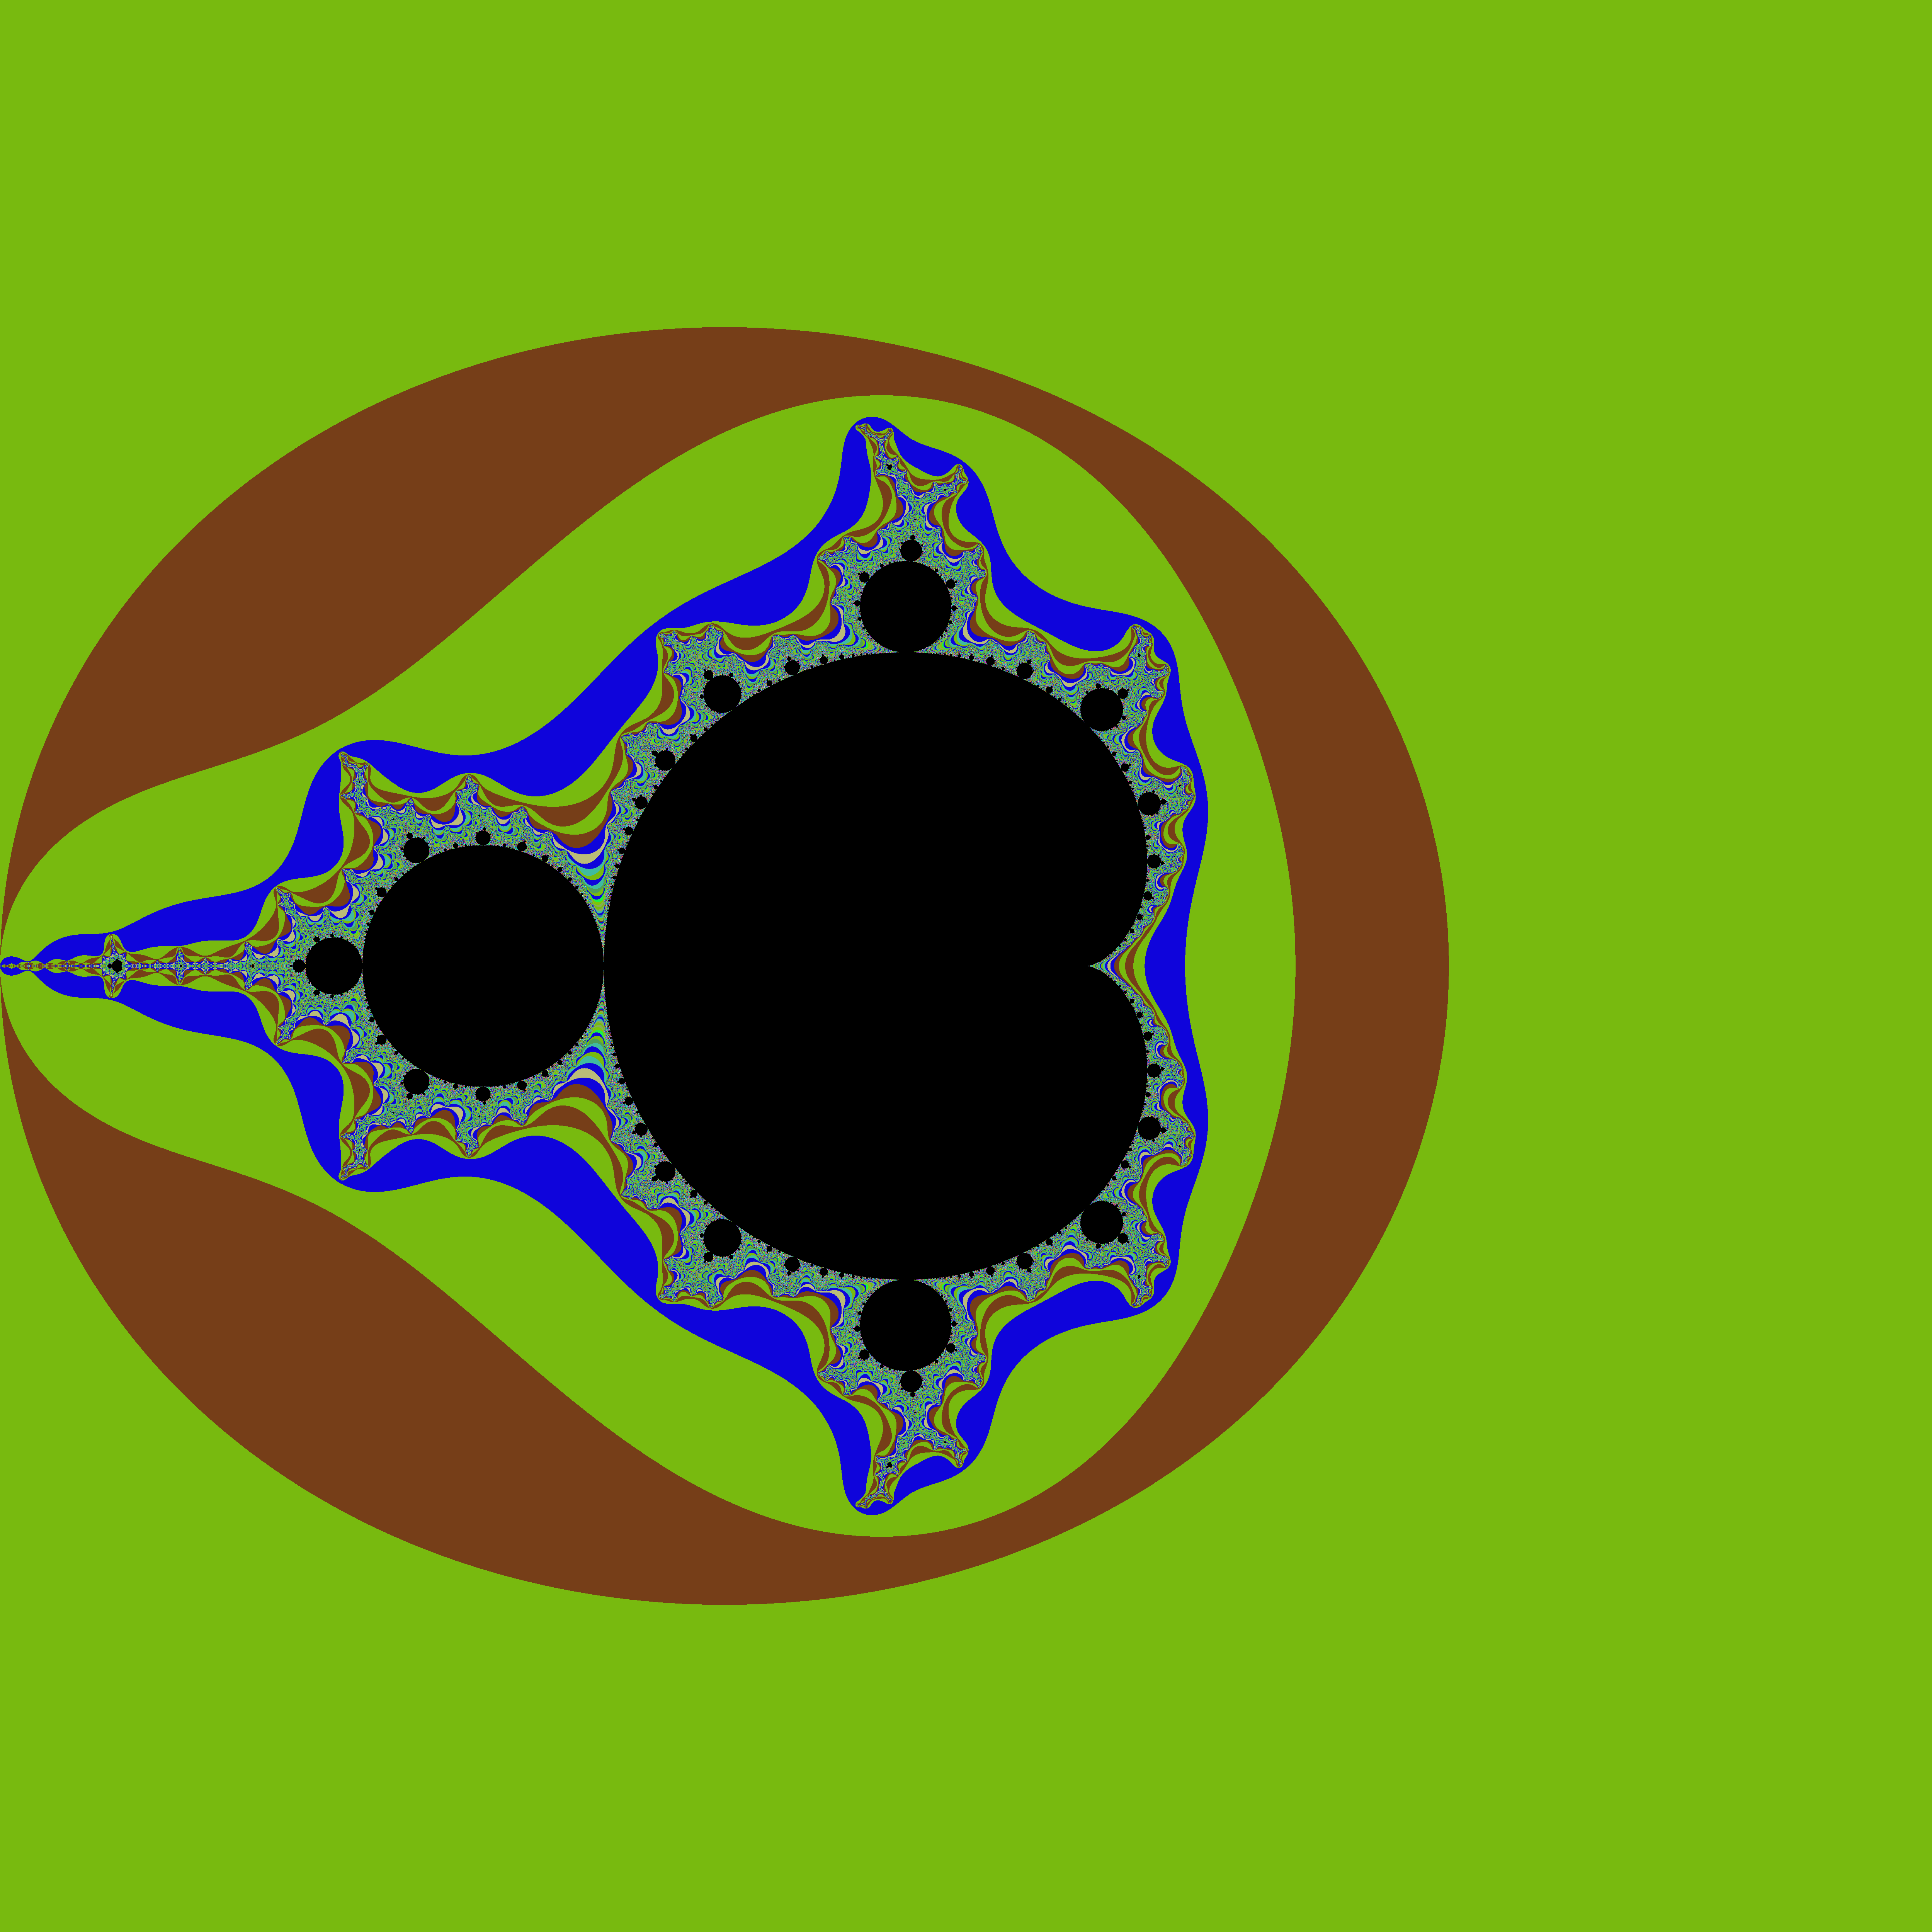
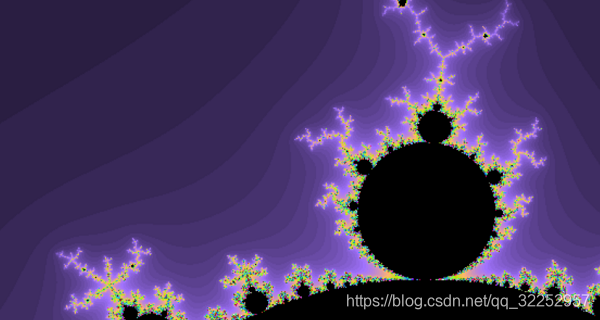
曼德勃罗集合(Mandelbrot Set):
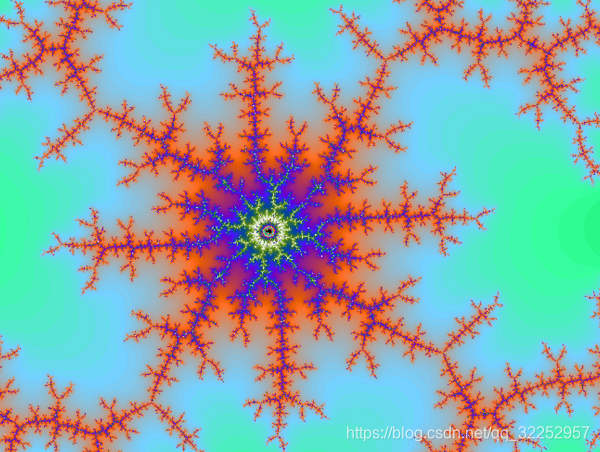
曼德勃罗集合(Mandelbrot Set)或曼德勃罗复数集合,是一种在复平面上组成分形的点的集合,因由曼德勃罗提出而得名。曼德博集合可以使复二次多项式 进行迭代来获得。其中,c是一个复参数。对于每一个c,从 z = 0 开始对fc(z)进行迭代。序列 的值或者延伸到无限大,或者只停留在有限半径的圆盘内(这与不同的参数c有关)。曼德布洛特集合就是使以上序列不延伸至无限大的所有c点的集合。
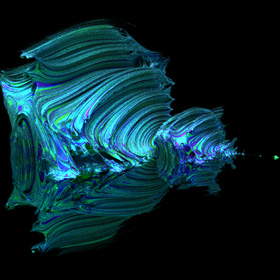
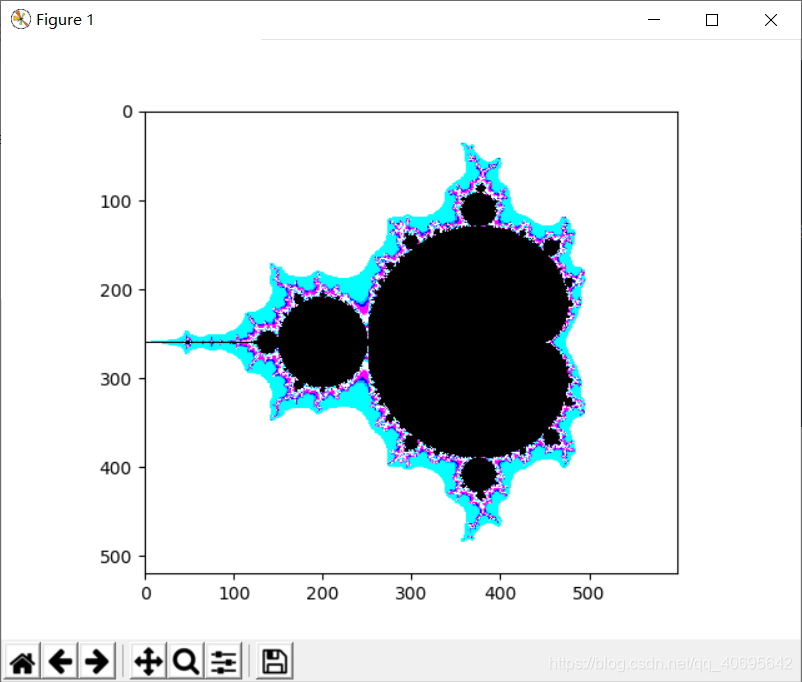
下面看程序效果:


下面看代码部分:
fractal.html
我们使用画布来显示图案canvas的putImageData()、getImageData()绘制
<!doctype html>
<html lang="en">
<head>
<title>Fractal Explorer</title>
<meta charset="utf-8">
<link rel="stylesheet" href="fractal.css">
<script src="mandellib.js"></script>
<script src="mandel.js"></script>
</head>
<body>
<canvas id="fractal" width="800" height="600"></canvas>
</body>
</html>
fractal.html简单的css
html, body, canvas {width: 100%;height: 100%;margin: 0px;padding: 0px;
}canvas {display: block;
}
mandellib.js
根据row行数创建任务、制作调色板、绘制一行像素、设置画布等。
/* * mandellib.js*** ------ Ready Bake Globals ---- */
var canvas;
var ctx;var i_max = 1.5;
var i_min = -1.5;
var r_min = -2.5;
var r_max = 1.5;var max_iter = 1024;
var escape = 100;
var palette = [];/* * ------- Ready Bake Code --------**///
// packages up the data we need to send to the worker
//
function createTask(row) {var task = {row: row,				// row number we're working onwidth: rowData.width,   // width of the ImageData object to fillgeneration: generation, // how far in we arer_min: r_min,r_max: r_max,i: i_max + (i_min - i_max) * row / canvas.height,max_iter: max_iter,escape: escape};return task;
}
//
// This function maps the numbers 0 to max_iter to
// 256 and then fills the palette with (r, g, b) values
// so that the colors next to each other in the array
// are relatively close to each other in color, and
// by increasing each of r, g, b at a different rate this
// works well to fill the spectrum for max_iter > 256.
//
//
function makePalette() {function wrap(x) {x = ((x + 256) & 0x1ff) - 256;if (x < 0) x = -x;return x;}for (i = 0; i <= this.max_iter; i++) {palette.push([wrap(7*i), wrap(5*i), wrap(11*i)]);}
}//
// drawRow gets maps the values in the array returned from a worker
// 	for one row to a color using the palette.
//
function drawRow(workerResults) {var values = workerResults.values;	// The values array the worker sends backvar pixelData = rowData.data;		// The actual pixels in the ImageData obj// The pixelData is a *reference* to the// 	rowData.data! so changing pixelData// 	changes the rowData.data!!!for (var i = 0; i < rowData.width; i++) {  // for each pixel in the rowvar red = i * 4;var green = i * 4 + 1;var blue = i * 4 + 2;var alpha = i * 4 + 3;pixelData[alpha] = 255; // set alpha to opaque// if the values array has a neg number, set the color to blackif (values[i] < 0) {pixelData[red] = pixelData[green] = pixelData[blue] = 0;} else {//// map the number from the values array returned by the worker// to a color from the palette//var color = this.palette[values[i]];//// each color has an rgb component, so set the rgb of// the pixel we're working on to r,g,b.//pixelData[red] = color[0];pixelData[green] = color[1];pixelData[blue] = color[2];}}//// paint the row back into the canvas// workerData.row is the row number we're working on// rowData contains the data we just updated!// we start at column 0, so x, y = 0, row//ctx.putImageData(this.rowData, 0, workerResults.row);
}//
// setupGraphics sets up some of the initial values for the variables used in
// 	 the Mandelbrot computation, and sets the canvas width and height
//	 to the width and height of the window.
//
function setupGraphics() {canvas = document.getElementById("fractal");ctx = canvas.getContext("2d");canvas.width = window.innerWidth;canvas.height = window.innerHeight;var width = ((i_max - i_min) * canvas.width / canvas.height);var r_mid = (r_max + r_min) / 2;r_min = r_mid - width/2;r_max = r_mid + width/2;rowData = ctx.createImageData(canvas.width, 1);makePalette();
}
workerlib.js 子线程使用的函数computeRow(),计算ImageData每行的像素对应的调色板值
//
// Computes a row of the fractal
// The values array returned to the manager code contains a
//	number for each pixel in the row
//
function computeRow(task) {var iter = 0;var c_i = task.i;var max_iter = task.max_iter;var escape = task.escape * task.escape;task.values = [];for (var i = 0; i < task.width; i++) {var c_r = task.r_min + (task.r_max - task.r_min) * i / task.width;var z_r = 0, z_i = 0;for (iter = 0; z_r*z_r + z_i*z_i < escape && iter < max_iter; iter++) {// z -> z^2 + cvar tmp = z_r*z_r - z_i*z_i + c_r;z_i = 2 * z_r * z_i + c_i;z_r = tmp;}if (iter == max_iter) {iter = -1;}task.values.push(iter);}return task;
}
worker.js 后台子线程,我们创建八个,负责计算工作,返回给主线程
importScripts("workerlib.js");
onmessage = function(task) {var workerResult = computeRow(task.data);postMessage(workerResult);
}
mandel.js 主要是将画布中每行的任务分发给8个线程,监听canvas点击事件响应重新绘制等。
/* * mandel.js*/var numberOfWorkers = 8;
var workers = [];
var rowData;
var nextRow = 0;
var generation = 0;window.onload = init;function init() {setupGraphics();//// When you click on the canvas, the handler is called.// An event object is passed in that contains the//  x, y position of the mouse click. We pass those//  values to the click handler.//canvas.onclick = function(event) {handleClick(event.clientX, event.clientY);};//// When you resize the browser window, we need//	to resize the canvas and restart the workers.//window.onresize = function() {resizeToWindow();};//// Create all the workers and set up the message handler.  // 	Add each worker to the workers array.//for (var i = 0; i < numberOfWorkers; i++) {var worker = new Worker("worker.js");worker.onmessage = function(event) {processWork(event.target, event.data)}worker.idle = true;workers.push(worker);}//// Start the workers//startWorkers();}//
// startWorkers
//	This function resets the workers to start them working
//		at the top of the fractal (row 0). It loops through
//		all the workers in the workers array and assigns
//		each worker a task to compute a row.
//	By posting a message with the task, we start the
//		worker's computation.
//
function startWorkers() {generation++;nextRow = 0;for (var i = 0; i < workers.length; i++) {var worker = workers[i];if (worker.idle) {var task = createTask(nextRow);worker.idle = false;worker.postMessage(task);nextRow++;}}
} //
// processWork
// 	This is the function we call when the worker posts
//		back a message with the results.
//	If the worker is working on the current fractal
//		generation, we draw the row of data, otherwise
//		we just throw the data away.
//	Once we've used the results, we assign the worker to
//		start computing another row.
//
function processWork(worker, workerResults) {if (workerResults.generation == generation) {drawRow(workerResults);}reassignWorker(worker);
}//
// reassignWorker
//	This function gives an idle worker its next task.
//
function reassignWorker(worker) {var row = nextRow++;if (row >= canvas.height) {worker.idle = true;} else {var task = createTask(row);worker.idle = false;worker.postMessage(task);}
}// handleClick
//	This function takes the x, y position where the user
//		clicked and sets the parameters for the new
//		fractal. The zoom factor sets the new extent
//		of the bounds of the Mandelbrot set to the
//		zoomed in size. The new fractal maintains
//		the aspect ratio of the current canvas size.
//	We start the workers over on the new zoomed in
//		fractal.
//
function handleClick(x, y) {var width = r_max - r_min;var height = i_min - i_max;var click_r = r_min + ((width * x) / canvas.width);var click_i = i_max + ((height * y) / canvas.height);var zoom = 8;r_min = click_r - width/zoom;r_max = click_r + width/zoom;i_max = click_i - height/zoom;i_min = click_i + height/zoom;startWorkers();
}//
// resizeToWindow
//	When the user resizes the browser window,
//		this function is called to resize the canvas,
//		and reset the fractal parameters (changing the
//		extent of the boundary and maintaining the new
//		aspect ratio of the window).
//	We restart the workers to compute the new fractal
//		based on the new size.
//
function resizeToWindow() {canvas.width = window.innerWidth;canvas.height = window.innerHeight;var width = ((i_max - i_min) * canvas.width / canvas.height);var r_mid = (r_max + r_min) / 2;r_min = r_mid - width/2;r_max = r_mid + width/2;rowData = ctx.createImageData(canvas.width, 1);startWorkers();
}