如何用TikZ/pgfplots宏包绘制《解析几何》中的二次曲面图像? 本文将逐一给出示例代码。
导言区设置如下:
\documentclass[border={1.2cm  0.1cm 1.2cm 0.1cm}]{standalone}
\usepackage{pgfplots}
\usepgfplotslibrary{patchplots}
\usepgfplotslibrary{colormaps}
\usepgfplotslibrary{colorbrewer}\pgfplotsset{compat=1.18}\usepackage{ctex}
\begin{document}
\begin{tikzpicture}……
\end{tikzpicture}
\end{document}
一、椭球面

%椭球面
\begin{tikzpicture}
\begin{axis}[
%title=椭球面,
tick label style={font=\tiny},
view={110}{20},
axis lines =center,
mark=none,
axis on top,
xlabel={$x$},ylabel={$y$},zlabel={$z$},
xmax=3,
ymax=9,
zmax=1.5,
]
\addplot3 [
colormap/spring,
surf,
z buffer=sort,
samples=40,domain=0:2*pi,
y domain=0:2*pi,
](
{2*sin(deg(x))* cos(deg(y))},
{8*sin(deg(x))* sin(deg(y))},
{1*cos(deg(x))}
);
\end{axis}
\end{tikzpicture}
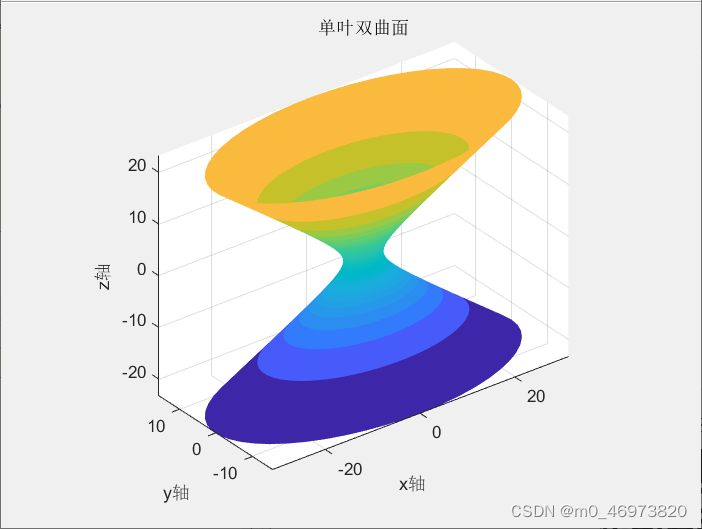
二、单叶双曲面

%单叶双曲面
\begin{tikzpicture}\begin{axis}[tick label style={font=\tiny}, view={120}{15}, axis lines =center, mark=none,
axis on top, xlabel={$x$},ylabel={$y$},zlabel={$z$}, xmax=5, ymax=3, xmin=-5,
ymin=-3, zmax=1.5, zmin=-1.5]
\addplot3 [colormap/spring, surf, z buffer=sort, samples=40, domain=-0.4*pi:0.4*pi,
y domain=0:2*pi]
({0.6*sec(deg(x))* cos(deg(y))}, {0.6*sec(deg(x))* sin(deg(y))}, {0.4*tan(deg(x))});\end{axis}
\end{tikzpicture}
三、双叶双曲面

%双叶双曲面
\begin{tikzpicture}
\begin{axis}[tick label style={font=\tiny}, view={110}{20}, axis lines =center, mark=none,
axis on top, xlabel={$x$},ylabel={$y$},zlabel={$z$}, xmax=20, ymax=10, xmin=-10,
ymin=-10, zmax=30, zmin=-30, width=30cm, height=30cm]
\addplot3 [colormap/spring, surf, z buffer=sort, samples=50,  domain=0.55*pi:1.4*pi,
y domain=0:2*pi]
({1.5*tan(deg(x))* cos(deg(y))}, {1.5*tan(deg(x))* sin(deg(y))}, {3*sec(deg(x))});
\addplot3 [colormap/spring, surf, z buffer=sort, samples=50,  domain=0.55*pi:1.4*pi,
y domain=0:2*pi]
({1.5*tan(deg(x))* cos(deg(y))}, {1.5*tan(deg(x))* sin(deg(y))}, {-3*sec(deg(x))});
\end{axis}
\end{tikzpicture}
四、圆锥面

%圆锥面
\begin{tikzpicture}
\begin{axis}[tick label style={font=\tiny}, view={110}{20}, axis lines =center, mark=none,
axis on top, xlabel={$x$},ylabel={$y$},zlabel={$z$}, xmax=3, ymax=3, zmax=5,
width=12cm, height=12cm]
\addplot3 [colormap/spring, surf, z buffer=sort, samples=50,  domain=0:3,
y domain=0:2*pi]
({x*cos(deg(y))}, {x* sin(deg(y))}, {1.5*x});
\addplot3 [colormap/spring, surf, z buffer=sort, samples=50,  domain=0:3,
y domain=0:2*pi]
({x*cos(deg(y))}, {x* sin(deg(y))}, {-1.5*x});
\end{axis}
\end{tikzpicture}
五、椭圆抛物面

%椭圆抛物面
\begin{tikzpicture}
\begin{axis}[title=$x^2+y^2$:正定,tick label style={font=\tiny},view={130}{25},
axis lines =center, mark=none, axis on top, xmax=1.5, ymax=1.5, zmax=0.8, width=6cm, height=5cm]
\addplot3 [colormap/spring, surf, z buffer=sort, samples=30,domain=0:1, y domain=0:2*pi,]
({x* cos(deg(y))},{x* sin(deg(y))},0.5*x^2);
\end{axis}
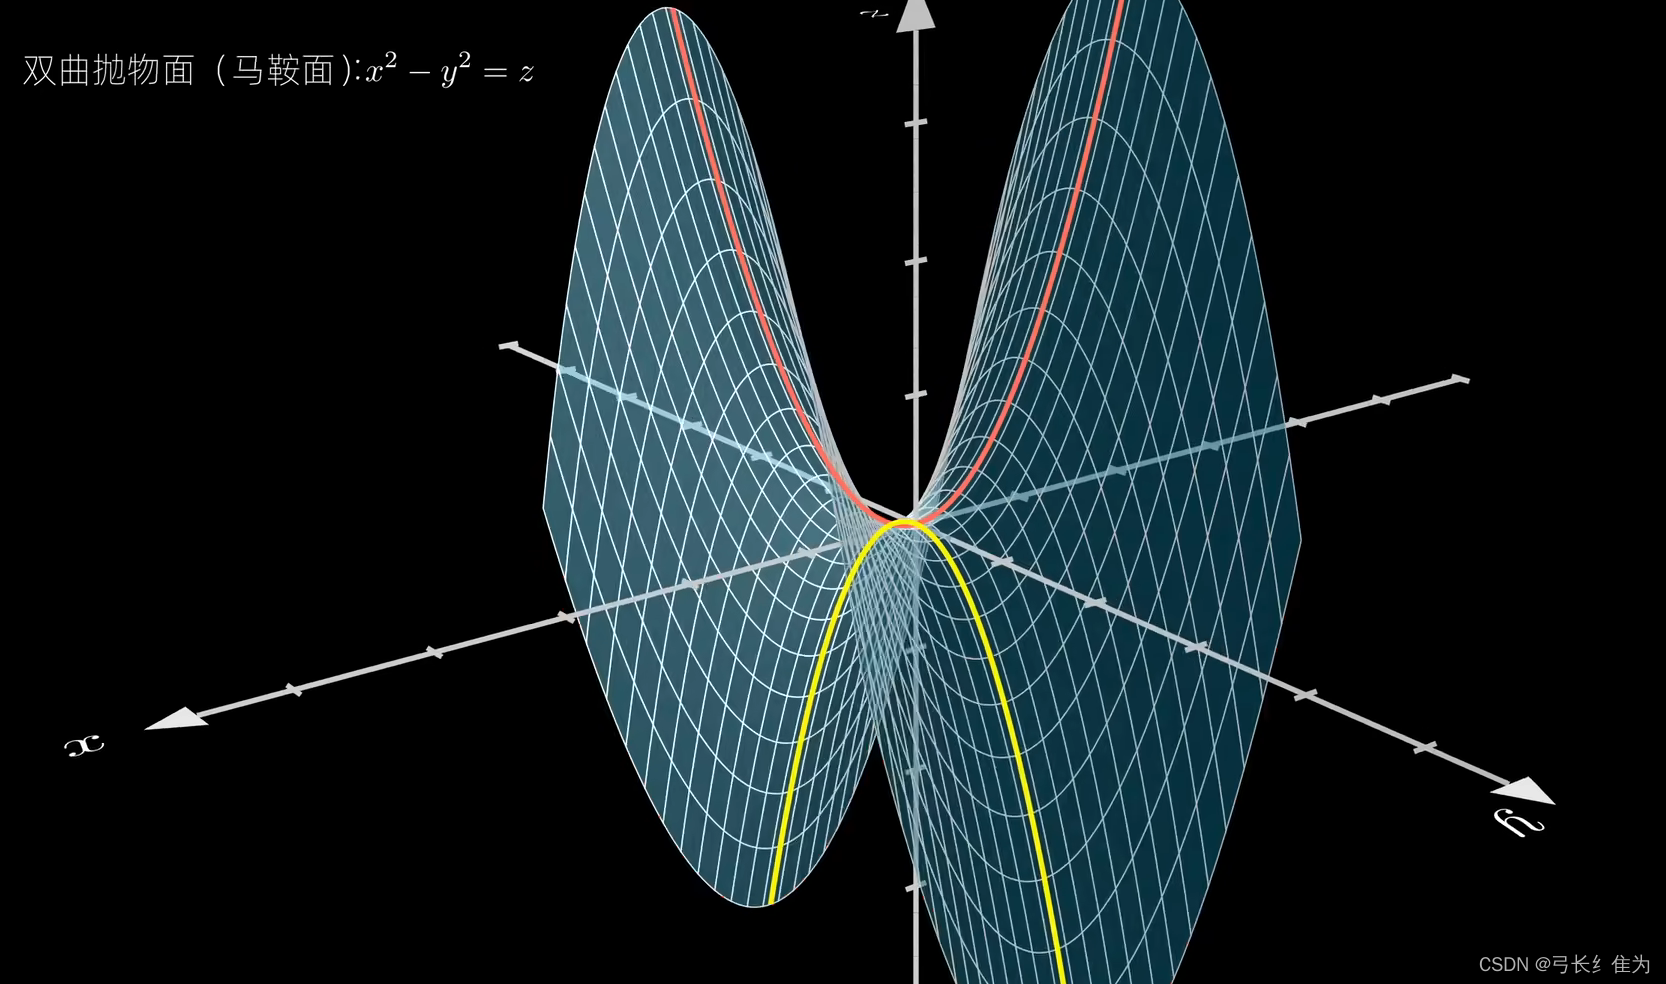
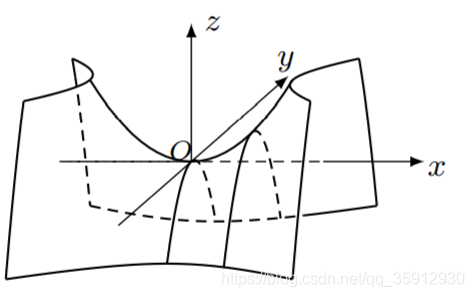
\end{tikzpicture}六、双曲抛物面(鞍面)

%双曲抛物面
\begin{tikzpicture}
\begin{axis}[tick label style={font=\tiny},view={120}{25},axis lines =center, mark=none,
axis on top,xlabel={$x$},ylabel={$y$},zlabel={$z$},xmin=-3,xmax=3,
ymin=-3,ymax=3,zmax=3,width=12cm,height=8cm,]
\addplot3 [colormap/PiYG, surf, z buffer=sort, samples=20,domain=-2:2,0]
({x},{y},0.5*x^2-0.5*y^2);
\end{axis}
\end{tikzpicture}
七、椭圆柱面

%椭圆柱面
\begin{tikzpicture}
\begin{axis}[tick label style={font=\tiny},view={150}{9},axis lines =center, mark=none,
axis on top, xlabel={$x$},ylabel={$y$},zlabel={$z$}, xmax=3, ymax=3, zmax=3,
zmin=- 3,width=12cm,height=12cm]
\addplot3 [colormap/spring, surf, z buffer=sort, samples=50, domain=0:2*pi,
y domain=-0.4*pi:0.4*pi]
({2*cos(deg(x))},{4*sin(deg(x))},{y});
\end{axis}
\end{tikzpicture}
八、双曲柱面

%双曲柱面
\begin{tikzpicture}
\begin{axis}[ tick label style={font=\tiny},view={170}{9},axis lines =center, mark=none,
axis on top, xlabel={$x$},ylabel={$y$},zlabel={$z$},xmax=3,xmin=-3,ymax=3,
zmax=3,zmin=-3, width=12cm,height=12cm]
\addplot3 [colormap/spring, surf, z buffer=sort, samples=50, domain=-2:2,y domain=-1.2:1.2,]
({1*cosh(x)},{2*sinh(x)},{y});
\addplot3 [colormap/spring, surf, z buffer=sort, samples=50, domain=-2:2,y domain=-1.2:1.2,]
({-1*cosh(x)},{2*sinh(x)},{y});
\end{axis}
\end{tikzpicture}
九、抛物柱面

%抛物柱面
\begin{tikzpicture}
\begin{axis}[tick label style={font=\tiny},view={160}{10},axis lines =center, mark=none,
axis on top, xlabel={$x$}, ylabel={$y$}, zlabel={$z$}, xmax=3, ymax=2, zmax=3,
zmin=-3,width=12cm,height=12cm]
\addplot3 [colormap/spring, surf, z buffer=sort, samples=50,domain=-2:2,y domain = -2:2]
({0.6*x^2},{x},{y});
\end{axis}
\end{tikzpicture}
如果你觉得本文不错的话,欢迎转发、分享,让更多的朋友看到!赠人玫瑰,手留余香!
如果本文对您有帮助,欢迎点击“在看”,转发分享!您的支持是作者写作的动力!
【LaTeX微信交流加群:】
如果你希望交流LaTeX使用或者TikZ作图或者Beamer制作幻灯片方面的问题,请先添加作者微信:niltxz,然后加入作者的LaTeX+TikZ+Beamer 交流微信群。