OpenCV 学习笔记(颜色直方图计算 calcHist)
最近在看一本OpenCV 的书,书名是 《OpenCV 3 Computer Vision Application Programming Cookbook (third edition)》,里面给了很多很实用的代码片段。最近这几篇学习笔记都是从这个书里摘出的代码。有些代码我又做了些小的修改。
直方图计算是个很常见的需求,OpenCV 当然也提供了相应的函数。不过OpenCV 里的函数搞的有点复杂。函数原型如下:
void calcHist( InputArrayOfArrays images,const std::vector<int>& channels,InputArray mask, OutputArray hist,const std::vector<int>& histSize,const std::vector<float>& ranges,bool accumulate = false );
这个 calcHist 可以同时计算许多个图像的直方图,也支持多个通道图像。通常我们用不到这么复杂的功能。所以可以再进一步封装一下。下面是封装后的代码:
#ifndef HISTOGRAM_H
#define HISTOGRAM_H#include <opencv2/imgproc/imgproc.hpp>
#include <opencv2/highgui/highgui.hpp>class Histogram1D
{
public:Histogram1D(){// Prepare arguments for 1D histogramhistSize[0] = 256;hranges[0] = 0.0;hranges[1] = 256.0;ranges[0] = hranges;channels[0] = 0; // by default, we look at channel 0}~Histogram1D();// Computes the 1D histogram and returns an image of it.cv::Mat getHistogramImage(const cv::Mat &image);// Computes the 1D histogram.cv::MatND getHistogram(const cv::Mat &image);/*** @brief stretch 拉伸图像的灰度直方图以增强图像的对比度* @param image 输入图像,必须是8 bits 灰度图像* @param percent 直方图两侧各舍弃百分之 percent 的点,将剩下的拉伸到 0 - 255* @return 返回一个新的图像*/cv::Mat stretch(const cv::Mat &image, double percent);cv::Mat stretch(const cv::Mat &image, double percent1, double percent2);//直方图正规化,将图像图像最亮的地方线性拉伸到 255,最暗的地方线性拉伸到 0cv::Mat normalize(const cv::Mat &image);
private:int histSize[1]; // number of binsfloat hranges[2]; // min and max pixel valueconst float* ranges[1];int channels[1]; // only 1 channel used here};class ColorHistogram
{
public:ColorHistogram(){// Prepare arguments for a color histogramhistSize[0] = histSize[1] = histSize[2] = 256;hranges[0] = 0.0; // BRG rangehranges[1] = 256.0;ranges[0] = hranges; // all channels have the same rangeranges[1] = hranges;ranges[2] = hranges;channels[0] = 0; // the three channelschannels[1] = 1;channels[2] = 2;}cv::MatND getHistogram(const cv::Mat &image) ;cv::SparseMat getSparseHistogram(const cv::Mat &image) ;
private:int histSize[3];float hranges[2];const float* ranges[3];int channels[3];
};#endif // HISTOGRAM_H
#include "histogram.h"
#include <QDebug>
#include <random>Histogram1D::~Histogram1D()
{}// Computes the 1D histogram.
cv::MatND Histogram1D::getHistogram(const cv::Mat &image)
{cv::MatND hist;// Compute histogramcv::calcHist(&image,1, // histogram from 1 image onlychannels, // the channel usedcv::Mat(), // no mask is usedhist, // the resulting histogram1, // it is a 1D histogramhistSize, // number of binsranges // pixel value range);return hist;
}cv::Mat Histogram1D::stretch(const cv::Mat &image, double percent)
{return stretch(image, percent, percent);
}cv::Mat Histogram1D::stretch(const cv::Mat &image, double percent1, double percent2)
{cv::MatND hist = getHistogram(image);int imin, imax;if(percent1 < 0.0) percent1 = 0.0;if(percent1 > 1.0) percent1 = 1.0;percent1 = image.rows * image.cols * percent1;double value = 0;for(imin = 0; imin < histSize[0]; imin++){value += hist.at<float>(imin);if(value > percent1) break;}value = 0;if(percent2 < 0.0) percent2 = 0.0;if(percent2 > 1.0) percent2 = 1.0;percent2 = image.rows * image.cols * percent2;for(imax = histSize[0] - 1; imax >= 0; imax--){value += hist.at<float>(imax);if(value > percent2) break;}//int dim = 256;cv::Mat lookup(1, 256, CV_8U);for(int i = 0; i < 256; i++){if(i < imin) lookup.at<uchar>(i) = 0;else if(i > imax) lookup.at<uchar>(i) = 255;else{double v = 255.0 * (i - imin) / (imax - imin);lookup.at<uchar>(i) = static_cast<uchar>(v);}}cv::Mat ret;cv::LUT(image, lookup, ret);return ret;
}cv::Mat Histogram1D::normalize(const cv::Mat &image)
{// Compute histogram firstcv::MatND hist = getHistogram(image);int imin, imax;for(imin = 0; imin < histSize[0]; imin++){if(hist.at<float>(imin) > 0) break;}for(imax = histSize[0] - 1; imax >= 0; imax--){if(hist.at<float>(imax) > 0) break;}cv::Mat lookup(1, 256, CV_8U);for(int i = 0; i < 256; i++){if(i < imin) lookup.at<uchar>(i) = 0;else if(i > imax) lookup.at<uchar>(i) = 255;else{int v = 255 * (i - imin) / (imax - imin);lookup.at<uchar>(i) = static_cast<uchar>(v);}}cv::Mat ret;cv::LUT(image, lookup, ret);return ret;
}// Computes the 1D histogram and returns an image of it.
cv::Mat Histogram1D::getHistogramImage(const cv::Mat &image)
{// Compute histogram firstcv::MatND hist = getHistogram(image);// Get min and max bin valuesdouble maxVal = 0;double minVal = 0;cv::minMaxLoc(hist, &minVal, &maxVal, 0, 0);// Image on which to display histogramcv::Mat histImg(histSize[0], histSize[0], CV_8U, cv::Scalar(255));// set highest point at 90% of nbinsint hpt = static_cast<int>(0.9 * histSize[0]);// Draw a vertical line for each binfor( int h = 0; h < histSize[0]; h++ ){float binVal = hist.at<float>(h);int intensity = static_cast<int>(binVal * hpt / maxVal);// This function draws a line between 2 pointscv::line(histImg, cv::Point(h, histSize[0]),cv::Point(h,histSize[0]-intensity), cv::Scalar::all(0));}return histImg;
}cv::MatND ColorHistogram::getHistogram(const cv::Mat &image)
{cv::MatND hist;// Compute histogramcv::calcHist(&image,1, // histogram of 1 image onlychannels, // the channel usedcv::Mat(), // no mask is usedhist, // the resulting histogram3, // it is a 3D histogramhistSize, // number of binsranges // pixel value range);return hist;
}cv::SparseMat ColorHistogram::getSparseHistogram(const cv::Mat &image)
{cv::SparseMat hist(3,histSize,CV_32F);// Compute histogramcv::calcHist(&image,1, // histogram of 1 image onlychannels, // the channel usedcv::Mat(), // no mask is usedhist, // the resulting histogram3, // it is a 3D histogramhistSize, // number of binsranges // pixel value range);return hist;
}
下面给个简单的例子:
cv::Mat image = cv::imread("D:\\向日葵.jpg");cv::cvtColor(image, image, cv::COLOR_BGR2GRAY);cv::imshow("origin", image);Histogram1D hist;cv::Mat h = hist.getHistogramImage(image);cv::Mat his1 = hist.getHistogram(image);cv::imshow("hist", h);image = hist.stretch(image, 0, 0.150);cv::imshow("2", image);cv::Mat h2 = hist.getHistogramImage(image);cv::Mat his2 = hist.getHistogram(image);cv::imshow("hist2", h2);
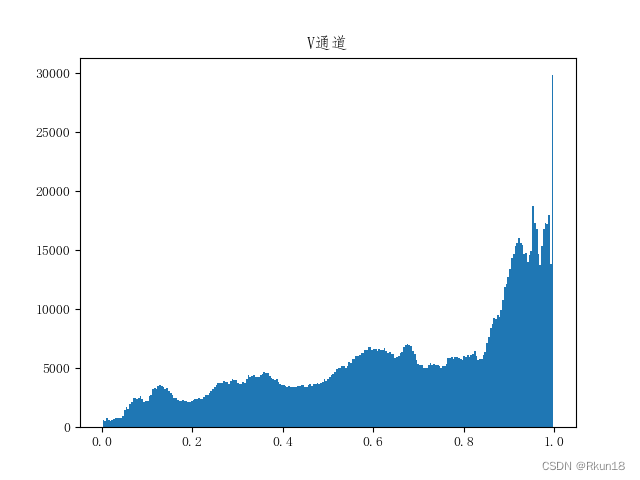
这个例子很简单,加载一幅图像,先变成灰度图,然后计算直方图。再对图像的直方图拉伸一下,之后在重新计算直方图。输出结果如下图:

上面的例子是针对灰度图像的,对于彩色图像要用 ColorHistogram 这个类。彩色图像通常具有的颜色非常多,直接计算得到的结果会非常大。通常我们要先对颜色进行缩减操作。这个缩减操作可以用下面这个函数:
void colorReduceIO(const cv::Mat &image, // input imagecv::Mat &result,      // output imageint div)
{int nl = image.rows; // number of linesint nc = image.cols; // number of columnsint nchannels = image.channels(); // number of channels// allocate output image if necessaryresult.create(image.rows, image.cols, image.type());for (int j = 0; j < nl; j++){// get the addresses of input and output row jconst uchar* data_in = image.ptr<uchar>(j);uchar* data_out = result.ptr<uchar>(j);for (int i = 0; i < nc * nchannels; i++){// process each pixel ---------------------data_out[i] = data_in[i] / div*div + div / 2;// end of pixel processing ----------------} // end of line}
}
通常我们把图像数据最低2位去掉是不影响显示效果的。去掉最低的 4 位也不影响大多数的后续处理。下面给个简单的例子:
cv::Mat image = cv::imread("D:\\向日葵.jpg");cv::pyrDown(image, image);cv::Mat image4, image16, image8;colorReduceIO(image, image4, 4);colorReduceIO(image, image8, 8);colorReduceIO(image, image16, 16);cv::imshow("origin", image); cv::imshow("image4", image4);cv::imshow("image16", image16);cv::imshow("image8", image8);
结果如下图:
 所以缩减一下颜色数量再做颜色直方图会减少大量内存消耗。对后续其他的处理也有帮助。


![[OpenCV实战]52 在OpenCV中使用颜色直方图](https://img-blog.csdnimg.cn/img_convert/925e455f72c7db6bc7dcab40a7b88cd3.jpeg)