首先对图像进行简单处理,让图像相对平滑。然后二值化图像,调整合适的阈值,使二值化后的图像尽可能的干净。然后对图像进行霍夫变换求解直线的起点与终点。用两点式求解直线方程。大功告成!
#阈值可以改。阈值改大之后可以把断掉的直线画到一条上

%Matlab Code
close all; clear ;clc
I = imread('1.jpg');
b=medfilt2(I,[3,3]);%中值滤波
A=imbinarize(b,0.65); %二值化figure;
subplot(1,3,1);
imshow(I,[]);
BW = edge(A,'canny');%Canny
[H,T,R] = hough(BW);%计算二值图像的标准霍夫变换,H为霍夫变换矩阵,I,R为计算霍夫变换的角度和半径值 ,'RhoResolution',0.5,'Theta',-10:0.5:10
subplot(1,3,2);
imshow(H,[],'XData',T,'YData',R,'InitialMagnification','fit');%hough变换的图像
xlabel('\theta'), ylabel('\rho');
axis on,axis square,hold on;P = houghpeaks(H,10,'threshold',0.7*max(H(:)));%提取3个极值点
x = T(P(:,2));
y = R(P(:,1));
plot(x,y,'s','color','white');%标出极值点lines=houghlines(BW,T,R,P);%提取线段
subplot(1,3,3);
imshow(I), hold on;max_len=0;
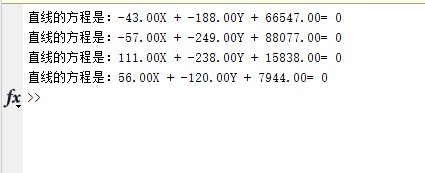
for k=1:length(lines)xy=[lines(k).point1;lines(k).point2];plot(xy(:,1),xy(:,2),'lineWidth',2,'Color','green');plot(xy(1,1),xy(1,2),'x','lineWidth',2,'Color','yellow');%线段起点plot(xy(2,1),xy(2,2),'x','lineWidth',2,'Color','red'); %线段终点len=norm(lines(k).point1-lines(k).point2);%两点式求直线:aX + bY + c= 0x1 = xy(1,1); y1 = xy(1,2);x2 = xy(2,1); y2 = xy(2,2);a = y2 - y1;b = x1 - x2;c = y1*x2 - x1*y2;Text = sprintf( '直线的方程是:%.2fX + %.2fY + %.2f= 0', a, b, c);disp (Text);if(len>max_len)max_len=len;xy_long=xy;end
end
plot(xy_long(:,1),xy_long(:,2),'LineWidth',2,'Color','cyan');