0. 前言
本文采用第三方库xchart进行绘制,所需要使用的jar包如下:
https://download.csdn.net/download/hfy1237/86508408
https://download.csdn.net/download/hfy1237/86508849
一、折线图
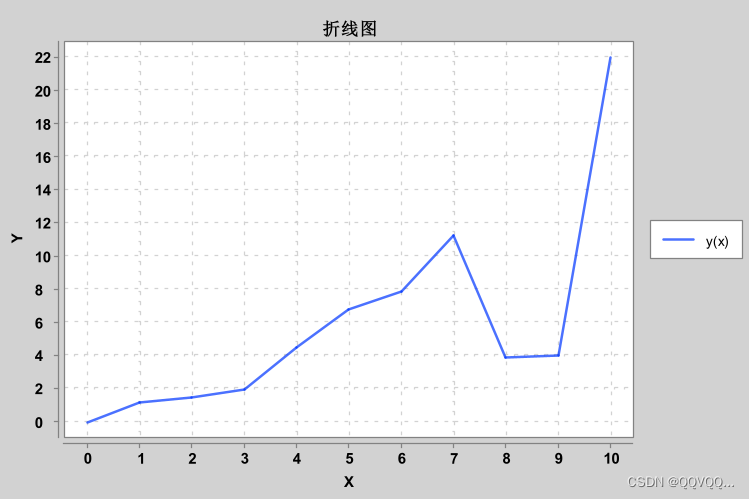
1. 方式一(快速绘图)
package plot;import org.knowm.xchart.QuickChart;
import org.knowm.xchart.SwingWrapper;
import org.knowm.xchart.XYChart;public class SampleXchart {public static void main(String[] args) {// 创建数据double[] xData = new double[] { 0.0, 1.0, 2.0, 3.0, 4.0, 5.0, 6.0, 7.0, 8.0, 9.0, 10.0 };double[] yData = new double[] { 0.0, 1.2, 1.5, 2.0, 4.5, 6.8, 7.9, 11.3, 3.9, 4, 22};// 创建图表XYChart chart = QuickChart.getChart("折线图", "X", "Y", "y(x)", xData, yData);// 进行绘制new SwingWrapper<XYChart>(chart).displayChart();}}
2. 方式二
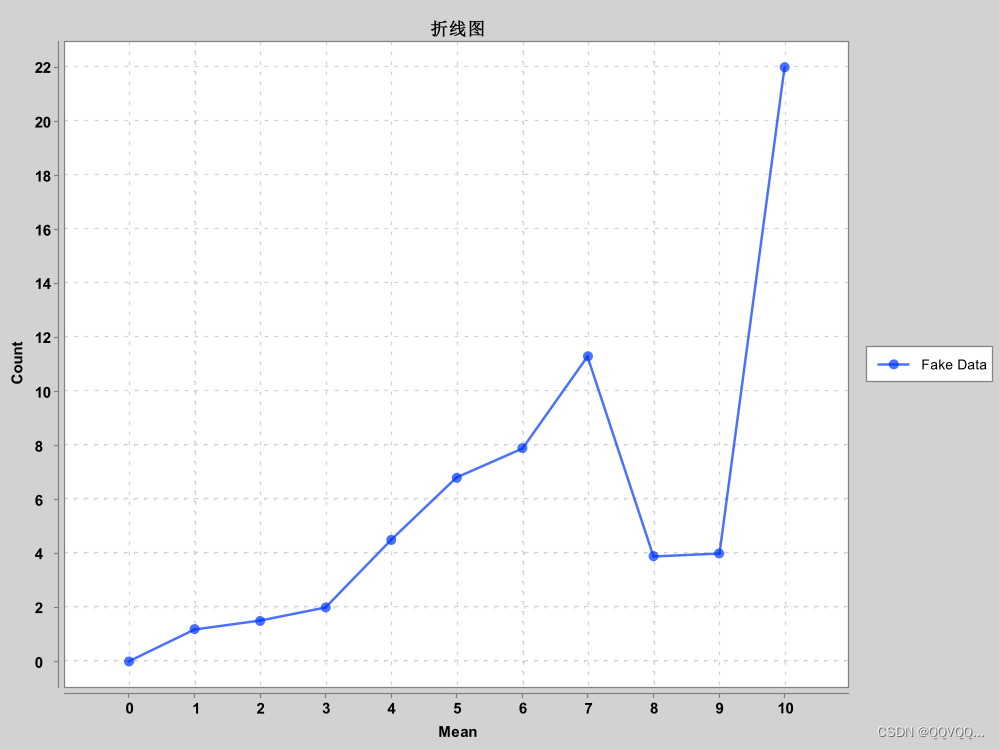
package plot;import org.knowm.xchart.CategoryChart;
import org.knowm.xchart.CategoryChartBuilder;
import org.knowm.xchart.CategorySeries.CategorySeriesRenderStyle;
import org.knowm.xchart.SwingWrapper;public class Example {public static void main(String[] args) {// 创建数据double[] xData = new double[] { 0.0, 1.0, 2.0, 3.0, 4.0, 5.0, 6.0, 7.0, 8.0, 9.0, 10.0 };double[] yData = new double[] { 0.0, 1.2, 1.5, 2.0, 4.5, 6.8, 7.9, 11.3, 3.9, 4, 22};// 创建ChartCategoryChart chart = new CategoryChartBuilder().width(800).height(600).title("折线图").xAxisTitle("Mean").yAxisTitle("Count").build();//设置图表样式chart.getStyler().setDefaultSeriesRenderStyle(CategorySeriesRenderStyle.Line);// 添加数据源chart.addSeries("Fake Data", xData, yData);// 进行展示new SwingWrapper<CategoryChart>(chart).displayChart();}}
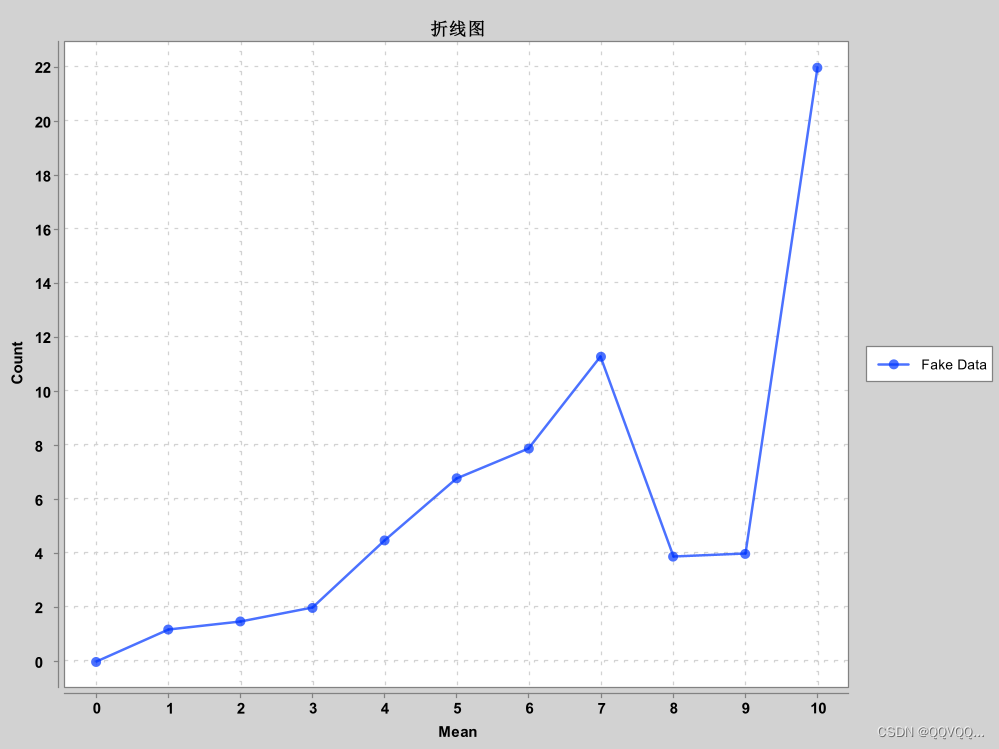
3. 方式三
package plot;import org.knowm.xchart.CategoryChart;
import org.knowm.xchart.CategoryChartBuilder;
import org.knowm.xchart.CategorySeries.CategorySeriesRenderStyle;
import org.knowm.xchart.SwingWrapper;
import org.knowm.xchart.XYChart;
import org.knowm.xchart.XYChartBuilder;
import org.knowm.xchart.XYSeries;
import org.knowm.xchart.style.colors.XChartSeriesColors;
import org.knowm.xchart.style.lines.SeriesLines;
import org.knowm.xchart.style.markers.SeriesMarkers;public class Example {public static void main(String[] args) {// 创建数据double[] xData = new double[] { 0.0, 1.0, 2.0, 3.0, 4.0, 5.0, 6.0, 7.0, 8.0, 9.0, 10.0 };double[] yData = new double[] { 0.0, 1.2, 1.5, 2.0, 4.5, 6.8, 7.9, 11.3, 3.9, 4, 22};// 创建ChartXYChart chart = new XYChartBuilder().width(800).height(600).title("折线图").xAxisTitle("Mean").yAxisTitle("Count").build();// 添加数据源XYSeries series = chart.addSeries("Fake Data", xData, yData);series.setLineColor(XChartSeriesColors.BLUE);series.setMarker(SeriesMarkers.CIRCLE);series.setLineStyle(SeriesLines.SOLID);// 进行展示new SwingWrapper<XYChart>(chart).displayChart();}}
二、 条形图
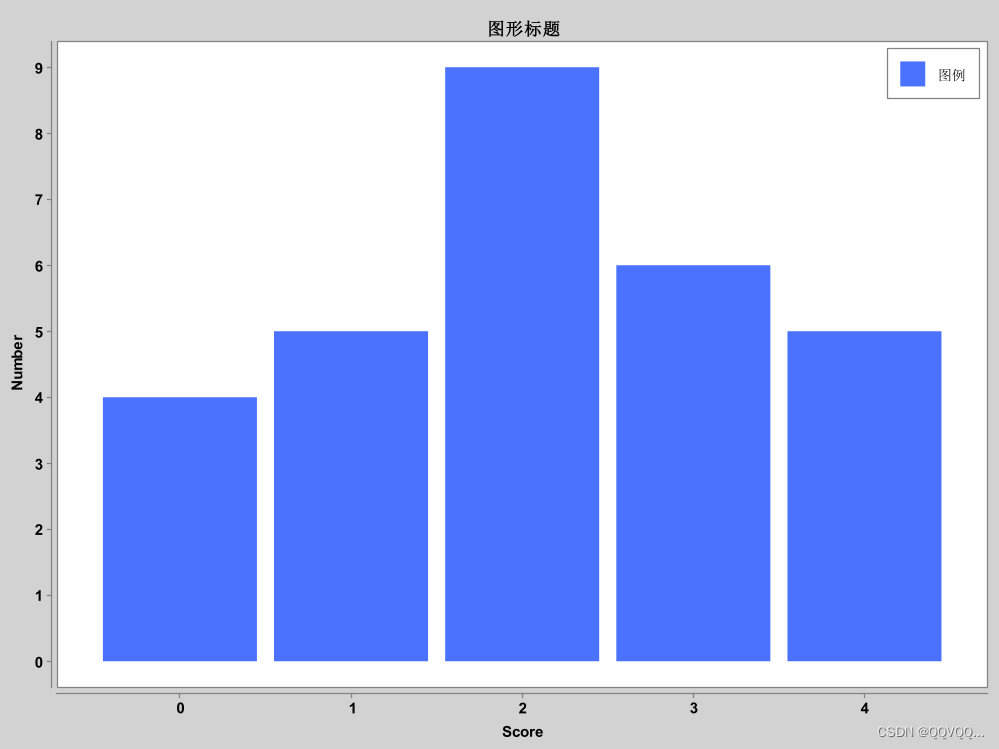
1. 基本条形图
package plot;import java.util.Arrays;import org.knowm.xchart.CategoryChart;
import org.knowm.xchart.CategoryChartBuilder;
import org.knowm.xchart.SwingWrapper;
import org.knowm.xchart.style.Styler.LegendPosition;public class SampleXchart {public static void main(String[] args) {// 创建Chart对象CategoryChart chart =new CategoryChartBuilder().width(800).height(600).title("图形标题").xAxisTitle("Score").yAxisTitle("Number").build();// 设置图例显示位置chart.getStyler().setLegendPosition(LegendPosition.InsideNE);// 设置标签是否可见chart.getStyler().setLabelsVisible(false);// 设置网格是否可见chart.getStyler().setPlotGridLinesVisible(false);// 添加绘图数据chart.addSeries("图例", Arrays.asList(0, 1, 2, 3, 4), Arrays.asList(4, 5, 9, 6, 5));// 进行展示new SwingWrapper<CategoryChart>(chart).displayChart();}}
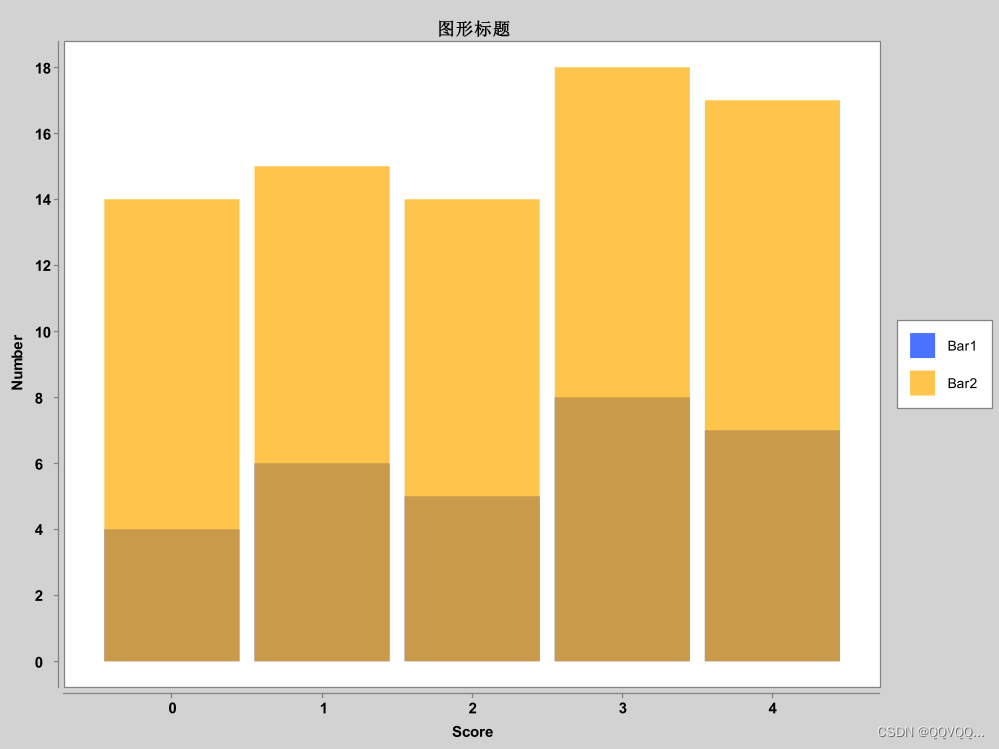
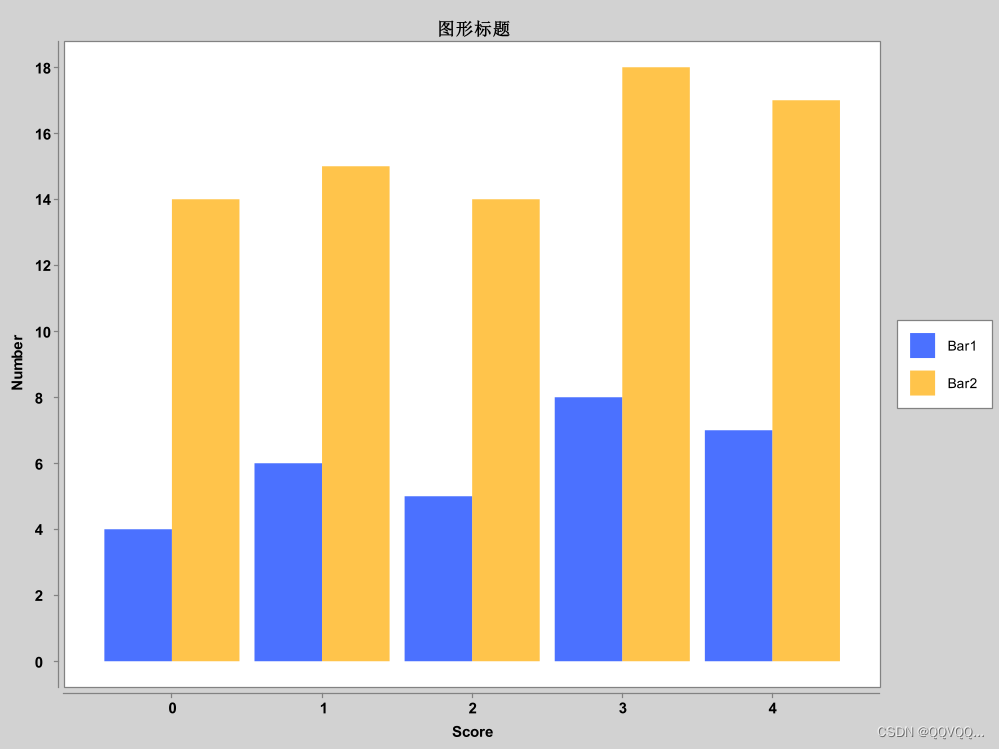
2. 堆积条形图
package plot;import java.util.Arrays;import org.knowm.xchart.CategoryChart;
import org.knowm.xchart.CategoryChartBuilder;
import org.knowm.xchart.SwingWrapper;public class Example {public static void main(String[] args) {// 创建Chart对象CategoryChart chart = new CategoryChartBuilder().width(800).height(600).title("图形标题").xAxisTitle("Score").yAxisTitle("Number").build();// 设置标签是否可见chart.getStyler().setLabelsVisible(false);// 设置网格是否可见chart.getStyler().setPlotGridLinesVisible(false);// 设置是否堆积chart.getStyler().setOverlapped(true);// 添加绘图数据chart.addSeries("Bar1", Arrays.asList(0, 1, 2, 3, 4), Arrays.asList(4, 6, 5, 8, 7));chart.addSeries("Bar2", Arrays.asList(0, 1, 2, 3, 4), Arrays.asList(14, 15, 14, 18, 17));// 进行展示new SwingWrapper<CategoryChart>(chart).displayChart();}}
3. 并列条形图
package plot;import java.util.Arrays;import org.knowm.xchart.CategoryChart;
import org.knowm.xchart.CategoryChartBuilder;
import org.knowm.xchart.SwingWrapper;public class Example {public static void main(String[] args) {// 创建Chart对象CategoryChart chart = new CategoryChartBuilder().width(800).height(600).title("图形标题").xAxisTitle("Score").yAxisTitle("Number").build();// 设置标签是否可见chart.getStyler().setLabelsVisible(false);// 设置网格是否可见chart.getStyler().setPlotGridLinesVisible(false);// 添加绘图数据chart.addSeries("Bar1", Arrays.asList(0, 1, 2, 3, 4), Arrays.asList(4, 6, 5, 8, 7));chart.addSeries("Bar2", Arrays.asList(0, 1, 2, 3, 4), Arrays.asList(14, 15, 14, 18, 17));// 进行展示new SwingWrapper<CategoryChart>(chart).displayChart();}}
三、直方图
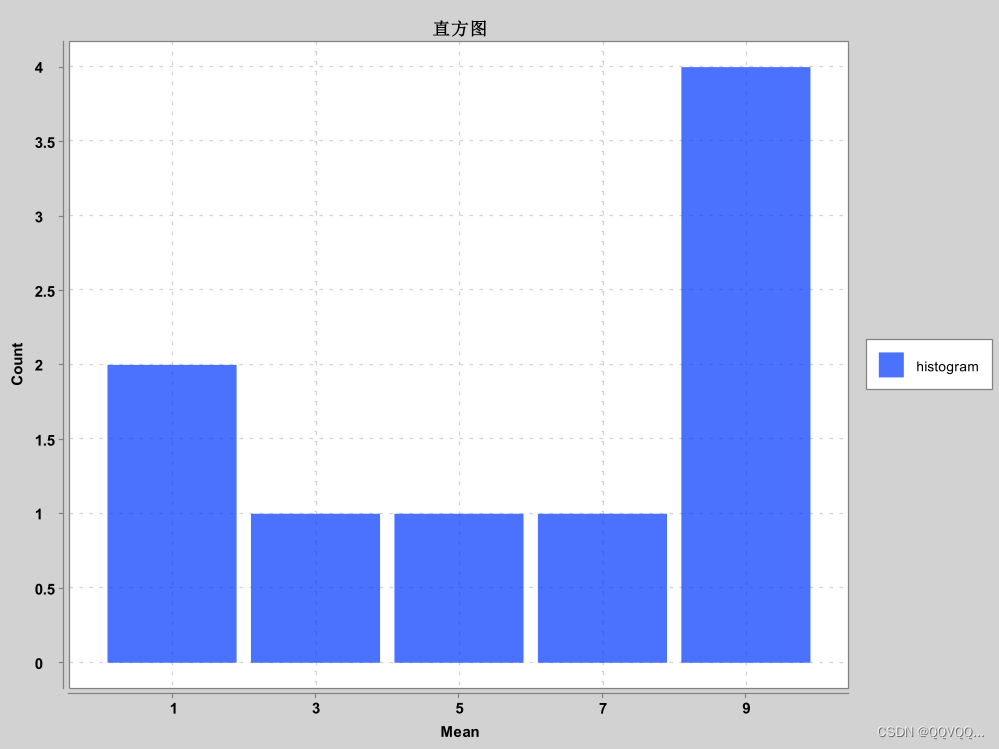
1. 基本直方图
package plot;import java.util.Arrays;import org.knowm.xchart.CategoryChart;
import org.knowm.xchart.CategoryChartBuilder;
import org.knowm.xchart.Histogram;
import org.knowm.xchart.SwingWrapper;public class Example {public static void main(String[] args) {// 创建ChartCategoryChart chart = new CategoryChartBuilder().width(800).height(600).title("直方图").xAxisTitle("Mean").yAxisTitle("Count").build();// 添加数据源Histogram histogram = new Histogram(Arrays.asList(new Number[] { 1, 1, 3, 5, 7, 9, 10, 10, 10 }), 5, 0, 10);chart.addSeries("histogram", histogram.getxAxisData(), histogram.getyAxisData());// 进行展示new SwingWrapper<CategoryChart>(chart).displayChart();}}
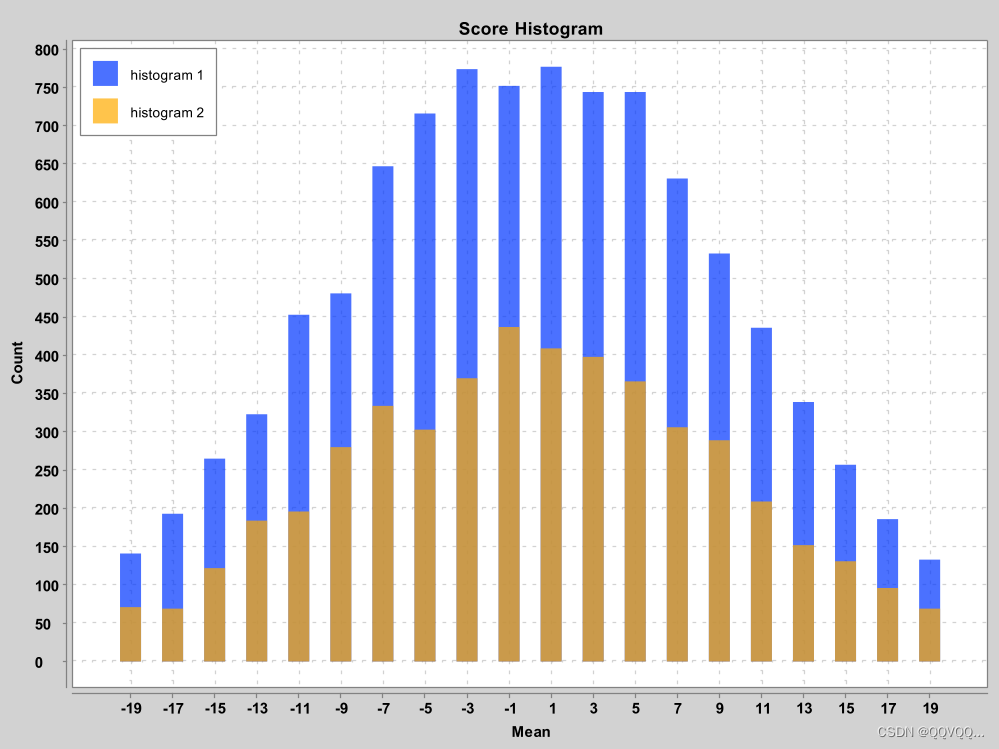
2. 堆积直方图
package plot;import java.util.ArrayList;
import java.util.List;
import java.util.Random;import org.knowm.xchart.CategoryChart;
import org.knowm.xchart.CategoryChartBuilder;
import org.knowm.xchart.Histogram;
import org.knowm.xchart.SwingWrapper;
import org.knowm.xchart.style.Styler.LegendPosition;public class Example {public static void main(String[] args) {// 创建ChartCategoryChart chart = new CategoryChartBuilder().width(800).height(600).title("Score Histogram").xAxisTitle("Mean").yAxisTitle("Count").build();// 自定义Chartchart.getStyler().setLegendPosition(LegendPosition.InsideNW);chart.getStyler().setAvailableSpaceFill(.5); // 设置有效填充区域占比chart.getStyler().setOverlapped(true);// 添加数据源Histogram histogram1 = new Histogram(getGaussianData(10000), 20, -20, 20);Histogram histogram2 = new Histogram(getGaussianData(5000), 20, -20, 20);chart.addSeries("histogram 1", histogram1.getxAxisData(), histogram1.getyAxisData());chart.addSeries("histogram 2", histogram2.getxAxisData(), histogram2.getyAxisData());// 显示图表new SwingWrapper<CategoryChart>(chart).displayChart();}private static List<Double> getGaussianData(int count) {List<Double> data = new ArrayList<Double>(count);Random r = new Random();for (int i = 0; i < count; i++) {data.add(r.nextGaussian() * 10);}return data;}
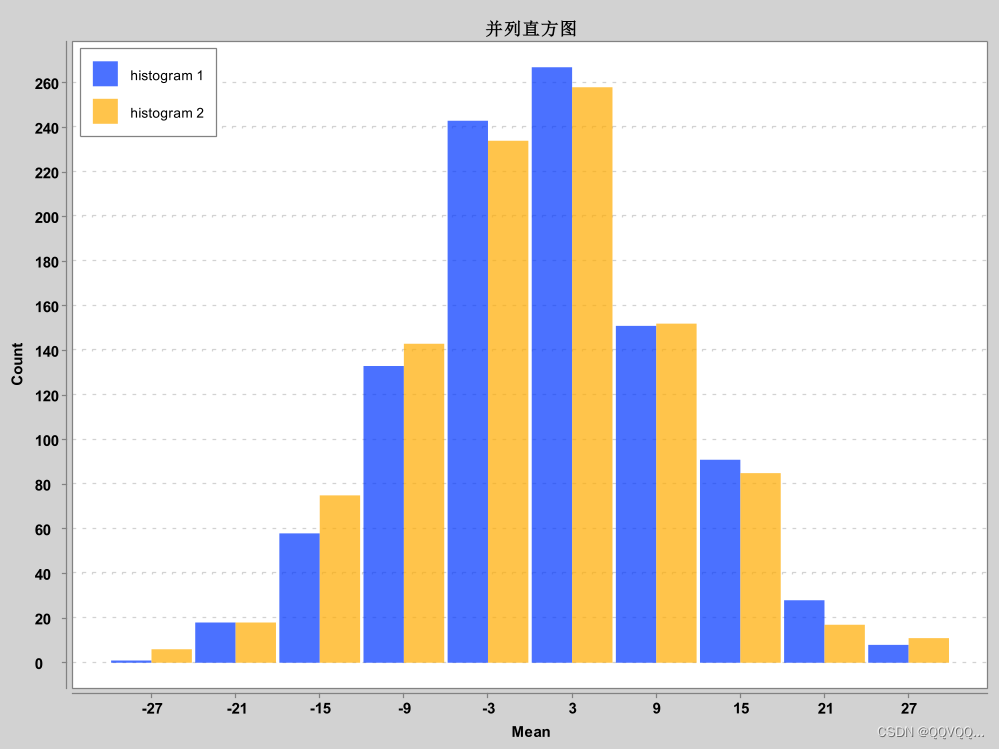
}3. 并列直方图
package plot;import java.util.ArrayList;
import java.util.List;
import java.util.Random;import org.knowm.xchart.CategoryChart;
import org.knowm.xchart.CategoryChartBuilder;
import org.knowm.xchart.Histogram;
import org.knowm.xchart.SwingWrapper;
import org.knowm.xchart.style.Styler;
import org.knowm.xchart.style.Styler.LegendPosition;public class Example {public static void main(String[] args) {// 创建Chart对象CategoryChart chart =new CategoryChartBuilder().width(800).height(600).title("并列直方图").xAxisTitle("Mean").yAxisTitle("Count").build();// 自定义图表对象chart.getStyler().setLegendPosition(LegendPosition.InsideNW);chart.getStyler().setAvailableSpaceFill(.96);chart.getStyler().setPlotGridVerticalLinesVisible(false);chart.getStyler().setToolTipsEnabled(true);chart.getStyler().setToolTipType(Styler.ToolTipType.yLabels);// 添加数据源Histogram histogram1 = new Histogram(getGaussianData(1000), 10, -30, 30);chart.addSeries("histogram 1", histogram1.getxAxisData(), histogram1.getyAxisData());Histogram histogram2 = new Histogram(getGaussianData(1000), 10, -30, 30);chart.addSeries("histogram 2", histogram2.getxAxisData(), histogram2.getyAxisData());//进行展示new SwingWrapper<CategoryChart>(chart).displayChart();}private static List<Integer> getGaussianData(int count) {List<Integer> data = new ArrayList<Integer>(count);Random r = new Random();for (int i = 0; i < count; i++) {data.add((int) (r.nextGaussian() * 10));}return data;}}
四、散点图
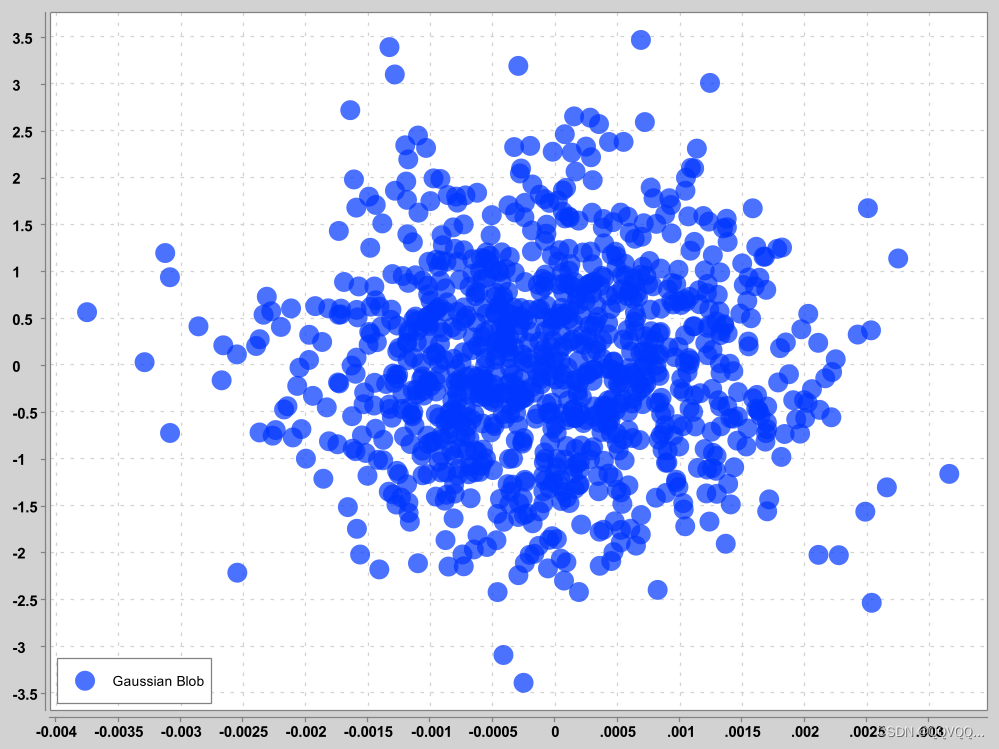
package plot;import java.util.LinkedList;
import java.util.List;
import java.util.Random;import org.knowm.xchart.SwingWrapper;
import org.knowm.xchart.XYChart;
import org.knowm.xchart.XYChartBuilder;
import org.knowm.xchart.XYSeries.XYSeriesRenderStyle;
import org.knowm.xchart.style.Styler.LegendPosition;public class SampleXchart {public static void main(String[] args) {// Create ChartXYChart chart = new XYChartBuilder().width(800).height(600).build();// 设置图表样式chart.getStyler().setDefaultSeriesRenderStyle(XYSeriesRenderStyle.Scatter);chart.getStyler().setChartTitleVisible(false);chart.getStyler().setLegendPosition(LegendPosition.InsideSW);chart.getStyler().setMarkerSize(16);// 添加数据List<Double> xData = new LinkedList<Double>();List<Double> yData = new LinkedList<Double>();Random random = new Random();int size = 1000;for (int i = 0; i < size; i++) {xData.add(random.nextGaussian() / 1000);yData.add(random.nextGaussian());}chart.addSeries("Gaussian Blob", xData, yData);// 展示图表new SwingWrapper<XYChart>(chart).displayChart();}
}
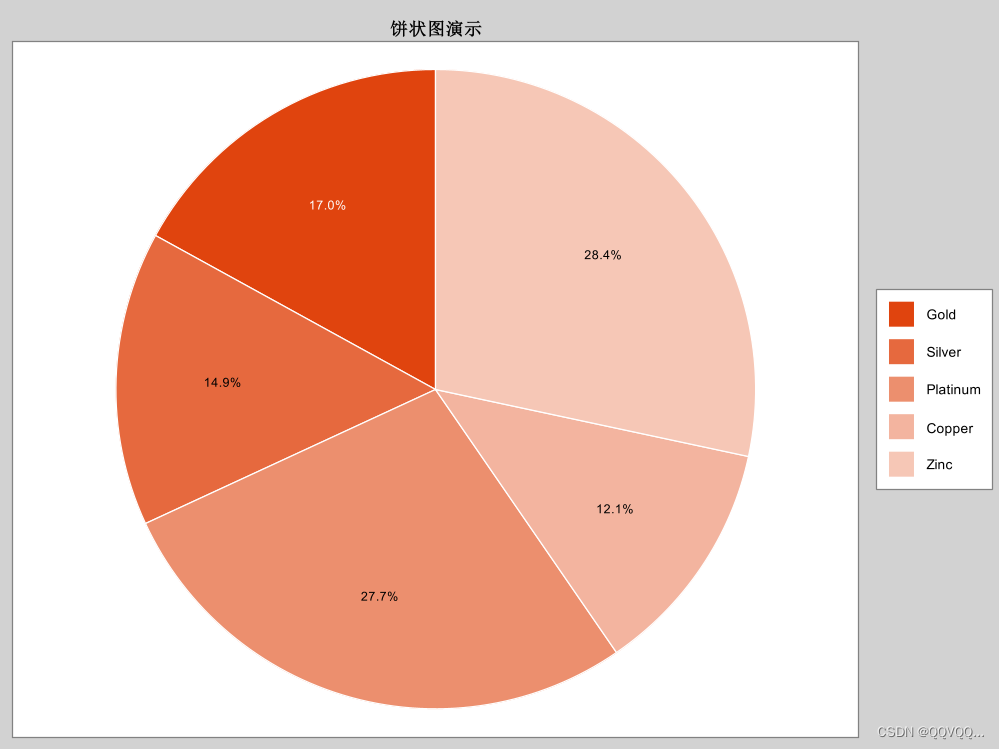
五、饼状图
package plot;import java.awt.Color;import org.knowm.xchart.PieChart;
import org.knowm.xchart.PieChartBuilder;
import org.knowm.xchart.SwingWrapper;public class BarChart01 {public static void main(String[] args) {PieChart chart = new PieChartBuilder().width(800).height(600).title("饼状图演示").build();// 创建ChartColor[] sliceColors = new Color[] { new Color(224, 68, 14), new Color(230, 105, 62), new Color(236, 143, 110), new Color(243, 180, 159), new Color(246, 199, 182) };chart.getStyler().setSeriesColors(sliceColors);// 添加数据源chart.addSeries("Gold", 24);chart.addSeries("Silver", 21);chart.addSeries("Platinum", 39);chart.addSeries("Copper", 17);chart.addSeries("Zinc", 40);// 进行展示new SwingWrapper<PieChart>(chart).displayChart();}}
六、绘制多幅图表
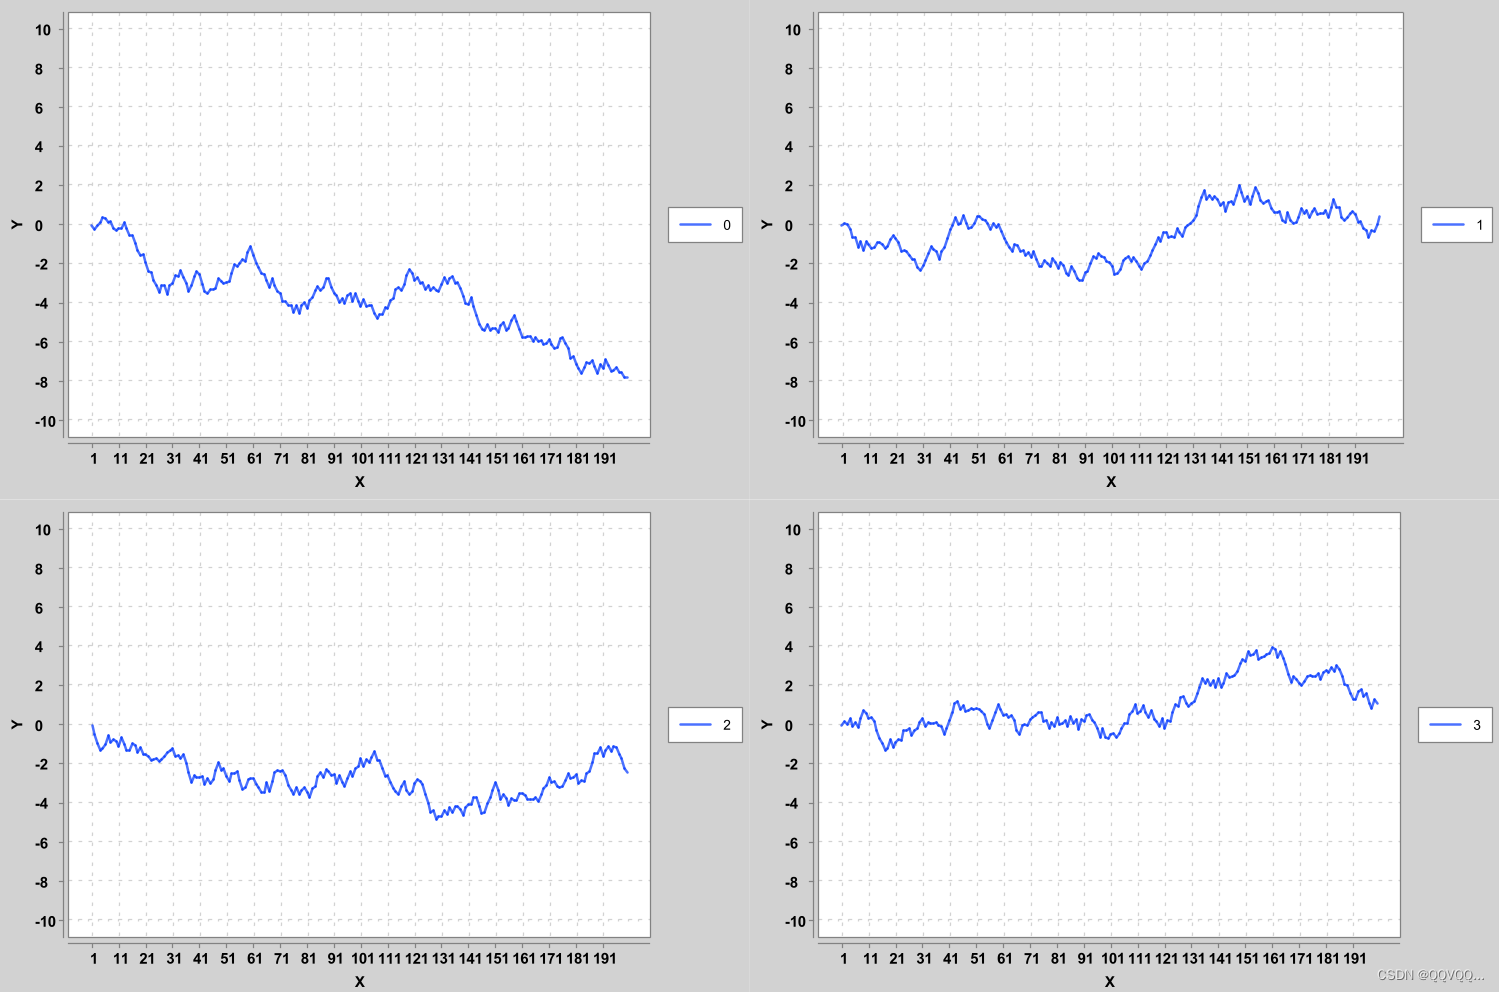
package plot;import java.util.ArrayList;
import java.util.List;import org.knowm.xchart.SwingWrapper;
import org.knowm.xchart.XYChart;
import org.knowm.xchart.XYChartBuilder;
import org.knowm.xchart.XYSeries;
import org.knowm.xchart.style.markers.SeriesMarkers;public class Example {public static void main(String[] args) {int numCharts = 4;List<XYChart> charts = new ArrayList<XYChart>();for (int i = 0; i < numCharts; i++) {XYChart chart = new XYChartBuilder().xAxisTitle("X").yAxisTitle("Y").width(600).height(400).build();chart.getStyler().setYAxisMin(-10.0); // 设置y轴的最小值chart.getStyler().setYAxisMax(10.0);  // 设置y轴的最大值// 添加数据源XYSeries series = chart.addSeries("" + i, null, getRandomWalk(200));// 不显示标记series.setMarker(SeriesMarkers.NONE);charts.add(chart);}// 显示图表new SwingWrapper<XYChart>(charts).displayChartMatrix();}/*** 产生随机游走数据** @param numPoints* @return*/private static double[] getRandomWalk(int numPoints) {double[] y = new double[numPoints];y[0] = 0;for (int i = 1; i < y.length; i++) {y[i] = y[i - 1] + Math.random() - .5;}return y;}}
七、自定义图表
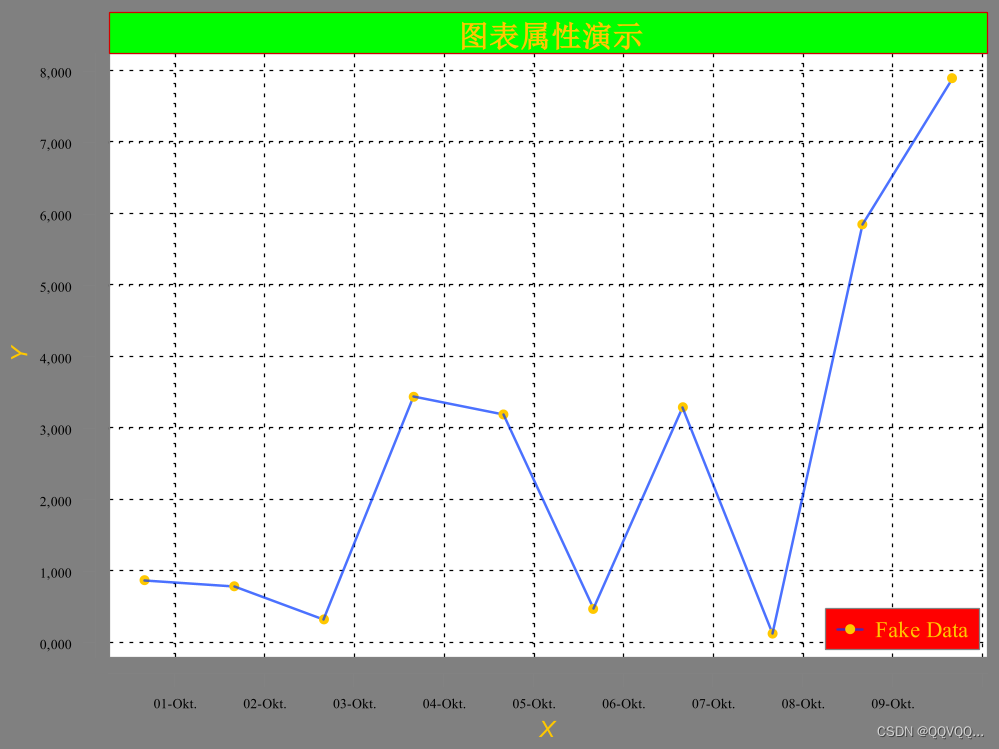
1. 基本自定义选项
package plot;import java.awt.Color;
import java.awt.Font;
import java.text.DateFormat;
import java.text.ParseException;
import java.text.SimpleDateFormat;
import java.util.ArrayList;
import java.util.Date;
import java.util.List;
import java.util.Locale;import org.knowm.xchart.SwingWrapper;
import org.knowm.xchart.XYChart;
import org.knowm.xchart.XYChartBuilder;
import org.knowm.xchart.XYSeries;
import org.knowm.xchart.style.Styler.LegendPosition;
import org.knowm.xchart.style.colors.XChartSeriesColors;
import org.knowm.xchart.style.lines.SeriesLines;
import org.knowm.xchart.style.markers.SeriesMarkers;public class Example {public static void main(String[] args) {// 创建Chart对象XYChart chart = new XYChartBuilder().width(800).height(600).title("图表属性演示").xAxisTitle("X").yAxisTitle("Y").build();//=====================自定义图表对象=====================// 设置图表背景色chart.getStyler().setPlotBackgroundColor(Color.white);// 设置图表网格线是否可见chart.getStyler().setPlotGridLinesVisible(true);// 设置图表网格线颜色chart.getStyler().setPlotGridLinesColor(Color.black);// 设置图形背景色chart.getStyler().setChartBackgroundColor(Color.gray);// 设置图例背景色chart.getStyler().setLegendBackgroundColor(Color.red);// 设置图形字体颜色chart.getStyler().setChartFontColor(Color.orange);// 设置图形标题方框背景色chart.getStyler().setChartTitleBoxBackgroundColor(Color.green);// 设置图形标题方框是否可见chart.getStyler().setChartTitleBoxVisible(true);// 设置图形标题方框边缘颜色chart.getStyler().setChartTitleBoxBorderColor(new Color(210, 2, 0));// 设置坐标轴刻度与图表的距离chart.getStyler().setAxisTickPadding(10);chart.getStyler().setAxisTickMarkLength(10);// 设置绘图边框chart.getStyler().setPlotMargin(10);// 设置图表标题字体chart.getStyler().setChartTitleFont(new Font(Font.MONOSPACED, Font.BOLD, 24));// 设置图例字体chart.getStyler().setLegendFont(new Font(Font.SERIF, Font.PLAIN, 18));// 设置图例位置chart.getStyler().setLegendPosition(LegendPosition.InsideSE);// 设置图例线条长度chart.getStyler().setLegendSeriesLineLength(20);// 设置坐标轴字体chart.getStyler().setAxisTitleFont(new Font(Font.SANS_SERIF, Font.ITALIC, 18));// 设置坐标轴刻度字体chart.getStyler().setAxisTickLabelsFont(new Font(Font.SERIF, Font.PLAIN, 11));// 设置日期样式chart.getStyler().setDatePattern("dd-MMM");// 设置十进制样式chart.getStyler().setDecimalPattern("#0.000");// 设置区域chart.getStyler().setLocale(Locale.GERMAN);// 生成数据List<Date> xData = new ArrayList<Date>();List<Double> yData = new ArrayList<Double>();DateFormat sdf = new SimpleDateFormat("dd.MM.yyyy");Date date = null;for (int i = 1; i <= 10; i++) {try {date = sdf.parse(i + ".10.2008");} catch (ParseException e) {e.printStackTrace();}xData.add(date);yData.add(Math.random() * i);}// 设置数据样式XYSeries series = chart.addSeries("Fake Data", xData, yData);series.setLineColor(XChartSeriesColors.BLUE);series.setMarkerColor(Color.ORANGE);series.setMarker(SeriesMarkers.CIRCLE);series.setLineStyle(SeriesLines.SOLID);// 显示图表new SwingWrapper<XYChart>(chart).displayChart();}
}
2. Matlab风格

package plot;import java.util.ArrayList;
import java.util.Arrays;
import java.util.List;import org.knowm.xchart.SwingWrapper;
import org.knowm.xchart.XYChart;
import org.knowm.xchart.XYChartBuilder;
import org.knowm.xchart.XYSeries;
import org.knowm.xchart.style.Styler.ChartTheme;
import org.knowm.xchart.style.markers.SeriesMarkers;public class Example {public static void main(String[] args) {// 创建ChartXYChart chart = new XYChartBuilder().width(800).height(600).theme(ChartTheme.Matlab).title("Matlab Theme").xAxisTitle("X").yAxisTitle("Y").build();// 添加数据源chart.getStyler().setPlotGridLinesVisible(false);chart.getStyler().setXAxisTickMarkSpacingHint(100);// SeriesList<Integer> xData = new ArrayList<Integer>();for (int i = 0; i < 640; i++) {xData.add(i);}List<Double> y1Data = getYAxis(xData, 320, 160);List<Double> y2Data = getYAxis(xData, 320, 320);List<Double> y3Data = new ArrayList<Double>(xData.size());for (int i = 0; i < 640; i++) {y3Data.add(y1Data.get(i) - y2Data.get(i));}XYSeries series = chart.addSeries("Gaussian 1", xData, y1Data);series.setMarker(SeriesMarkers.NONE);series = chart.addSeries("Gaussian 2", xData, y2Data);series.setMarker(SeriesMarkers.NONE);series = chart.addSeries("Difference", xData, y3Data);series.setMarker(SeriesMarkers.NONE);// 进行展示new SwingWrapper<XYChart>(chart).displayChart();}private static List<Double> getYAxis(List<Integer> xData, double mean, double std) {List<Double> yData = new ArrayList<Double>(xData.size());for (int i = 0; i < xData.size(); i++) {yData.add((1 / (std * Math.sqrt(2 * Math.PI)))* Math.exp(-(((xData.get(i) - mean) * (xData.get(i) - mean)) / ((2 * std * std)))));}return yData;}}
八、保存图片到本地
BitmapEncoder.saveBitmap(chart, "./Sample_Chart", BitmapFormat.PNG);
BitmapEncoder.saveBitmap(chart, "./Sample_Chart", BitmapFormat.JPG);
BitmapEncoder.saveJPGWithQuality(chart, "./Sample_Chart_With_Quality.jpg", 0.95f);
BitmapEncoder.saveBitmap(chart, "./Sample_Chart", BitmapFormat.BMP);
BitmapEncoder.saveBitmap(chart, "./Sample_Chart", BitmapFormat.GIF);BitmapEncoder.saveBitmapWithDPI(chart, "./Sample_Chart_300_DPI", BitmapFormat.PNG, 300);
BitmapEncoder.saveBitmapWithDPI(chart, "./Sample_Chart_300_DPI", BitmapFormat.JPG, 300);
BitmapEncoder.saveBitmapWithDPI(chart, "./Sample_Chart_300_DPI", BitmapFormat.GIF, 300);VectorGraphicsEncoder.saveVectorGraphic(chart, "./Sample_Chart", VectorGraphicsFormat.EPS);
VectorGraphicsEncoder.saveVectorGraphic(chart, "./Sample_Chart", VectorGraphicsFormat.PDF);
VectorGraphicsEncoder.saveVectorGraphic(chart, "./Sample_Chart", VectorGraphicsFormat.SVG);