本节内容我们聚焦到androidQ上,分析android中一个用于debug的功能,那就是tombstone,俗称“墓碑”。现实生活中墓碑一般是给死人准备的,而在android系统中“墓碑”则是给进程准备的。
为何Android要设计出这样一个东西呢? 因为android系统是运行在Linux Kernel内核之上的,当内核出现异常,则内核异常机制会分辨出是什么原因,处理不了的直接panic。而对于运行在Linux Kernel内核之上的android系统,如果出现异常,一般会自动重启android层的,这就导致问题很难复现定位debug,则当android层出现异常,通常会将进程的上下文信息保存到tombstone(墓碑)中,方便后续的debug调试。

上图是一张经典的android系统架构图,而我们的墓碑主要是给Native 层的进程准备的,主要用于分析NativeCrash。因为Kernel Crash整个系统直接就panic了,内核会打印出对应的call trace,对于Java层的代码出错也会有对应的异常抛出的。所以墓碑主要是给Native层的进程准备的。
Tombstone初识
tombstone到底长啥样呢? 当android系统出现异常时,会在/data/tombstones目录生成对应的tombstone文件
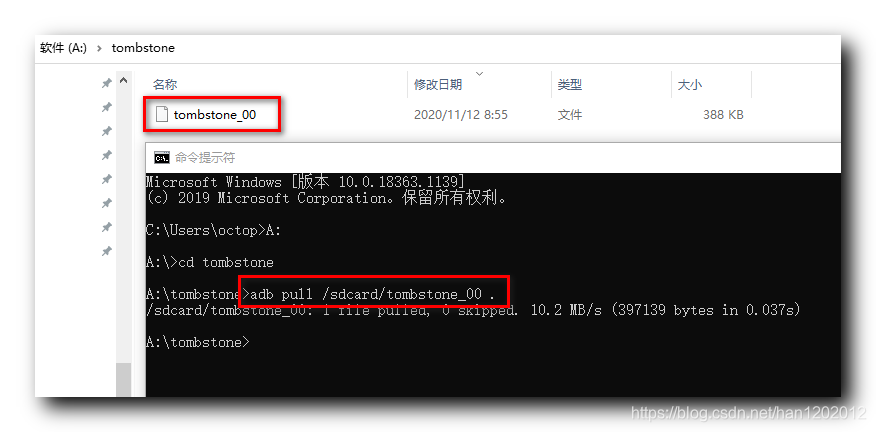
root:/data/tombstones # ls -l
-rw-r----- 1 tombstoned system 3454991 2020-03-13 18:10 tombstone_00
-rw-rw-rw- 1 root       root         0 2020-03-14 10:28 tombstone_01
-rw-r----- 1 root       root   3454991 2020-03-14 10:29 tombstone_02
-rw-r----- 1 root       root   3454991 2020-03-14 10:29 tombstone_03
打开一个文件,看看tombstone到底长啥样
*** *** *** *** *** *** *** *** *** *** *** *** *** *** *** ***
Build fingerprint: 'dev/good_dev/2020.3.6_china_dev_test:user/test-keys'
Revision: '0'
ABI: 'arm'
Timestamp: 2020-03-07 02:46:27+0800
pid: 23051, tid: 23051, name: .tencent.qqlive  >>> com.tencent.qqlive <<<
uid: 10256
signal 11 (SIGSEGV), code 1 (SEGV_MAPERR), fault addr 0xdb3fb000r0  db3f9000  r1  00000000  r2  00023780  r3  db3fb000r4  cd5ef340  r5  db3f9000  r6  e7a1e260  r7  cd62c6e0r8  cd668190  r9  ffc417a8  r10 00000001  r11 d1ffa760ip  00000000  sp  ffc41768  lr  b9466590  pc  e79bfd58backtrace:#00 pc 0005dd58  /apex/com.android.runtime/lib/bionic/libc.so (memset_a7+48) (BuildId: dcf0e174e93e33d22f35a631ba9c0de5)#01 pc 0001258c  /data/app/com.tencent.qqlive-NGSZiLGPko8T894J1J65kQ==/lib/arm/libmarsxlog.so (LogBuffer::__Clear()+36) (BuildId: 05f64491a5d2ace3d88e1623fefbc695c32396ba)#02 pc 0000ff68  /data/app/com.tencent.qqlive-NGSZiLGPko8T894J1J65kQ==/lib/arm/libmarsxlog.so (appender_open(TAppenderMode, char const*, char const*, char const*)+560) (BuildId: 05f64491a5d2ace3d88e1623fefbc695c32396ba)#03 pc 00010ca8  /data/app/com.tencent.qqlive-NGSZiLGPko8T894J1J65kQ==/lib/arm/libmarsxlog.so (appender_open_with_cache(TAppenderMode, std::string const&, std::string const&, char const*, char const*)+1652) (BuildId: 05f64491a5d2ace3d88e1623fefbc695c32396ba)#04 pc 000051cc  /data/app/com.tencent.qqlive-NGSZiLGPko8T894J1J65kQ==/lib/arm/libmarsxlog.so (Java_com_tencent_mars_xlog_Xlog_appenderOpen+428) (BuildId: 05f64491a5d2ace3d88e1623fefbc695c32396ba)#05 pc 000db673  /data/app/com.tencent.qqlive-NGSZiLGPko8T894J1J65kQ==/oat/arm/base.odex (art_jni_trampoline+210)
此文件比较长,我们目前只贴一部分,本节的内容不是分析tombstone内容的含义,本节重点分析此文件生成的过程,明白了是如何生成的,后续再分析此文件的内容是什么含义,以及如何去分析解决此类问题。
NULL指针例子回顾
我们在上一节NULL指针的奇妙之旅中详细讲解了当CPU去访问NULL指针,操作系统内部的一系列活动,最后在控制台打印出耳熟能详的"Segmetation Faule"。在这里我们回顾下,因为这个过程可以套用今天的tombstone的生产过程。
- 当CPU去访问一个虚拟地址,肯定会经过MMU去查对应的虚实关系的
- 一旦虚拟地址是非法的,MMU硬件单元则会触发异常,CPU则去异常向量表执行对应的异常
- 经过处理后Linux内核对userspace的异常则通过信号的方式通知给对应的进程
- 当进程一旦收到信号,则会执行对应的信号处理函数。
- 信号处理函数的安装一般会在glibc中做的,glibc会对所有的通用信号做默认的处理的。
回到android系统中,当一个Native的进程触发了NULL指针,首先CPU会收到对应异常,然后去执行异常,接着会通过发生SIGSEGV的信号,信号处理函数则会去处理信号,处理信号的过程中,则就会保存进程的现场,最后留下墓碑供后人膜拜。
通过上面的描述,我们大概已经推测出tombstone的大致实现流程了,接下来就去验证猜想了。
进程是如何运行起来的
这里简单描述下android中一个进程是如何跑起来的。这里以微信app为例子说明
- 微信app首先是存储在UFS,EMMC指令的存储设备上
- 当用户去点击微信app图标时,操作系统则会将微信app从Flash load到主存中
- 肯定要去通过fork类似命令去创建对应的进程
- 进程创建完毕需要通过exec类似的命令去加载微信的内容
- 最后由/system/bin/linker程序负责加载微信程序用到的一些共享库,
- 最终跳转到微信程序的入口处执行
以上就是一个简单的描述一个程序时如何运行起来的,我们直接看下android系统中/system/bin/linker代码
代码路径: /bionic/linker/arch/arm64/begin.SENTRY(_start)// Force unwinds to end in this function..cfi_undefined x30mov x0, spbl __linker_init/* linker init returns the _entry address in the main image */br x0
END(_start)
首先肯定是跳转到linker的代码段去执行,跳转到__linker_init函数处
/** This is the entry point for the linker, called from begin.S.*/
extern "C" ElfW(Addr) __linker_init(void* raw_args) {tmp_linker_so.base = linker_addr;tmp_linker_so.size = phdr_table_get_load_size(phdr, elf_hdr->e_phnum);tmp_linker_so.load_bias = get_elf_exec_load_bias(elf_hdr);tmp_linker_so.dynamic = nullptr;tmp_linker_so.phdr = phdr;tmp_linker_so.phnum = elf_hdr->e_phnum;tmp_linker_so.set_linker_flag();return __linker_init_post_relocation(args, tmp_linker_so);
}
在Linker_init中会根据链接地址,以及elf的头等信息,去重新计算是否需要重定位之类的
static ElfW(Addr) __attribute__((noinline))
__linker_init_post_relocation(KernelArgumentBlock& args, soinfo& tmp_linker_so) {// Initialize the linker's static libc's globals__libc_init_globals();// Initialize the linker's own global variablestmp_linker_so.call_constructors();ElfW(Addr) start_address = linker_main(args, exe_to_load);INFO("[ Jumping to _start (%p)... ]", reinterpret_cast<void*>(start_address));
}
通过linker_main函数返回可执行程序的开始地址,然后跳转过去执行。我们重点看下linker_main函数
static ElfW(Addr) linker_main(KernelArgumentBlock& args, const char* exe_to_load) {ProtectedDataGuard guard;// Register the debuggerd signal handler.
#ifdef __ANDROID__debuggerd_callbacks_t callbacks = {.get_abort_message = []() {return __libc_shared_globals()->abort_msg;},.post_dump = ¬ify_gdb_of_libraries,};debuggerd_init(&callbacks);
#endif重点关注这里,当时android系统的话,则会去初始化debggerd_init,此函数中会按照信号的默认处理函数的
void debuggerd_init(debuggerd_callbacks_t* callbacks) {struct sigaction action;memset(&action, 0, sizeof(action));sigfillset(&action.sa_mask);action.sa_sigaction = debuggerd_signal_handler;action.sa_flags = SA_RESTART | SA_SIGINFO;// Use the alternate signal stack if available so we can catch stack overflows.action.sa_flags |= SA_ONSTACK;debuggerd_register_handlers(&action);
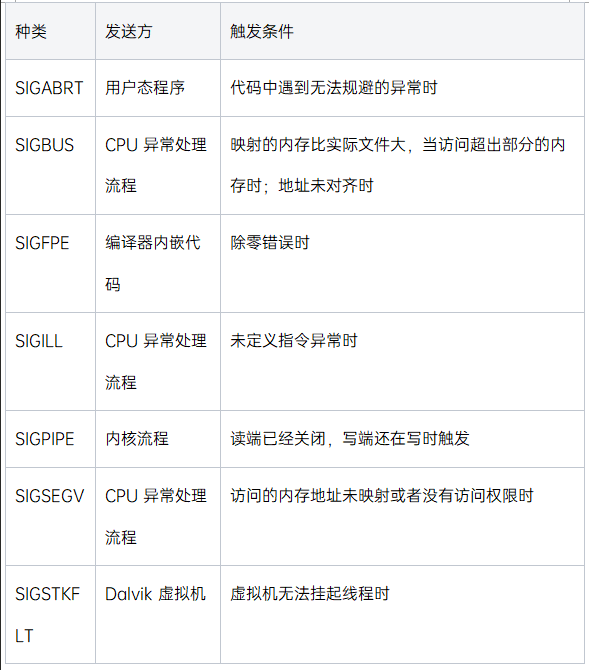
}static void __attribute__((__unused__)) debuggerd_register_handlers(struct sigaction* action) {sigaction(SIGABRT, action, nullptr);sigaction(SIGBUS, action, nullptr);sigaction(SIGFPE, action, nullptr);sigaction(SIGILL, action, nullptr);sigaction(SIGSEGV, action, nullptr);
#if defined(SIGSTKFLT)sigaction(SIGSTKFLT, action, nullptr);
#endifsigaction(SIGSYS, action, nullptr);sigaction(SIGTRAP, action, nullptr);sigaction(DEBUGGER_SIGNAL, action, nullptr);
}可以看到这里注册了一些异常信号,而信号的action处理函数是debuggerd_signal_handler。
当异常发生
比如当Native进程出现了null指针问题,则通过linux内核判断会发生信号,最终信号由debuggerd_signal_handler函数处理
debuggerd_signal_handler
static void debuggerd_signal_handler(int signal_number, siginfo_t* info, void* context) {// Only allow one thread to handle a signal at a time.int ret = pthread_mutex_lock(&crash_mutex);if (ret != 0) {async_safe_format_log(ANDROID_LOG_INFO, "libc", "pthread_mutex_lock failed: %s", strerror(ret));return;}log_signal_summary(info);
}
使用pthread_mutex_lock防止同一时间多个线程同时来处理信号,后面则调用log_signal_summary函数来打印一些信息
async_safe_format_log(ANDROID_LOG_FATAL, "libc","Fatal signal %d (%s), code %d (%s%s)%s in tid %d (%s), pid %d (%s)",info->si_signo, get_signame(info), info->si_code, get_sigcode(info),sender_desc, addr_desc, __gettid(), thread_name, self_pid, main_thread_name)这里这么做的目的是防止后面动作出错,最终不能确定是那个进程出错的,此处先打印一些关键信息。可以从logcat中找到对应的信息
libc : Fatal signal 11 (SIGSEGV), code 1 (SEGV_MAPERR), fault addr 0xdb3fb000 in tid 23051 (.tencent.qqlive), pid 23051 (.tencent.qqlive)- 信号的num,比如信号11代表的是SIGSEGV
- 信号code,SEGV_MAPERR,就代表映射出错了
- fault addr,出错时的地址
- tid: 对应的线程ID
- pid: 对应的进程ID,如果一个进程中有好多线程,则每个线程的id是不一样的。
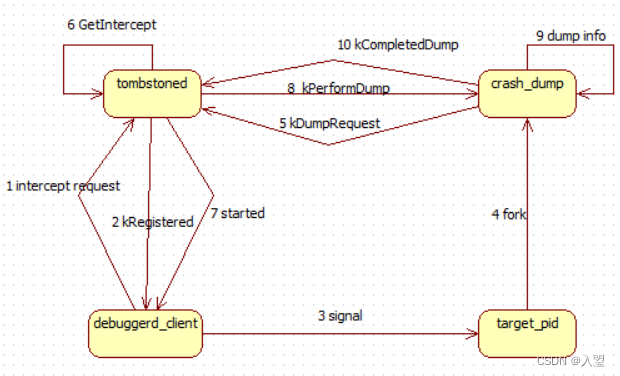
pid_t child_pid =clone(debuggerd_dispatch_pseudothread, pseudothread_stack,CLONE_THREAD | CLONE_SIGHAND | CLONE_VM | CLONE_CHILD_SETTID | CLONE_CHILD_CLEARTID,&thread_info, nullptr, nullptr, &thread_info.pseudothread_tid);if (child_pid == -1) {fatal_errno("failed to spawn debuggerd dispatch thread");}// Wait for the child to start...futex_wait(&thread_info.pseudothread_tid, -1);// and then wait for it to terminate.futex_wait(&thread_info.pseudothread_tid, child_pid);接着是通过clone系统调用,clone出一个伪线程pseudothread线程,去dispatch处理信号,这里则等待子进程的开始以及结束
debuggerd_dispatch_pseudothread
pid_t crash_dump_pid = __fork();if (crash_dump_pid == -1) {async_safe_format_log(ANDROID_LOG_FATAL, "libc","failed to fork in debuggerd signal handler: %s", strerror(errno));} else if (crash_dump_pid == 0) {async_safe_format_buffer(main_tid, sizeof(main_tid), "%d", thread_info->crashing_tid);async_safe_format_buffer(pseudothread_tid, sizeof(pseudothread_tid), "%d",thread_info->pseudothread_tid);async_safe_format_buffer(debuggerd_dump_type, sizeof(debuggerd_dump_type), "%d",get_dump_type(thread_info));execle(CRASH_DUMP_PATH, CRASH_DUMP_NAME, main_tid, pseudothread_tid, debuggerd_dump_type,nullptr, nullptr);async_safe_format_log(ANDROID_LOG_FATAL, "libc", "failed to exec crash_dump helper: %s",strerror(errno));return 1;}在伪线程中通过fork去创建子线程,新创建的子线程中调动通过execle系统调用去执行crash_dump64程序,而父进程则在这里等待crash_dump进程退出
crash_dump进程
pid_t forkpid = fork();if (forkpid == -1) {PLOG(FATAL) << "fork failed";} else if (forkpid == 0) {fork_exit_read.reset();} else {// We need the pseudothread to live until we get around to verifying the vm pid against it.// The last thing it does is block on a waitpid on us, so wait until our child tells us to die.fork_exit_write.reset();char buf;TEMP_FAILURE_RETRY(read(fork_exit_read.get(), &buf, sizeof(buf)));_exit(0);}crash_dump进程则直接通过fork出一个新进程,父进程通过read去等待子进程,而子进程在继续执行crash_dump的任务
// Get the process name (aka cmdline).std::string process_name = get_process_name(g_target_thread);// Collect the list of open files.OpenFilesList open_files;{ATRACE_NAME("open files");populate_open_files_list(&open_files, g_target_thread);}- 获取进程的name,通过/proc/PID/cmdline获取进程的名字
- 获取此进程总共打开了多个文件,通过/proc/PID/fd/就可以获取此进程打开了多少个文件,每个文件都有一个文件描述符fd
{ATRACE_NAME("ptrace");for (pid_t thread : threads) {// Trace the pseudothread separately, so we can use different options.if (thread == pseudothread_tid) {continue;}if (!ptrace_seize_thread(target_proc_fd, thread, &error)) {bool fatal = thread == g_target_thread;LOG(fatal ? FATAL : WARNING) << error;}ThreadInfo info;info.pid = target_process;info.tid = thread;info.uid = getuid();info.process_name = process_name;info.thread_name = get_thread_name(thread);if (!ptrace_interrupt(thread, &info.signo)) {PLOG(WARNING) << "failed to ptrace interrupt thread " << thread;ptrace(PTRACE_DETACH, thread, 0, 0);continue;}if (thread == g_target_thread) {// Read the thread's registers along with the rest of the crash info out of the pipe.ReadCrashInfo(input_pipe, &siginfo, &info.registers, &abort_msg_address,&fdsan_table_address);info.siginfo = &siginfo;info.signo = info.siginfo->si_signo;} else {info.registers.reset(unwindstack::Regs::RemoteGet(thread));if (!info.registers) {PLOG(WARNING) << "failed to fetch registers for thread " << thread;ptrace(PTRACE_DETACH, thread, 0, 0);continue;}}thread_info[thread] = std::move(info);}}for循环遍历这个进程中的所有线程,对每一个进程中的线程进程ptrace操作,对目标线程读取其crashinfo。
// Detach from all of our attached threads before resuming.for (const auto& [tid, thread] : thread_info) {int resume_signal = thread.signo == DEBUGGER_SIGNAL ? 0 : thread.signo;if (wait_for_gdb) {resume_signal = 0;if (tgkill(target_process, tid, SIGSTOP) != 0) {PLOG(WARNING) << "failed to send SIGSTOP to " << tid;}}LOG(DEBUG) << "detaching from thread " << tid;if (ptrace(PTRACE_DETACH, tid, 0, resume_signal) != 0) {PLOG(ERROR) << "failed to detach from thread " << tid;}}读取crashinfo完毕后,则对每个thead做detach操作
tombstoned_connect
{ATRACE_NAME("tombstoned_connect");LOG(INFO) << "obtaining output fd from tombstoned, type: " << dump_type;g_tombstoned_connected =tombstoned_connect(g_target_thread, &g_tombstoned_socket, &g_output_fd, dump_type);}连接到tombstone进程,通过socket连接的。
// si_value is special when used with DEBUGGER_SIGNAL.// 0: dump tombstone// 1: dump backtraceif (!fatal_signal) {int si_val = siginfo.si_value.sival_int;if (si_val == 0) {backtrace = false;} else if (si_val == 1) {backtrace = true;} else {LOG(WARNING) << "unknown si_value value " << si_val;}}根据tombstone传递的参数做不同的判断,当参数=0时代表dump tombstone,等于1时,只dump backtrace
if (backtrace) {ATRACE_NAME("dump_backtrace");dump_backtrace(std::move(g_output_fd), &unwinder, thread_info, g_target_thread);} else {{ATRACE_NAME("fdsan table dump");populate_fdsan_table(&open_files, unwinder.GetProcessMemory(), fdsan_table_address);}{ATRACE_NAME("engrave_tombstone");engrave_tombstone(std::move(g_output_fd), &unwinder, thread_info, g_target_thread,abort_msg_address, &open_files, &amfd_data);}}最终tombstone是通过engrave_tombstone来进程生成的。
engrave_tombstone
void engrave_tombstone(unique_fd output_fd, unwindstack::Unwinder* unwinder,const std::map<pid_t, ThreadInfo>& threads, pid_t target_thread,uint64_t abort_msg_address, OpenFilesList* open_files,std::string* amfd_data) {// don't copy log messages to tombstone unless this is a dev devicebool want_logs = android::base::GetBoolProperty("ro.debuggable", false);log_t log;log.current_tid = target_thread;log.crashed_tid = target_thread;log.tfd = output_fd.get();log.amfd_data = amfd_data;_LOG(&log, logtype::HEADER, "*** *** *** *** *** *** *** *** *** *** *** *** *** *** *** ***\n");dump_header_info(&log);dump_timestamp(&log, time(nullptr));auto it = threads.find(target_thread);if (it == threads.end()) {LOG(FATAL) << "failed to find target thread";}dump_thread(&log, unwinder, it->second, abort_msg_address, true);if (want_logs) {dump_logs(&log, it->second.pid, 50);}for (auto& [tid, thread_info] : threads) {if (tid == target_thread) {continue;}dump_thread(&log, unwinder, thread_info, 0, false);}if (open_files) {_LOG(&log, logtype::OPEN_FILES, "\nopen files:\n");dump_open_files_list(&log, *open_files, " ");}if (want_logs) {dump_logs(&log, it->second.pid, 0);}
tombstone文件实例分析
tombstone标志性log开始: "*** *** *** *** *** *** *** *** *** *** *** *** *** *** *** ***"
*** *** *** *** *** *** *** *** *** *** *** *** *** *** *** ***dump_header_info打印头信息
static void dump_header_info(log_t* log) {auto fingerprint = GetProperty("ro.build.fingerprint", "unknown");auto revision = GetProperty("ro.revision", "unknown");_LOG(log, logtype::HEADER, "Build fingerprint: '%s'\n", fingerprint.c_str());_LOG(log, logtype::HEADER, "Revision: '%s'\n", revision.c_str());_LOG(log, logtype::HEADER, "ABI: '%s'\n", ABI_STRING);
}
示例如下:
Build fingerprint: 'dev/good_dev/2020.3.6_china_dev_test:user/test-keys'
Revision: '0'
ABI: 'arm'
dump_timestamp打印时间信息
static void dump_timestamp(log_t* log, time_t time) {struct tm tm;localtime_r(&time, &tm);char buf[strlen("1970-01-01 00:00:00+0830") + 1];strftime(buf, sizeof(buf), "%F %T%z", &tm);_LOG(log, logtype::HEADER, "Timestamp: %s\n", buf);
}
打印出差的时间,示例如下:
Timestamp: 2020-03-07 02:46:27+0800dump_thread_info打印thread信息
static void dump_thread_info(log_t* log, const ThreadInfo& thread_info) {// Blacklist logd, logd.reader, logd.writer, logd.auditd, logd.control ...// TODO: Why is this controlled by thread name?if (thread_info.thread_name == "logd" ||android::base::StartsWith(thread_info.thread_name, "logd.")) {log->should_retrieve_logcat = false;}_LOG(log, logtype::HEADER, "pid: %d, tid: %d, name: %s  >>> %s <<<\n", thread_info.pid,thread_info.tid, thread_info.thread_name.c_str(), thread_info.process_name.c_str());_LOG(log, logtype::HEADER, "uid: %d\n", thread_info.uid);
}
示例如下:
pid: 23051, tid: 23051, name: .tencent.qqlive  >>> com.tencent.qqlive <<<
uid: 10256
dump_signal_info打印信号信息
_LOG(log, logtype::HEADER, "signal %d (%s), code %d (%s%s), fault addr %s\n",thread_info.siginfo->si_signo, get_signame(thread_info.siginfo),thread_info.siginfo->si_code, get_sigcode(thread_info.siginfo), sender_desc, addr_desc);示例如下:
signal 11 (SIGSEGV), code 1 (SEGV_MAPERR), fault addr 0xdb3fb000dump_probable_cause打印可能原因信息
cause = StringPrintf("null pointer dereference");} else if (si->si_addr == reinterpret_cast<void*>(0xffff0ffc)) {cause = "call to kuser_helper_version";} else if (si->si_addr == reinterpret_cast<void*>(0xffff0fe0)) {cause = "call to kuser_get_tls";} else if (si->si_addr == reinterpret_cast<void*>(0xffff0fc0)) {cause = "call to kuser_cmpxchg";} else if (si->si_addr == reinterpret_cast<void*>(0xffff0fa0)) {cause = "call to kuser_memory_barrier";} else if (si->si_addr == reinterpret_cast<void*>(0xffff0f60)) {cause = "call to kuser_cmpxchg64";}if (!cause.empty()) _LOG(log, logtype::HEADER, "Cause: %s\n", cause.c_str());示例如下:
Cause: null pointer dereferencedump_registers打印寄存器信息
r0 db3f9000 r1 00000000 r2 00023780 r3 db3fb000r4 cd5ef340 r5 db3f9000 r6 e7a1e260 r7 cd62c6e0r8 cd668190 r9 ffc417a8 r10 00000001 r11 d1ffa760ip 00000000 sp ffc41768 lr b9466590 pc e79bfd58log_backtrace打印backtrace的信息
backtrace:#00 pc 0005dd58 /apex/com.android.runtime/lib/bionic/libc.so (memset_a7+48) (BuildId: dcf0e174e93e33d22f35a631ba9c0de5)#01 pc 0001258c /data/app/com.tencent.qqlive-NGSZiLGPko8T894J1J65kQ==/lib/arm/libmarsxlog.so (LogBuffer::__Clear()+36) (BuildId: 05f64491a5d2ace3d88e1623fefbc695c32396ba)#02 pc 0000ff68 /data/app/com.tencent.qqlive-NGSZiLGPko8T894J1J65kQ==/lib/arm/libmarsxlog.so (appender_open(TAppenderMode, char const*, char const*, char const*)+560) (BuildId: 05f64491a5d2ace3d88e1623fefbc695c32396ba)#03 pc 00010ca8 /data/app/com.tencent.qqlive-NGSZiLGPko8T894J1J65kQ==/lib/arm/libmarsxlog.so (appender_open_with_cache(TAppenderMode, std::string const&, std::string const&, char const*, char const*)+1652) (BuildId: 05f64491a5d2ace3d88e1623fefbc695c32396ba)#04 pc 000051cc /data/app/com.tencent.qqlive-NGSZiLGPko8T894J1J65kQ==/lib/arm/libmarsxlog.so (Java_com_tencent_mars_xlog_Xlog_appenderOpen+428) (BuildId: 05f64491a5d2ace3d88e1623fefbc695c32396ba)#05 pc 000db673 /data/app/com.tencent.qqlive-NGSZiLGPko8T894J1J65kQ==/oat/arm/base.odex (art_jni_trampoline+210)dump_stack打印stack的信息
stack:ffc41728 cd422400 [anon:libc_malloc]ffc4172c b946cc2b /data/app/com.tencent.qqlive-NGSZiLGPko8T894J1J65kQ==/lib/arm/libmarsxlog.soffc41730 ffc417b0 [stack]ffc41734 db3f9000 /data/data/com.tencent.qqlive/files/log/QQLiveLog.mmap2ffc41738 db3f9000 /data/data/com.tencent.qqlive/files/log/QQLiveLog.mmap2ffc4173c e7a1e260 [anon:.bss]ffc41740 ffc417b0 [stack]ffc41744 00001252ffc41748 e7a1e260 [anon:.bss]ffc4174c b946cc7b /data/app/com.tencent.qqlive-NGSZiLGPko8T894J1J65kQ==/lib/arm/libmarsxlog.soffc41750 00000000dump_memory_and_code打印memory的信息
memory near r0 (/data/data/com.tencent.qqlive/files/log/QQLiveLog.mmap2):db3f8fe0 -------- -------- -------- -------- ................db3f8ff0 -------- -------- -------- -------- ................db3f9000 02000109 00096a02 00000000 00000000 .....j..........db3f9010 bd0aa200 5ef280e3 000000cd 00000000 .......^........db3f9020 00000000 00000000 00000000 c6e85800 .............X..db3f9030 00000012 00000000 00000000 00000000 ................db3f9040 00000000 d5ef2800 838b8a0c 74d2c701 .....(.........tdb3f9050 05132305 73430323 ccd0cf20 cadcd4ca .#..#.Cs .......db3f9060 1d2e0cd0 6c646d17 03a86a60 622dcd24 .....mdl`j..$.-bdb3f9070 8c0c8da3 8c0d740c 15cc0d75 0c2c0db4 .....t..u.....,.db3f9080 8c0c140c accc4cac b963cc8c 00000000 .....L....c.....db3f9090 494affff c92851cd c8554dcc 48512d2f ..JI.Q(..MU./-QHdb3f90a0 2d49cccb 14ad7306 0000b80c ffff0000 ..I-.s..........db3f90b0 512d4f4a 2c4dcdc8 72180a80 00000001 JO-Q..M,...r....db3f90c0 75f2ffff 0f8e0a0c 52b1f20d 294fcdc8 ...u.......R..O)db3f90d0 f7d549cd e62a2c4d 00000002 8b02ffff .I..M,*.........dump_all_maps打印map的信息
memory map (2172 entries): (fault address prefixed with --->)0a125000-0a126fff r-- 0 2000 /system/bin/app_process32 (BuildId: 4b3fcbf21f6cb09225ed60ef016d3f87)0a127000-0a129fff r-x 2000 3000 /system/bin/app_process32 (BuildId: 4b3fcbf21f6cb09225ed60ef016d3f87)0a12a000-0a12afff r-- 5000 1000 /system/bin/app_process32 (BuildId: 4b3fcbf21f6cb09225ed60ef016d3f)0a12b000-0a12bfff rw- 0 100012c00000-15fbffff rw- 0 33c0000 [anon:dalvik-main space (region space)]15fc0000-161bffff rw- 0 200000 [anon:dalvik-main space (region space)] dump_log_file(log, pid, "system", tail);打印system log的信息
dump_log_file(log, pid, "main", tail);打印mainlog的信息
--------- tail end of log main
03-07 02:46:27.072 23051 23051 W System.err: 	at com.tencent.qqlive.ona.base.QQLiveApplication.attachBaseContext(QQLiveApplication.java:1223)
03-07 02:46:27.072 23051 23051 W System.err: 	at com.tencent.qqlive.ona.base.QQLiveApplicationWrapper.attachBaseContext(QQLiveApplicationWrapper.java:197)
03-07 02:46:27.073 23051 23051 W System.err: 	at android.app.Application.attach(Application.java:376)
总结

- 当Native进程发生了异常,比如NULL指针
- 操作系统会去异常向量表的地址去处理异常,然后发送信号
- 在debuggred_init注册的信号处理函数就会收到处理
- 创建伪线程去启动crash_dump进程,crash_dump则会获取当前进程中各个线程的crash信息
- tombstoned进程是开机就启动的,开机时注册好了socket等待监听
- 当在crash_dump中去连接tombstoned进程的时候,根据传递的dump_type类型会返回一个/data/tombstones/下文件描述符
- crash_dump进程后续通过engrave_tombstone函数将所有的线程的详细信息写入到tombstone文件中
- 则就在/data/tombstones下生成了此次对应的tombstone_XX文件


![OpenHarmony啃论文俱乐部—盘点开源鸿蒙引用的三方开源软件[1]](https://img-blog.csdnimg.cn/img_convert/9f5bf9c110d2ecfc54abf0b39fe6e243.png)