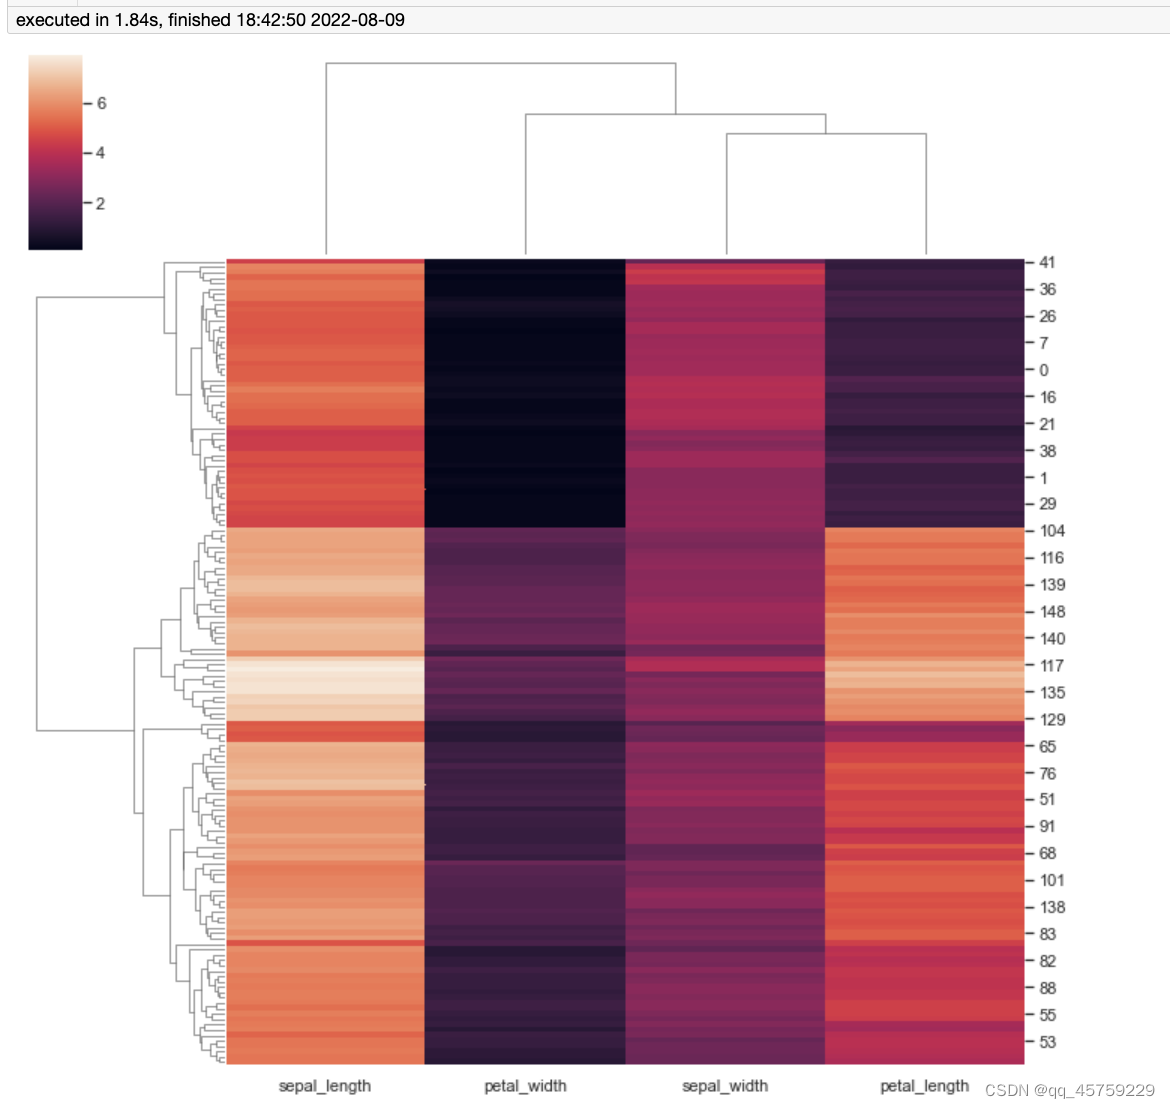
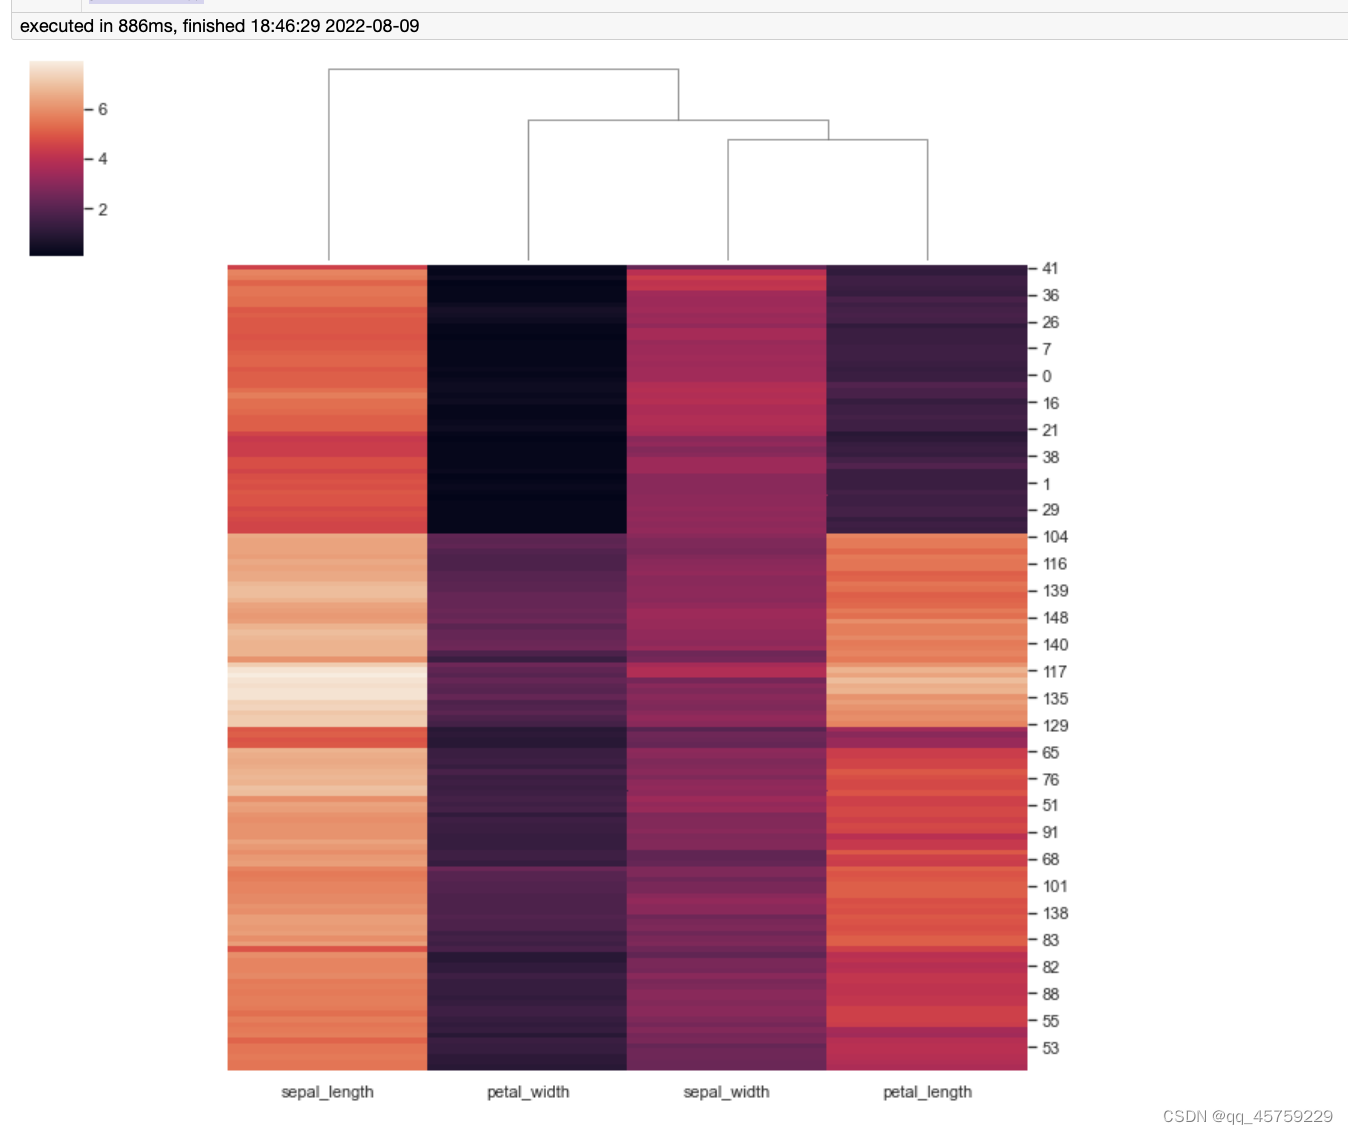
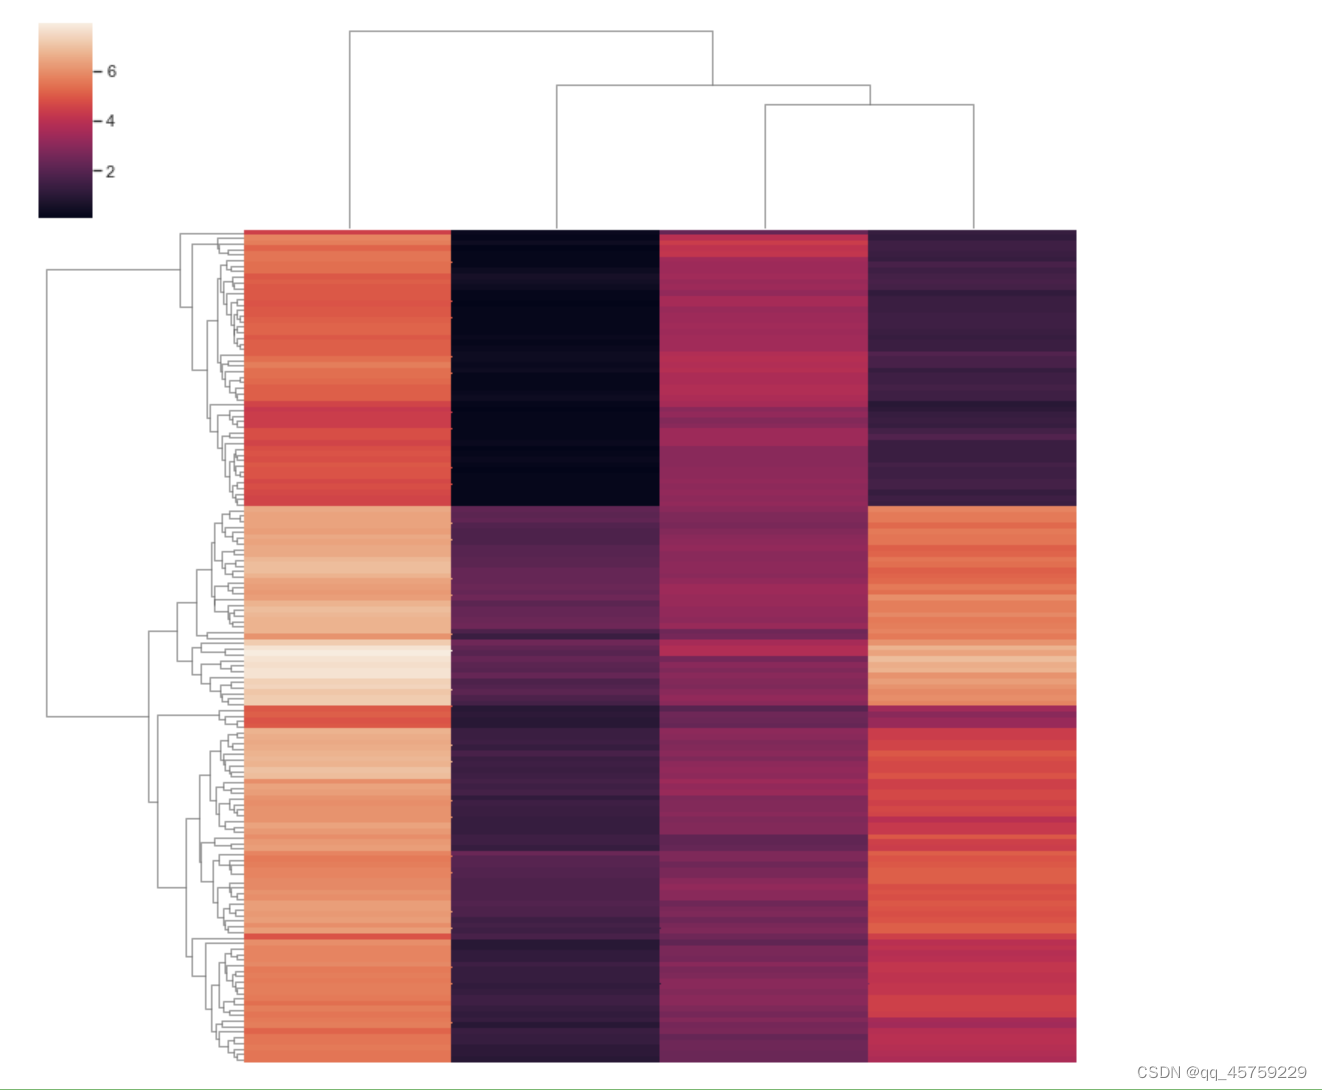
基础使用
import seaborn as sns; sns.set_theme(color_codes=True)
iris = sns.load_dataset("iris")
species = iris.pop("species")
g = sns.clustermap(iris)
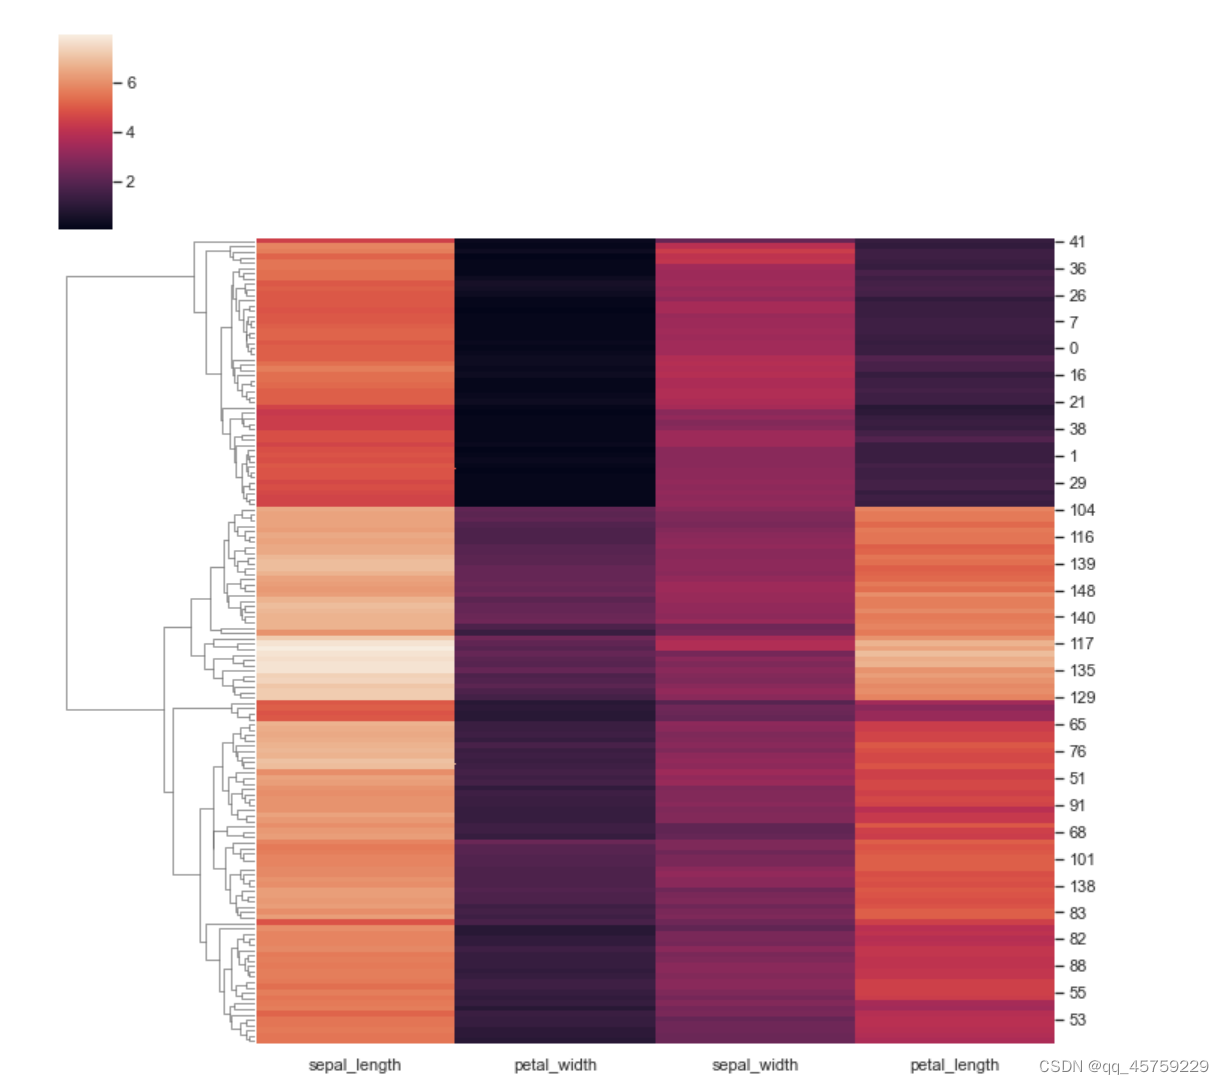
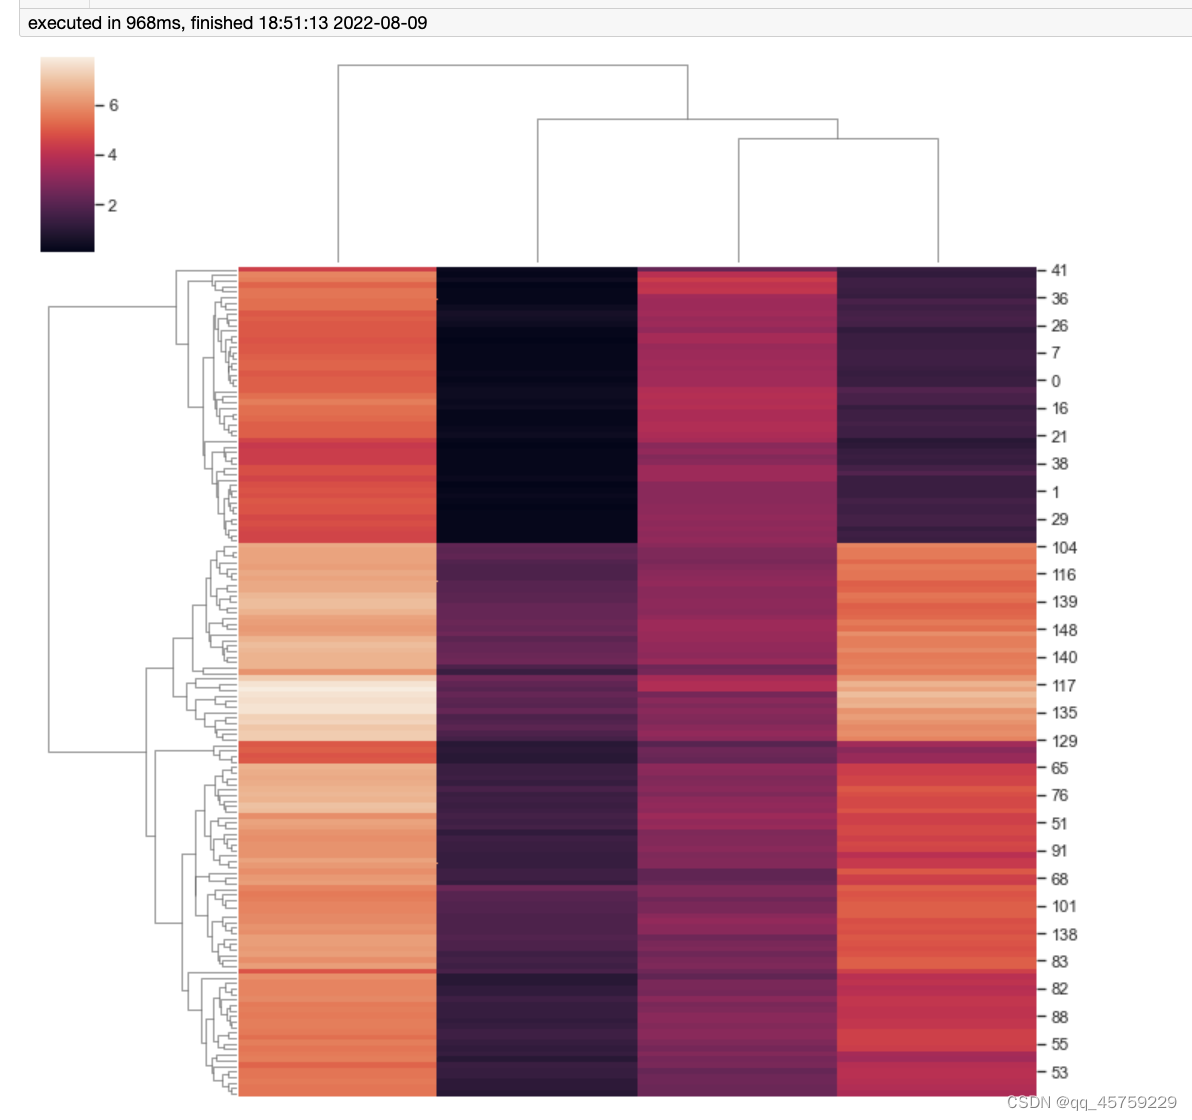
取消行列分类树
import seaborn as sns; sns.set_theme(color_codes=True)
import matplotlib.pyplot as plt
iris = sns.load_dataset("iris")
species = iris.pop("species")
g = sns.clustermap(iris)
g.ax_row_dendrogram.set_visible(False)
plt.show()## 取消color分类树g = sns.clustermap(iris)
g.ax_col_dendrogram.set_visible(False)
plt.show()
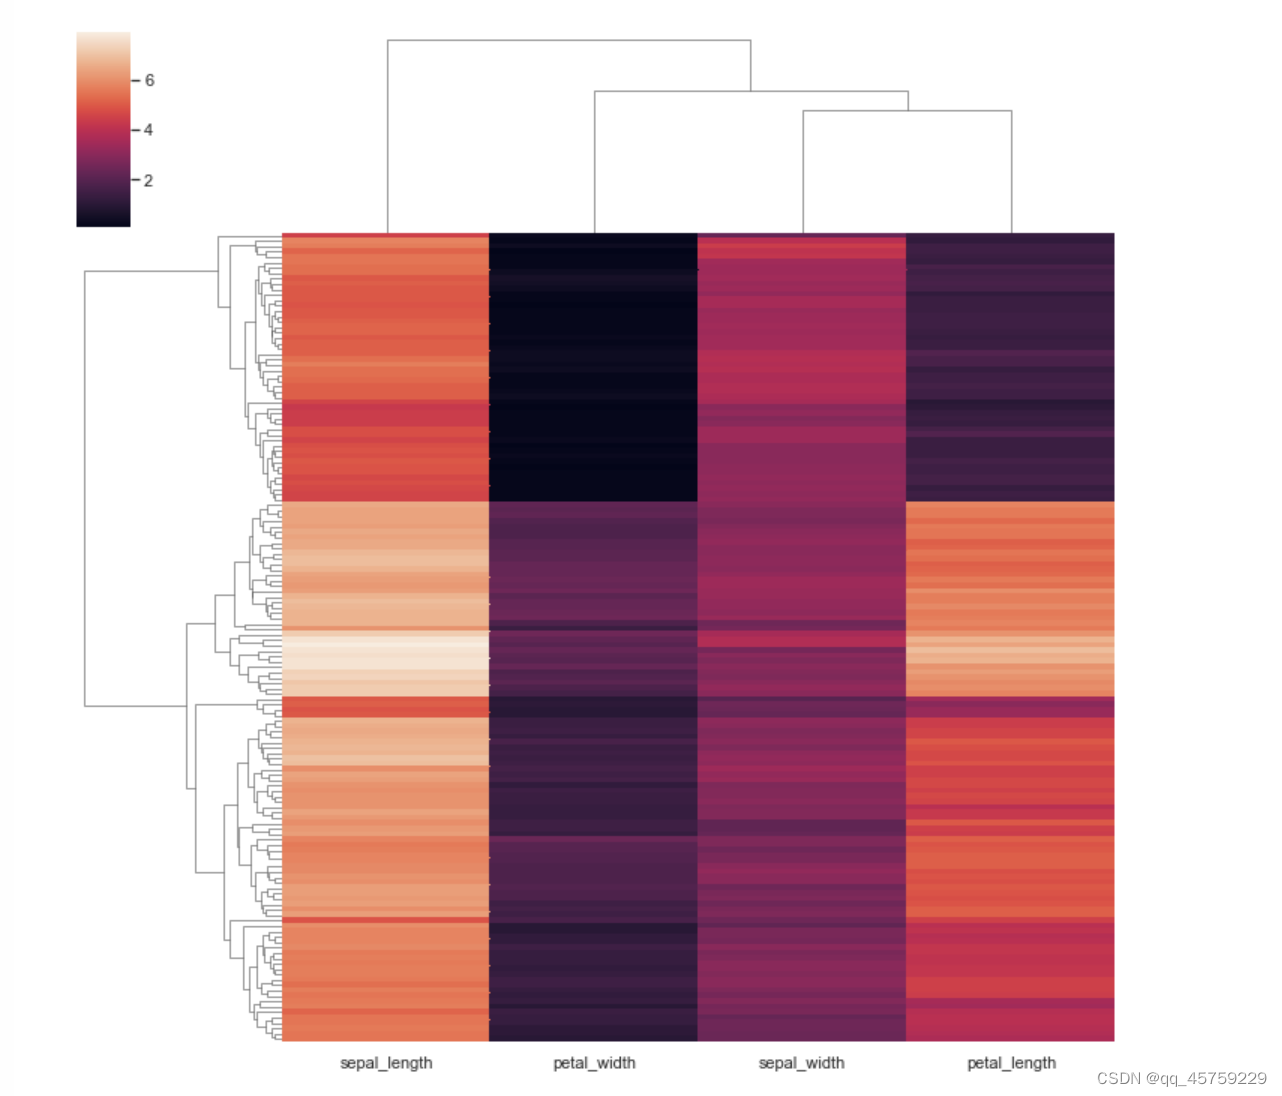
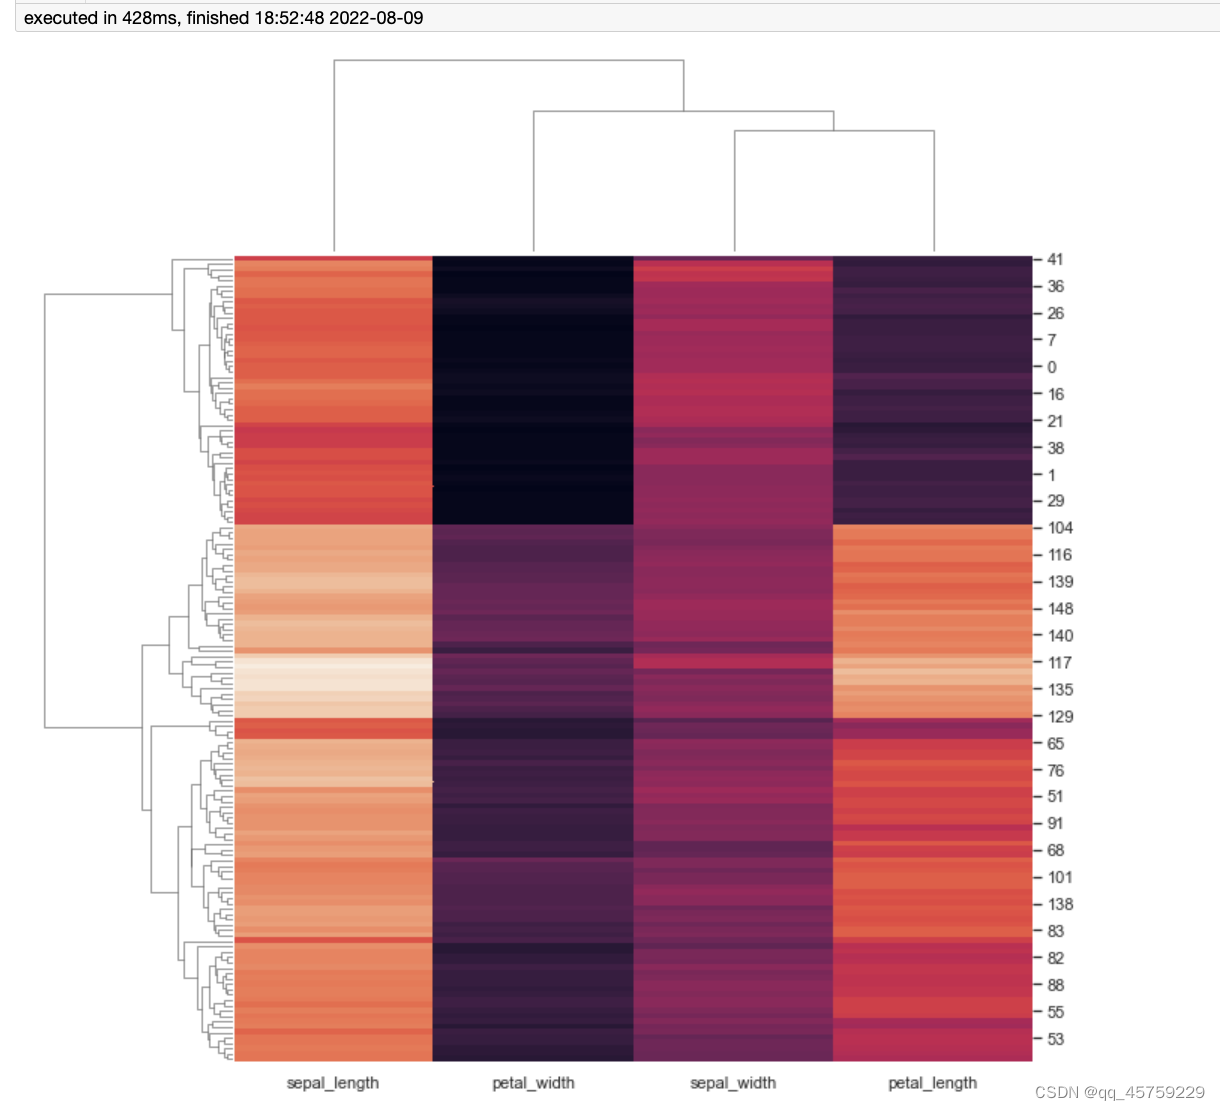
不显示矩阵横轴标签和纵轴标签
import seaborn as sns; sns.set_theme(color_codes=True)
iris = sns.load_dataset("iris")
species = iris.pop("species")
g = sns.clustermap(iris,xticklabels=False)
plt.show()g = sns.clustermap(iris,yticklabels=False)
plt.show()g = sns.clustermap(iris,xticklabels=False,yticklabels=False)
plt.show()
不显示colorbar的legend
import seaborn as sns; sns.set_theme(color_codes=True)
iris = sns.load_dataset("iris")
species = iris.pop("species")
g = sns.clustermap(iris)
g.cax.set_visible(False)
plt.show()
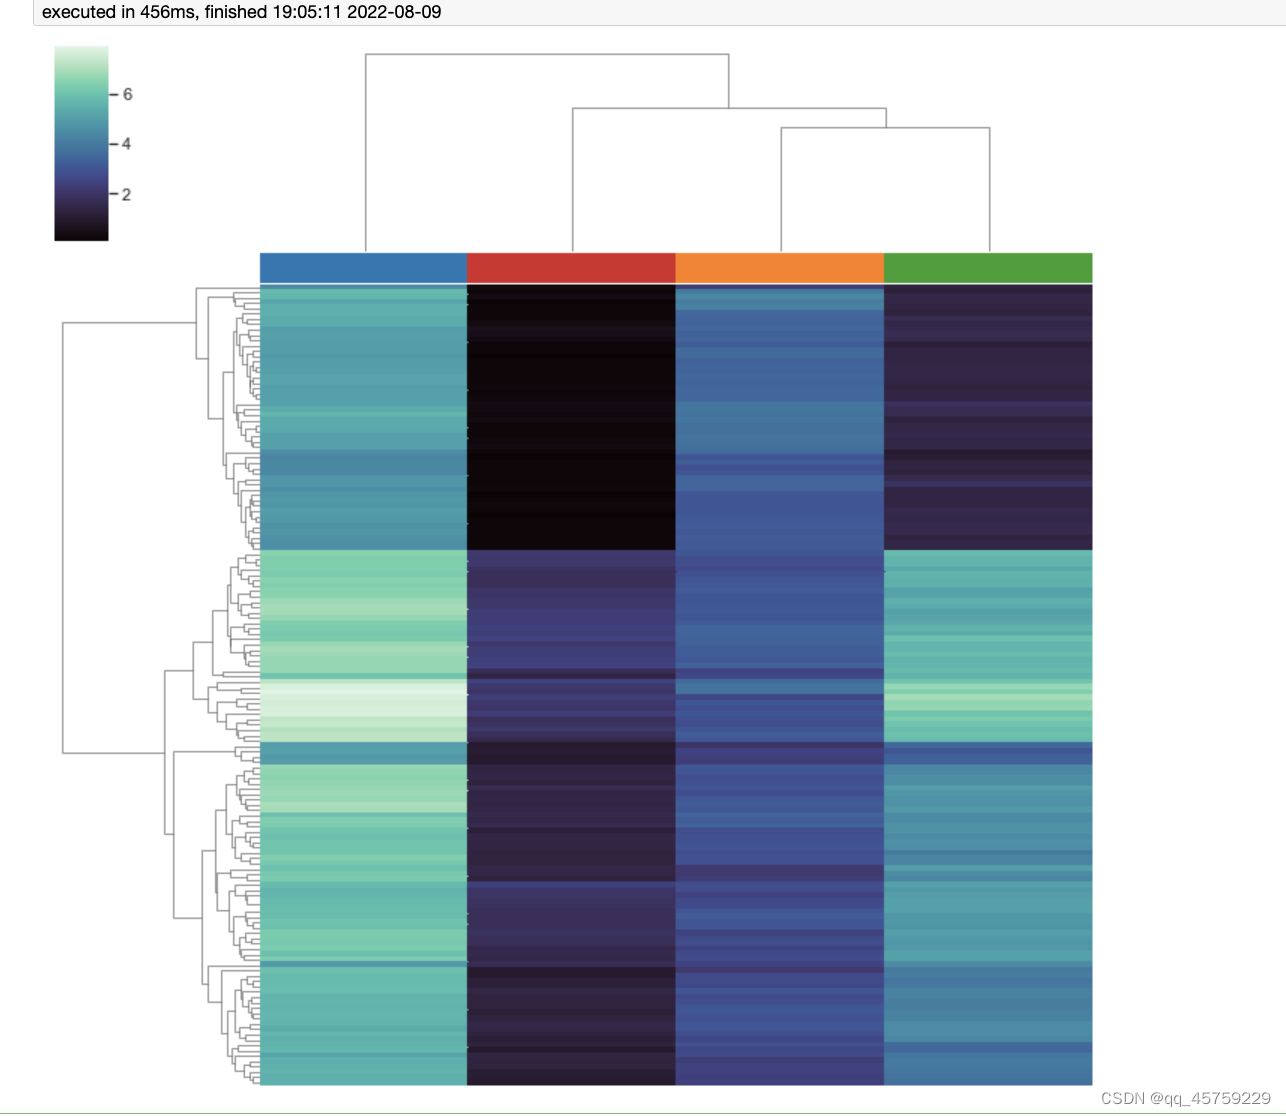
添加颜色的cluster块
import seaborn as sns; sns.set(color_codes=True)
import matplotlib.pyplot as plt
import pandas as pd
iris = sns.load_dataset("iris")
species = iris.pop("species")colors_use=['#1f77b4', '#ff7f0e', '#2ca02c', '#d62728', '#9467bd', '#8c564b', '#e377c2', '#bcbd22', '#17becf', '#aec7e8', '#ffbb78', '#98df8a', '#ff9896', '#bec1d4', '#bb7784', '#0000ff', '#111010', '#FFFF00',   '#1f77b4', '#800080', '#959595', '#7d87b9', '#bec1d4', '#d6bcc0', '#bb7784', '#8e063b', '#4a6fe3', '#8595e1', '#b5bbe3', '#e6afb9', '#e07b91', '#d33f6a', '#11c638', '#8dd593', '#c6dec7', '#ead3c6', '#f0b98d', '#ef9708', '#0fcfc0', '#9cded6', '#d5eae7', '#f3e1eb', '#f6c4e1', '#f79cd4']# 添加列
col_colors=colors_use[:4] #
g = sns.clustermap(iris, col_colors=col_colors,cmap="mako", yticklabels=False, xticklabels=False)
plt.show()
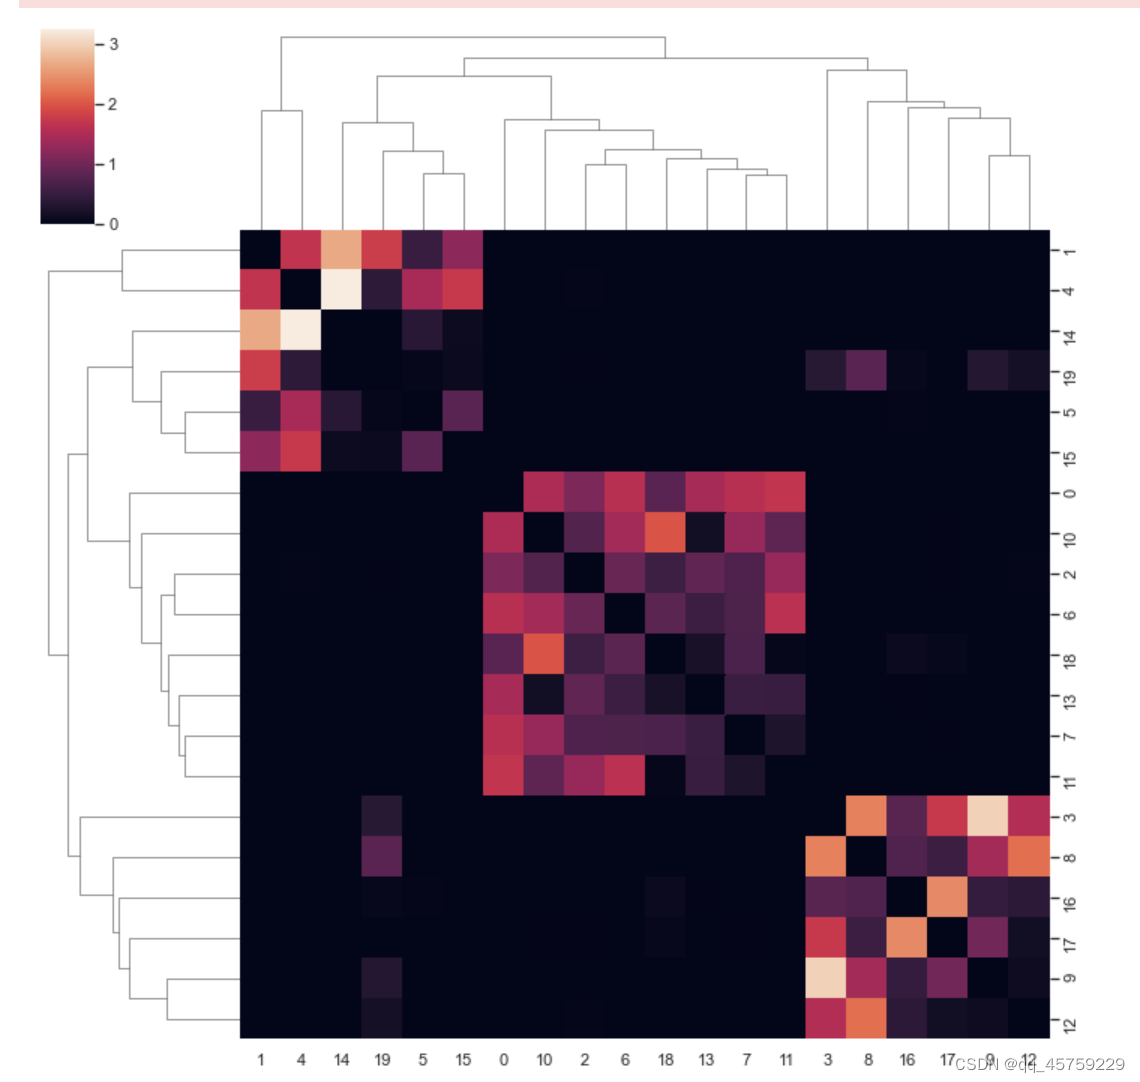
行列排序
import pandas as pd
import numpy as np
# read_file="/Users/xiaokangyu/Desktop/scDML_project/论文材料准备/heatmap_picture/cluster_link_conectivity.csv"
# df=pd.read_csv(read_file,index_col=0)
# df.to_csv("./test_sim.txt",index=None,sep=',',mode='w')#可以自己先写入这个以,分割的数据,然后自己添加]表示
# df
val=[[
0.0,0.0,1.105,0.0,0.0,0.0,1.587,1.591,0.0,0.002,1.494,1.686,0.0,1.452,0.0,0.0,0.0,0.0,0.812,0.0],
[0.0,0.0,0.004,0.0,1.67,0.515,0.0,0.0,0.0,0.009,0.0,0.0,0.0,0.0,2.657,1.228,0.0,0.0,0.0,1.786],
[1.105,0.004,0.0,0.0,0.031,0.003,0.938,0.708,0.009,0.009,0.74,1.312,0.033,0.874,0.008,0.0,0.0,0.02,0.576,0.024],
[0.0,0.0,0.0,0.0,0.0,0.0,0.0,0.0,2.342,2.991,0.0,0.0,1.542,0.0,0.0,0.0,0.8,1.735,0.0,0.357],
[0.0,1.67,0.031,0.0,0.0,1.456,0.0,0.0,0.002,0.002,0.0,0.0,0.003,0.0,3.234,1.738,0.0,0.0,0.0,0.405],
[0.0,0.515,0.003,0.0,1.456,0.0,0.0,0.0,0.0,0.002,0.0,0.0,0.0,0.0,0.367,0.82,0.035,0.0,0.007,0.048],
[1.587,0.0,0.938,0.0,0.0,0.0,0.0,0.704,0.0,0.0,1.424,1.618,0.0,0.545,0.0,0.0,0.0,0.0,0.826,0.0],
[1.591,0.0,0.708,0.0,0.0,0.0,0.704,0.0,0.0,0.004,1.313,0.266,0.0,0.535,0.0,0.0,0.0,0.02,0.688,0.0],
[0.0,0.0,0.009,2.342,0.002,0.0,0.0,0.0,0.0,1.425,0.007,0.0,2.196,0.003,0.0,0.0,0.729,0.558,0.0,0.81],
[0.002,0.009,0.009,2.991,0.002,0.002,0.0,0.004,1.425,0.0,0.0,0.002,0.127,0.003,0.0,0.0,0.476,1.014,0.0,0.333],
[1.494,0.0,0.74,0.0,0.0,0.0,1.424,1.313,0.007,0.0,0.0,0.855,0.0,0.159,0.0,0.0,0.0,0.014,1.986,0.0],
[1.686,0.0,1.312,0.0,0.0,0.0,1.618,0.266,0.0,0.002,0.855,0.0,0.0,0.525,0.0,0.0,0.0,0.0,0.049,0.0],
[0.0,0.0,0.033,1.542,0.003,0.0,0.0,0.0,2.196,0.127,0.0,0.0,0.0,0.003,0.0,0.0,0.4,0.163,0.0,0.19],
[1.452,0.0,0.874,0.0,0.0,0.0,0.545,0.535,0.003,0.003,0.159,0.525,0.003,0.0,0.0,0.0,0.024,0.007,0.215,0.0],
[0.0,2.657,0.008,0.0,3.234,0.367,0.0,0.0,0.0,0.0,0.0,0.0,0.0,0.0,0.0,0.112,0.0,0.0,0.0,0.0],
[0.0,1.228,0.0,0.0,1.738,0.82,0.0,0.0,0.0,0.0,0.0,0.0,0.0,0.0,0.112,0.0,0.0,0.0,0.0,0.095],
[0.0,0.0,0.0,0.8,0.0,0.035,0.0,0.0,0.729,0.476,0.0,0.0,0.4,0.024,0.0,0.0,0.0,2.401,0.09,0.071],
[0.0,0.0,0.02,1.735,0.0,0.0,0.0,0.02,0.558,1.014,0.014,0.0,0.163,0.007,0.0,0.0,2.401,0.0,0.069,0.0],
[0.812,0.0,0.576,0.0,0.0,0.007,0.826,0.688,0.0,0.0,1.986,0.049,0.0,0.215,0.0,0.0,0.09,0.069,0.0,0.0],
[0.0,1.786,0.024,0.357,0.405,0.048,0.0,0.0,0.81,0.333,0.0,0.0,0.19,0.0,0.0,0.095,0.071,0.0,0.0,0.0]
]
arr=np.array(val)
df=pd.DataFrame(data=arr)
#df
sns.clustermap(df)
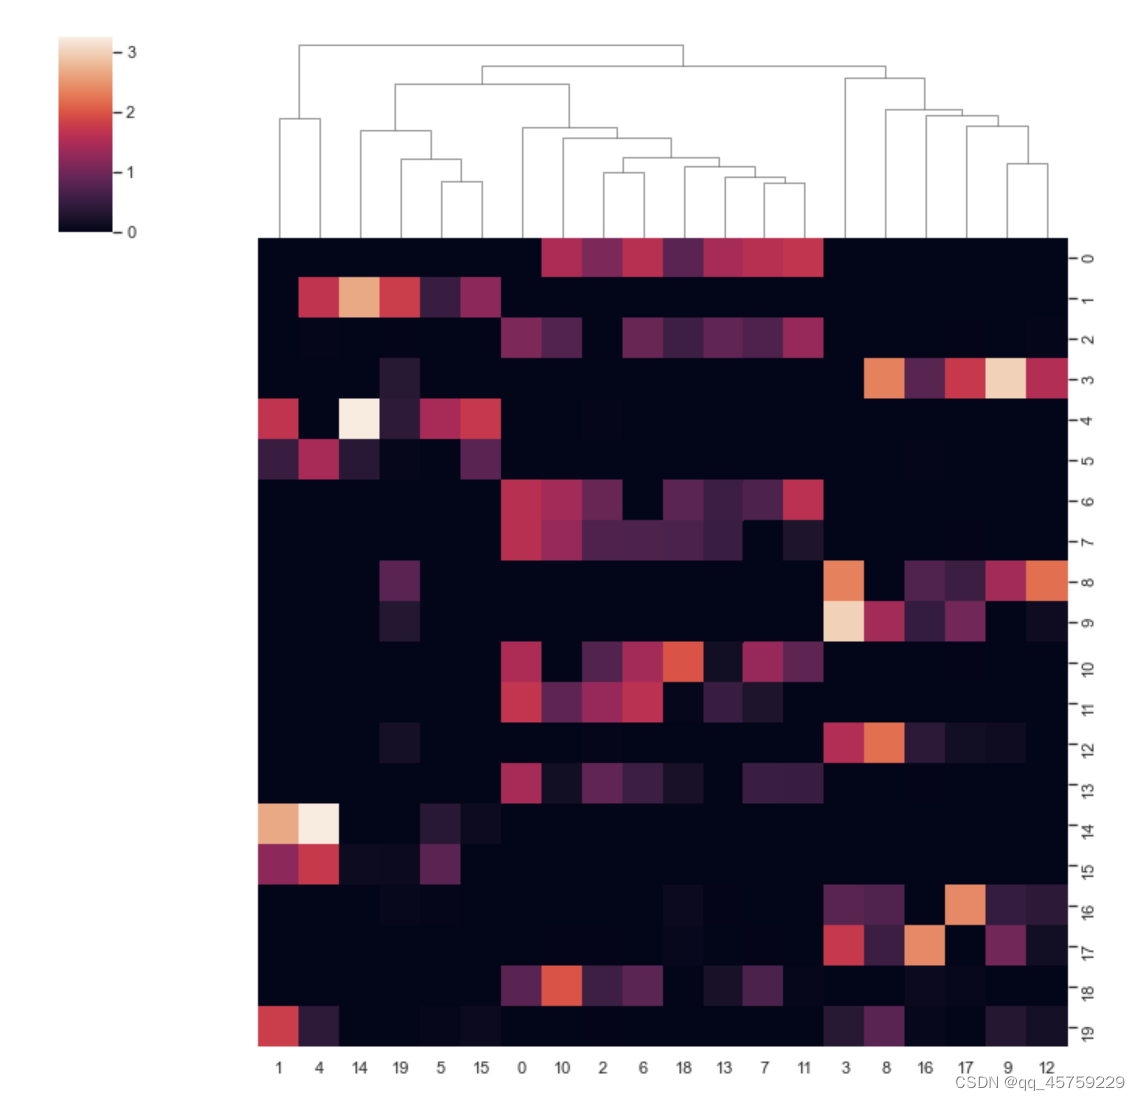
plt.show()sns.clustermap(df,row_cluster=False)# 不进行行聚类
plt.show()