BagNet地址:https://github.com/wielandbrendel/bag-of-local-features-models
BagNet是ResNet的变体,显著的区别是将3x3卷积变为1x1卷积来达到构造整体网络具有某个最终的感受野(receptive field)目的。在这里主要讲解对于一张来源于ImageNet的尺寸为224x224的原始图像,如何判断其局部的image patch的重要性大小,并可视化heatmap。
获取heatmap张量
1. 读取预训练的BagNet,并读取原始图像并转化为tensor。将图像tensor输入BagNet得到维度为224x224的2D heatmap。
import bagnets.pytorchnet
from bagnets.utils import plot_heatmap, generate_heatmap_pytorch
import torchvision.transforms as transforms
import numpy as np
import cv2
import torchpytorch_model = bagnets.pytorchnet.bagnet33(pretrained=True).cuda()
pytorch_model.eval()image_path = 'val.JPEG'
raw_image = cv2.imread(image_path)
raw_image = cv2.resize(raw_image, (224,) * 2)
image = transforms.Compose([transforms.ToTensor(),transforms.Normalize(mean=[0.485, 0.456, 0.406], std=[0.229, 0.224, 0.225]),])(raw_image[..., ::-1].copy()) # cv2库读取的为BGR通道,需将其变为RGB
image = torch.unsqueeze(image, 0) # 将单张图像维度由(3,224,224)变为(1,3,224,224)heatmap = generate_heatmap_pytorch(pytorch_model, image, 2, 33)
np.save('heatmap.npy', heatmap)  # 将heatmap张量保存用于之后可视化
generate_heatmap_pytorch函数的内容是根据(3,224,224)原始图像生成对应的2D (224,224)的heatmap,过程如下:
def generate_heatmap_pytorch(model, image, target, patchsize):"""Generates high-resolution heatmap for a BagNet by decomposing theimage into all possible patches and by computing the logits foreach patch.Parameters----------model : Pytorch ModelThis should be one of the BagNets.image : Numpy array of shape [1, 3, X, X]The image for which we want to compute the heatmap.target : intClass for which the heatmap is computed.patchsize : intThe size of the receptive field of the given BagNet."""import torchwith torch.no_grad():# 这里采用9x9的滑动框来生成image patches,为了保证输出尺寸为224x224# 需要pad 0_, c, x, y = image.shapepadded_image = np.zeros((c, x + patchsize - 1, y + patchsize - 1))padded_image[:, (patchsize-1)//2:(patchsize-1)//2 + x, (patchsize-1)//2:(patchsize-1)//2 + y] = image[0]image = padded_image[None].astype(np.float32)# turn to torch tensorinput = torch.from_numpy(image).cuda()# extract patchespatches = input.permute(0, 2, 3, 1)# 这个语句负责生成patches# patches:(1,224,224,3)# 设num_H==num_W=(224+2*paddings)/patchsize# patches.unfold(1, patchsize, 1):(1,num_H,224,3,patchsize)# patches.unfold(1, patchsize, 1).unfold(2, patchsize, 1):# (1,num_H,num_W,3,patchsize,patchsize)patches = patches.unfold(1, patchsize, 1).unfold(2, patchsize, 1)num_rows = patches.shape[1]num_cols = patches.shape[2]patches = patches.contiguous().view((-1, 3, patchsize, patchsize))# compute logits for each patchlogits_list = []for batch_patches in torch.split(patches, 1000):logits = model(batch_patches)logits = logits[:, target]logits_list.append(logits.data.cpu().numpy().copy())logits = np.hstack(logits_list)return logits.reshape((224, 224))
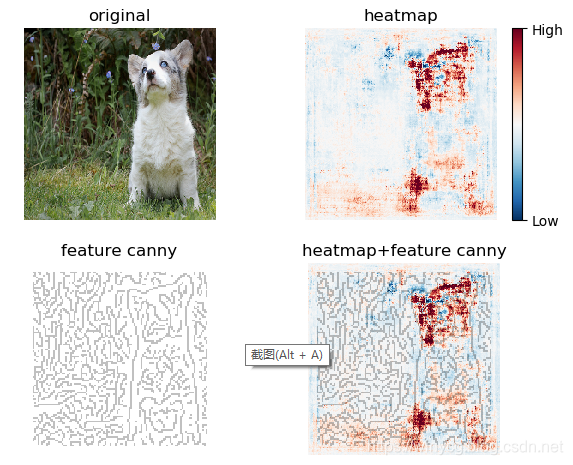
可视化heatmap
方法一: 这里采用bagnet的方法,将原图padding之后裁剪成224* 224个小片,然后依次进入网络得到 logits值,于是得到224*224个数,直接reshape就可以得到heatmap无需插值
import numpy as np
import matplotlib.pyplot as plt
from skimage import feature, transform
import cv2def plot_heatmap(heatmap, original, ax1, ax2, ax3, cmap='RdBu_r',percentile=99, dilation=0.5, alpha=0.25):"""Plots the heatmap on top of the original image(which is shown by most important edges).Parameters----------heatmap : Numpy Array of shape [X, X]Heatmap to visualise.original : Numpy array of shape [X, X, 3]Original image for which the heatmap was computed.ax : Matplotlib axisAxis onto which the heatmap should be plotted.cmap : Matplotlib color mapColor map for the visualisation of the heatmaps (default: RdBu_r)percentile : float between 0 and 100 (default: 99)Extreme values outside of the percentile range are clipped.This avoids that a single outlier dominates the whole heatmap.dilation : floatResizing of the original image. Influences the edge detector andthus the image overlay.alpha : float in [0, 1]Opacity of the overlay image."""dx, dy = 0.05, 0.05xx = np.arange(0.0, heatmap.shape[1], dx)yy = np.arange(0.0, heatmap.shape[0], dy)xmin, xmax, ymin, ymax = np.amin(xx), np.amax(xx), np.amin(yy), np.amax(yy)extent = xmin, xmax, ymin, ymaxcmap_original = plt.get_cmap('Greys_r')cmap_original.set_bad(alpha=0)# Compute edges (to overlay to heatmaps later)original_greyscale = original if len(original.shape) == 2 else np.mean(original, axis=-1)# dilation=0.5,图像由(224,224)缩放为(112,112),这样做的目的是找出更粗略的边缘纹理in_image_upscaled = transform.rescale(original_greyscale, dilation, mode='constant',multichannel=False, anti_aliasing=True)# 找到图像的边缘纹理特征edges = feature.canny(in_image_upscaled).astype(float)edges[edges < 0.5] = np.nanedges[:5, :] = np.nanedges[-5:, :] = np.nanedges[:, :5] = np.nanedges[:, -5:] = np.nanoverlay = edges  # 找出图像的边缘特征显示在heatmap上,便于对照原图特征# 最大值设为99%处,若设为真正的最大值,heatmap的重要处颜色不是特别深abs_max = np.percentile(np.abs(heatmap), percentile)abs_min = abs_maxa1 = ax1.imshow(heatmap, extent=extent, interpolation='nearest', cmap=cmap, vmin=-abs_min, vmax=abs_max)a2 = ax2.imshow(overlay,  extent=extent, interpolation='nearest', cmap=cmap_original, alpha=alpha)cb = fig.colorbar(a1, ax=ax1, ticks=[1, 2, 3])cb.set_ticks([-abs_min, abs_max])cb.set_ticklabels(['Low', 'High'])a3 = ax3.imshow(heatmap, extent=extent, interpolation='nearest', cmap=cmap, vmin=-abs_min, vmax=abs_max)ax3.imshow(overlay, extent=extent, interpolation='nearest', cmap=cmap_original, alpha=alpha)heatmap = np.load('heatmap.npy')
heatmap = cv2.resize(heatmap, (224, 224), interpolation=cv2.INTER_NEAREST)image_path = 'val.JPEG'
raw_image = cv2.imread(image_path)
original_image = cv2.resize(raw_image, (224, 224))fig, _axs = plt.subplots(nrows=2, ncols=2)
axs = _axs.flatten()axs[0].set_title('original')
# matplotlib的imshow的RGB 3通道表示与cv2库(BGR)的顺序不同
axs[0].imshow(original_image[..., ::-1] / 255.)
axs[0].axis('off')  # 不显示坐标尺寸axs[1].set_title('heatmap')
axs[1].axis('off')  # 不显示坐标尺寸axs[2].set_title('feature canny')
axs[2].axis('off')  # 不显示坐标尺寸axs[3].set_title('heatmap+feature canny')
axs[3].axis('off')  # 不显示坐标尺寸plot_heatmap(heatmap, original_image, axs[1], axs[2], axs[3], dilation=0.5, percentile=99, alpha=.25)fig.tight_layout()
plt.show()
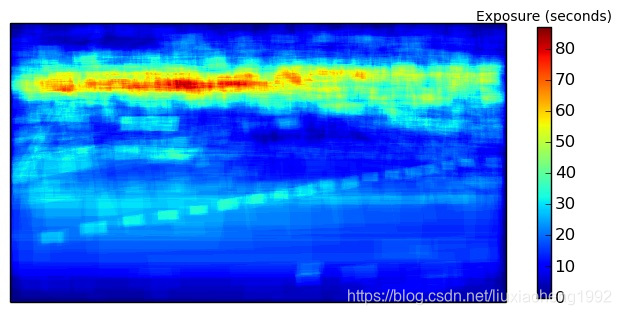
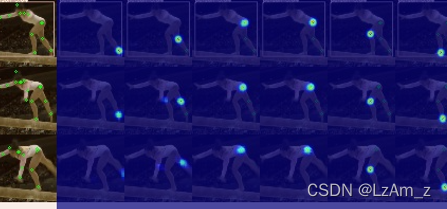
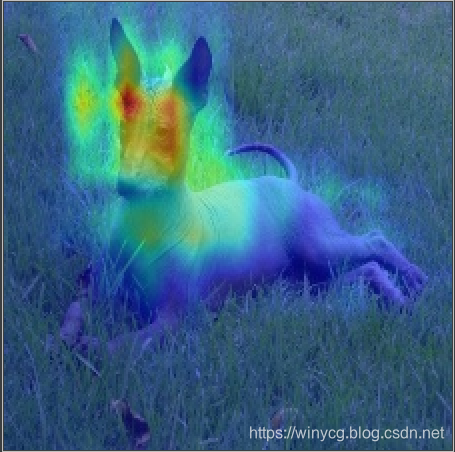
方法二: 将global average pooling前的3D 特征图根据FC层的权值进行加权(参加CAM方法),得到2D的特征图。由于此时的分辨率是小于224* 224的,此时一般需要进行插值来resize。以下给出一个2D特征图的npy文件,将其进行可视化。
python
import numpy as np
import matplotlib.pyplot as plt
import cv2
import matplotlib.cm as cm# 升采样map
map = cv2.resize(map, (224, 224))
image_path = 'val.JPEG'
raw_image = cv2.imread(image_path)
original_image = cv2.resize(raw_image, (224, 224))# 标准化到[0,1]
map = (map- map.min()) / (map.max()-map.min())
# 使用jet_r映射为RGB的heatmap
heatmap3 = cm.jet_r(map)[..., :3] * 255.0
# 与原图进行结合显示
gcam = (heatmap3.astype(np.float) + original_image.astype(np.float)) / 2
cv2.imwrite('heatmap.jpg', np.uint8(gcam))
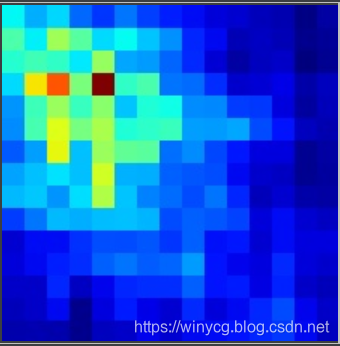
也可以通过Near插值来得到类似马赛克的heatmap:
map = cv2.resize(map, (224, 224), interpolation=cv2.INTER_NEAREST)
map = (map- map.min()) / (map.max()-map.min())
heatmap = cm.jet_r(map)[..., :3] * 255.0
cv2.imwrite('heatmap.jpg', np.uint8(heatmap ))
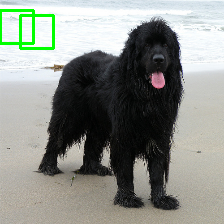
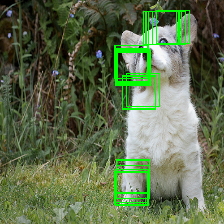
标注重点的image patch
根据生成的heatmap对应到原始图像的image patch,并使用矩形框标注,这里使用的是33x33的框规模:
import numpy as np
import cv2image_path = 'val.JPEG'
image = cv2.imread(image_path)
image = cv2.resize(image, (224,) * 2)heatmap = np.load('heatmap.npy')
maximum = 0
pos_list = []
# 选取>99.95位置的数才标注出对应的image patch
threshold = np.percentile(heatmap, 99.95)
for i in range(heatmap.shape[0]):for j in range(heatmap.shape[1]):if heatmap[i, j] > threshold:pos_list.append((i, j))padding = 33//2
for pos in pos_list:# 注意cv2库中的图像坐标和numpy数组中的不同pt1 = (pos[1] - padding , pos[0] - padding)pt2 = (pt1[0] + 33-1, pt1[1] + 33-1)# (0, 255, 0)表示RGB中的绿色,1表示框的宽度cv2.rectangle(image, pt1, pt2, (0, 255, 0), 1)
cv2.imshow('label', image)
cv2.waitKey() # 等待按键才退出
计算bbox的IOU
def IOU(bboxA, bboxB):x1 = bboxA[0]y1 = bboxA[1]width1 = bboxA[2] - bboxA[0]height1 = bboxA[3] - bboxA[1]x2 = bboxB[0]y2 = bboxB[1]width2 = bboxB[2] - bboxB[0]height2 = bboxB[3] - bboxB[1]endx = max(x1 + width1, x2 + width2)startx = min(x1, x2)width = width1 + width2 - (endx - startx)endy = max(y1 + height1, y2 + height2)starty = min(y1, y2)height = height1 + height2 - (endy - starty)if width <= 0 or height <= 0:ratio = 0  # 重叠率为 0else:Area = width * height  # 两矩形相交面积Area1 = width1 * height1Area2 = width2 * height2ratio = Area * 1. / (Area1 + Area2 - Area)return ratioimage_path = 'val.JPEG'
image = cv2.imread(image_path)
image = cv2.resize(image, (224,) * 2)
pt1 = (0, 10)
pt2 = (pt1[0] + 33, pt1[1] +33)pt3 = (20, 15)
pt4 = (pt3[0] + 33, pt3[1] + 33)
print(IOU(pt1+pt2, pt3+pt4))cv2.rectangle(image, pt1, pt2, (0, 255, 0), 2)
cv2.rectangle(image, pt3, pt4, (0, 255, 0), 2)
cv2.imshow('label', image)
cv2.waitKey() # 等待按键才退出