=================================================
=================================================
perf Examples

These are some examples of using the perf Linux profiler, which has also been called Performance Counters for Linux (PCL), Linux perf events (LPE), or perf_events. Like Vince Weaver, I'll call it perf_events so that you can search on that term later. Searching for just "perf" finds sites on the police, petroleum, weed control, and the T-shirt on the right (I have no idea what it means). This is not an official perf page, for either perf_events or the T-shirt.
perf_events is an event-oriented obseravbility tool, which can help you solve advanced performance and troubleshooting problems. It can instrument many thousands of different event types, covering kernel, processor, and application behavior.
The sort of questions that can be answered using perf_events include:
- Why is the kernel on-CPU so much? What code-paths are active?
- Which code-paths are causing CPU level 2 cache misses?
- Which code-paths are allocating memory, and how much?
- What is triggering TCP retransmits?
- What reasons are threads leaving the CPU?
- Is a certain kernel function being called, and how often? (eg, to confirm tuning is taking effect.)
perf_events is part of the Linux kernel, under tools/perf. While it uses many Linux tracing features, some are not yet exposed via the perf command, and need to be used via the ftrace interface instead. My perf-tools collection (github) uses both perf_events and ftrace as needed.
This page includes my examples of perf_events. The key sections are: One-Liners, Prerequisites, CPU statistics, CPU profiling, Static Tracing,Dynamic Tracing, Flame Graphs, and Heat Maps. Also see my Posts about perf_events, and Links for the main (official) perf_events page, awesome tutorial, and other links. The next sections introduce perf_events further, starting with a screenshot, one-liners, and then background.
This page is under construction, and there's a lot more to perf_events that I'd like to add. Hopefully this is useful so far.
Screenshot
I like explaining tools by starting with an actual screenshot showing something useful. Here's perf version 3.9.3 tracing disk I/O:
# perf record -e block:block_rq_issue -ag
^C
# ls -l perf.data
-rw------- 1 root root 3458162 Jan 26 03:03 perf.data
# perf report
[...]
# Samples: 2K of event 'block:block_rq_issue'
# Event count (approx.): 2216
#
# Overhead       Command      Shared Object                Symbol
# ........  ............  .................  ....................
#32.13%            dd  [kernel.kallsyms]  [k] blk_peek_request|--- blk_peek_requestvirtblk_request__blk_run_queue|          |--98.31%-- queue_unplugged|          blk_flush_plug_list|          |          |          |--91.00%-- blk_queue_bio|          |          generic_make_request|          |          submit_bio|          |          ext4_io_submit|          |          |          |          |          |--58.71%-- ext4_bio_write_page|          |          |          mpage_da_submit_io|          |          |          mpage_da_map_and_submit|          |          |          write_cache_pages_da|          |          |          ext4_da_writepages|          |          |          do_writepages|          |          |          __filemap_fdatawrite_range|          |          |          filemap_flush|          |          |          ext4_alloc_da_blocks|          |          |          ext4_release_file|          |          |          __fput|          |          |          ____fput|          |          |          task_work_run|          |          |          do_notify_resume|          |          |          int_signal|          |          |          close|          |          |          0x0|          |          |          |          |           --41.29%-- mpage_da_submit_io
[...]
A perf record command was used to trace the block:block_rq_issue probe, which fires when a block device I/O request is issued (disk I/O). Options included -a to trace all CPUs, and -g to capture call graphs (stack traces). Trace data is written to a perf.data file, and tracing ended when Ctrl-C was hit. A summary of the perf.data file was printed using perf report, which builds a tree from the stack traces, coalescing common paths, and showing percentages for each path.
The perf report output shows that 2,216 events were traced (disk I/O), 32% of which from a dd command. These were issued by the kernel function blk_peek_request(), and walking down the stacks, about half of these 32% were from the close() system call.
One-Liners
Some useful one-liners I've gathered or written:
Listing Events
# Listing all currently known events:
perf list# Listing sched tracepoints:
perf list 'sched:*'# Listing sched tracepoints (older syntax):
perf list -e 'sched:*'
Counting Events
# CPU counter statistics for the specified command:
perf stat command# Detailed CPU counter statistics (includes extras) for the specified command:
perf stat -d command# CPU counter statistics for the specified PID, until Ctrl-C:
perf stat -p PID# CPU counter statistics for the entire system, for 5 seconds:
perf stat -a sleep 5# Various basic CPU statistics, system wide, for 10 seconds:
perf stat -e cycles,instructions,cache-references,cache-misses,bus-cycles -a sleep 10# Various CPU level 1 data cache statistics for the specified command:
perf stat -e L1-dcache-loads,L1-dcache-load-misses,L1-dcache-stores command# Various CPU data TLB statistics for the specified command:
perf stat -e dTLB-loads,dTLB-load-misses,dTLB-prefetch-misses command# Various CPU last level cache statistics for the specified command:
perf stat -e LLC-loads,LLC-load-misses,LLC-stores,LLC-prefetches command# Count system calls for the specified PID, until Ctrl-C:
perf stat -e 'syscalls:sys_enter_*' -p PID# Count system calls for the entire system, for 5 seconds:
perf stat -e 'syscalls:sys_enter_*' -a sleep 5# Count scheduler events for the specified PID, until Ctrl-C:
perf stat -e 'sched:*' -p PID# Count scheduler events for the specified PID, for 10 seconds:
perf stat -e 'sched:*' -p PID sleep 10# Count ext4 events for the entire system, for 10 seconds:
perf stat -e 'ext4:*' -a sleep 10# Count block device I/O events for the entire system, for 10 seconds:
perf stat -e 'block:*' -a sleep 10# Show system calls by process, refreshing every 2 seconds:
perf top -e raw_syscalls:sys_enter -ns comm
Profiling
# Sample on-CPU functions for the specified command, at 99 Hertz:
perf record -F 99 command# Sample on-CPU functions for the specified PID, at 99 Hertz, until Ctrl-C:
perf record -F 99 -p PID# Sample on-CPU functions for the specified PID, at 99 Hertz, for 10 seconds:
perf record -F 99 -p PID sleep 10# Sample CPU stack traces for the specified PID, at 99 Hertz, for 10 seconds:
perf record -F 99 -p PID -g -- sleep 10# Sample CPU stack traces for the PID, using dwarf to unwind stacks, at 99 Hertz, for 10 seconds:
perf record -F 99 -p PID -g dwarf sleep 10# Sample CPU stack traces for the entire system, at 99 Hertz, for 10 seconds:
perf record -F 99 -ag -- sleep 10# Sample CPU stack traces for the entire system, with dwarf stacks, at 99 Hertz, for 10 seconds:
perf record -F 99 -ag dwarf sleep 10# Sample CPU stack traces, once every 10,000 Level 1 data cache misses, for 5 seconds:
perf record -e L1-dcache-load-misses -c 10000 -ag -- sleep 5# Sample CPU stack traces, once every 100 last level cache misses, for 5 seconds:
perf record -e LLC-load-misses -c 100 -ag -- sleep 5
Static Tracing
# Trace new processes, until Ctrl-C:
perf record -e sched:sched_process_exec -a# Trace all context-switches, until Ctrl-C:
perf record -e context-switches -a# Trace all context-switches with stack traces, until Ctrl-C:
perf record -e context-switches -ag# Trace all context-switches with stack traces, for 10 seconds:
perf record -e context-switches -ag -- sleep 10# Trace CPU migrations, for 10 seconds:
perf record -e migrations -a -- sleep 10# Trace all connect()s with stack traces (outbound connections), until Ctrl-C:
perf record -e syscalls:sys_enter_connect -ag# Trace all accepts()s with stack traces (inbound connections), until Ctrl-C:
perf record -e syscalls:sys_enter_accept* -ag# Trace all block device (disk I/O) requests with stack traces, until Ctrl-C:
perf record -e block:block_rq_issue -ag# Trace all block device issues and completions (has timestamps), until Ctrl-C:
perf record -e block:block_rq_issue -e block:block_rq_complete -a# Trace all block completions, of size at least 100 Kbytes, until Ctrl-C:
perf record -e block:block_rq_complete --filter 'nr_sector > 200'# Trace all block completions, synchronous writes only, until Ctrl-C:
perf record -e block:block_rq_complete --filter 'rwbs == "WS"'# Trace all block completions, all types of writes, until Ctrl-C:
perf record -e block:block_rq_complete --filter 'rwbs ~ "*W*"'# Trace all minor faults (RSS growth) with stack traces, until Ctrl-C:
perf record -e minor-faults -ag# Trace all page faults with stack traces, until Ctrl-C:
perf record -e page-faults -ag# Trace all ext4 calls, and write to a non-ext4 location, until Ctrl-C:
perf record -e 'ext4:*' -o /tmp/perf.data -a # Trace kswapd wakeup events, until Ctrl-C:
perf record -e vmscan:mm_vmscan_wakeup_kswapd -ag
Dynamic Tracing
# Add a tracepoint for the kernel tcp_sendmsg() function entry ("--add" is optional):
perf probe --add tcp_sendmsg# Remove the tcp_sendmsg() tracepoint (or use "--del"):
perf probe -d tcp_sendmsg# Add a tracepoint for the kernel tcp_sendmsg() function return:
perf probe 'tcp_sendmsg%return'# Show available variables for the kernel tcp_sendmsg() function (needs debuginfo):
perf probe -V tcp_sendmsg# Show available variables for the kernel tcp_sendmsg() function, plus external vars (needs debuginfo):
perf probe -V tcp_sendmsg --externs# Show available line probes for tcp_sendmsg() (needs debuginfo):
perf probe -L tcp_sendmsg# Show available variables for tcp_sendmsg() at line number 81 (needs debuginfo):
perf probe -V tcp_sendmsg:81# Add a tracepoint for tcp_sendmsg(), with three entry argument registers (platform specific):
perf probe 'tcp_sendmsg %ax %dx %cx'# Add a tracepoint for tcp_sendmsg(), with an alias ("bytes") for the %cx register (platform specific):
perf probe 'tcp_sendmsg bytes=%cx'# Trace previously created probe when the bytes (alias) variable is greater than 100:
perf record -e probe:tcp_sendmsg --filter 'bytes > 100'# Add a tracepoint for tcp_sendmsg() return, and capture the return value:
perf probe 'tcp_sendmsg%return $retval'# Add a tracepoint for tcp_sendmsg(), and "size" entry argument (reliable, but needs debuginfo):
perf probe 'tcp_sendmsg size'# Add a tracepoint for tcp_sendmsg(), with size and socket state (needs debuginfo):
perf probe 'tcp_sendmsg size sk->__sk_common.skc_state'# Tell me how on Earth you would do this, but don't actually do it (needs debuginfo):
perf probe -nv 'tcp_sendmsg size sk->__sk_common.skc_state'# Trace previous probe when size is non-zero, and state is not TCP_ESTABLISHED(1) (needs debuginfo):
perf record -e probe:tcp_sendmsg --filter 'size > 0 && skc_state != 1' -a# Add a tracepoint for tcp_sendmsg() line 81 with local variable seglen (needs debuginfo):
perf probe 'tcp_sendmsg:81 seglen'# Add a tracepoint for do_sys_open() with the filename as a string (needs debuginfo):
perf probe 'do_sys_open filename:string'# Add a tracepoint for myfunc() return, and include the retval as a string:
perf probe 'myfunc%return +0($retval):string'# Add a tracepoint for the user-level malloc() function from libc:
perf probe -x /lib64/libc.so.6 malloc# List currently available dynamic probes:
perf probe -l
Reporting
# Show perf.data in an ncurses browser (TUI) if possible:
perf report# Show perf.data with a column for sample count:
perf report -n# Show perf.data as a text report, with data coalesced and percentages:
perf report --stdio# List all raw events from perf.data:
perf script# List all raw events from perf.data, with customized fields:
perf script -f time,event,trace# Dump raw contents from perf.data as hex (for debugging):
perf script -D# Disassemble and annotate instructions with percentages (needs some debuginfo):
perf annotate --stdio
These one-liners serve to illustrate the capabilities of perf_events, and can also be used a bite-sized tutorial: learn perf_events one line at a time. You can also print these out as a perf_events cheatsheet.
Background
The following sections provide some background for understanding perf_events and how to use it. I'll describe the prerequisites, audience, usage, events, and tracepoints.
Prerequisites
The perf tool is in the linux-tools-common package. Start by adding that, then running "perf" to see if you get the USAGE message. It may tell you to install another related package (linux-tools-kernelversion).
You can also build and add perf from the Linux kernel source. See the Building section.
To get the most out perf, you'll want symbols and stack traces. These may work by default in your Linux distribution, or they may require the addition of packages, or recompilation of the kernel with additional config options.
Symbols
perf_events, like other debug tools, needs symbol information (symbols). These are used to translate memory addresses into function and variable names, so that they can be read by us humans. Without symbols, you'll see hexadecimal numbers representing the memory addresses profiled.
The following perf report output shows stack traces, however, only hexadecimal numbers can be seen:
57.14% sshd libc-2.15.so [.] connect |--- connect| |--25.00%-- 0x7ff3c1cddf29| |--25.00%-- 0x7ff3bfe82761| 0x7ff3bfe82b7c| |--25.00%-- 0x7ff3bfe82dfc--25.00%-- [...]
If the software was added by packages, you may find debug packages (often "-dbgsym") which provide the symbols. Sometimes perf report will tell you to install these, eg: "no symbols found in /bin/dd, maybe install a debug package?".
Here's the same perf report output seen earlier, after adding openssh-server-dbgsym and libc6-dbgsym (this is on ubuntu 12.04):
57.14% sshd libc-2.15.so [.] __GI___connect_internal|--- __GI___connect_internal| |--25.00%-- add_one_listen_addr.isra.0| |--25.00%-- __nscd_get_mapping| __nscd_get_map_ref| |--25.00%-- __nscd_open_socket--25.00%-- [...]
I find it useful to add both libc6-dbgsym and coreutils-dbgsym, to provide some symbol coverage of user-level OS codepaths.
Another way to get symbols is to compile the software yourself. For example, I just compiled node (Node.js):
# file node-v0.10.28/out/Release/node
node-v0.10.28/out/Release/node: ELF 64-bit LSB executable, ... not stripped
This has not been stripped, so I can profile node and see more than just hex. If the result is stripped, configure your build system not to run strip(1) on the output binaries.
Kernel-level symbols are in the kernel debuginfo package, or when the kernel is compiled with CONFIG_KALLSYMS.
JIT Symbols (Java, Node.js)
Programs that have virtual machines (VMs), like Java's JVM and node's v8, execute their own virtual processor, which has its own way of executing functions and managing stacks. If you profile these using perf_events, you'll see symbols for the VM engine, which have some use (eg, to identify if time is spent in GC), but you won't see the language-level context you might be expecting. Eg, you won't see Java classes and methods.
perf_events has JIT support to solve this, which requires the VM to maintain a /tmp/perf-PID.map file for symbol translation. Java can do this with perf-map-agent, and Node.js 0.11.13+ with --perf_basic_prof. See my blog post Node.js flame graphs on Linux for the steps.
Note that Java may not show full stacks to begin with, due to hotspot omitting the frame pointer (just like gcc). There is currently no option to disable this optimization (either in OpenJDK or Oracle JDK), meaning that profiling is basically broken. I've heard that the performance benefit for omitting the frame pointer in hotspot is negligible, meaning, we lose the incredibly useful ability to profile stack traces for no real gain. Hotspot, at least, need to provide us with an option to not omit the frame pointer. UPDATE: I patched hotspot myself to return the frame pointer, as a prototype and to see what it involved; see the Java flame graphs section, which links to the patch and includes an example resulting flame graph.
Stack Traces
Always compile with frame pointers. Omitting frame pointers is an evil compiler optimization that breaks debuggers, and sadly, is often the default. Without them, you may see incomplete stacks from perf_events, like seen in the earlier sshd symbols example. There are two ways to fix this: either using dwarf data to unwind the stack, or returning the frame pointers.
Dwarf
Since about the 3.9 kernel, perf_events has supported a workaround for missing frame pointers in user-level stacks: libunwind, which uses dwarf. This can be enabled using "-g dwarf".
Frame Pointers
The earlier sshd example was a default build of OpenSSH, which uses compiler optimizations (-O2), which in this case has omitted the frame pointer. Here's how it looks after recompiling OpenSSH with -fno-omit-frame-pointer:
100.00% sshd libc-2.15.so [.] __GI___connect_internal|--- __GI___connect_internal| |--30.00%-- add_one_listen_addr.isra.0| add_listen_addr| fill_default_server_options| main| __libc_start_main| |--20.00%-- __nscd_get_mapping| __nscd_get_map_ref| |--20.00%-- __nscd_open_socket--30.00%-- [...]
Now the ancestry from add_one_listen_addr() can be seen, down to main() and __libc_start_main().
The kernel can suffer the same problem. Here's an example CPU profile collected on an idle server, with stack traces (-g):
99.97% swapper [kernel.kallsyms] [k] default_idle|--- default_idle0.03% sshd [kernel.kallsyms] [k] iowrite16 |--- iowrite16__write_nocancel(nil)
The kernel stack traces are incomplete. Now a similar profile with CONFIG_FRAME_POINTER=y:
99.97% swapper [kernel.kallsyms] [k] default_idle|--- default_idlecpu_idle| |--87.50%-- start_secondary| --12.50%-- rest_initstart_kernelx86_64_start_reservationsx86_64_start_kernel0.03% sshd [kernel.kallsyms] [k] iowrite16|--- iowrite16vp_notifyvirtqueue_kickstart_xmitdev_hard_start_xmitsch_direct_xmitdev_queue_xmitip_finish_outputip_outputip_local_outip_queue_xmittcp_transmit_skbtcp_write_xmit__tcp_push_pending_framestcp_sendmsginet_sendmsgsock_aio_writedo_sync_writevfs_writesys_writesystem_call_fastpath__write_nocancel
Much better -- the entire path from the write() syscall (__write_nocancel) to iowrite16() can be seen.
Also see the Building section for other notes about building perf_events.
Audience
To use perf_events, you'll either:
- Develop your own commands
- Run example commands
Developing new invocations of perf_events requires the study of kernel and application code, which isn't for everyone. Many more people will use perf_events by running commands developed by other people, like the examples on this page. This can work out fine: your organization may only need one or two people who can develop perf_events commands or source them, and then share them for use by the entire operation and support groups.
Either way, you need to know the capabilities of perf_events so you know when to reach for it, whether that means searching for an example command or writing your own. One goal of the examples that follow is just to show you what can be done, to help you learn these capabilities. You should also browse examples on other sites (Links).
If you've never used perf_events before, you may want to test before production use (it has had kernel panic bugs in the past). My experience has been a good one (no panics).
Usage
perf_events provides a command line tool, perf, and subcommands for various profiling activities. This is a single interface for the different instrumentation frameworks that provide the various events.
The perf command alone will list the subcommands; here is perf version 3.9.3 (for the Linux 3.9.3 kernel):
# perfusage: perf [--version] [--help] COMMAND [ARGS]The most commonly used perf commands are:annotate Read perf.data (created by perf record) and display annotated codearchive Create archive with object files with build-ids found in perf.data filebench General framework for benchmark suitesbuildid-cache Manage build-id cache.buildid-list List the buildids in a perf.data filediff Read two perf.data files and display the differential profileevlist List the event names in a perf.data fileinject Filter to augment the events stream with additional informationkmem Tool to trace/measure kernel memory(slab) propertieskvm Tool to trace/measure kvm guest oslist List all symbolic event typeslock Analyze lock eventsrecord Run a command and record its profile into perf.datareport Read perf.data (created by perf record) and display the profilesched Tool to trace/measure scheduler properties (latencies)script Read perf.data (created by perf record) and display trace outputstat Run a command and gather performance counter statisticstest Runs sanity tests.timechart Tool to visualize total system behavior during a workloadtop System profiling tool.trace strace inspired toolprobe Define new dynamic tracepointsSee 'perf help COMMAND' for more information on a specific command.
Apart from separate help for each subcommand, there is also documentation in the kernel source under tools/perf/Documentation. Note that perfhas evolved, with different functionality added over time, and so its usage may not feel consistent as you switch between activities. It's best to think of it as a multi-tool.
perf_events can instrument in two ways (using the perf_events terminology):
- counting events in-kernel context, where a summary of counts is printed by perf. This mode does not generate a perf.data file.
- sampling events, which writes event data to a kernel buffer, which is read at a gentle asynchronous rate by the perf command to write to the perf.data file. This file is then read by the perf report or perf script commands.
Try starting by counting events using the perf stat command, to see if this is sufficient. This subcommand costs the least overhead.
When using the sampling mode with perf record, you'll need to be a little careful about the overheads, as the capture files can quickly become hundreds of Mbytes. It depends on the rate of the event you are tracing: the more frequent, the higher the overhead and larger the perf.data size.
Usage Examples
These example sequences have been chosen to illustrate some different ways that perf is used, from gathering to reporting.
Performance counter summaries, including IPC, for the gzip command:
# perf stat gzip largefile
Count all scheduler process events for 5 seconds, and count by tracepoint:
# perf stat -e 'sched:sched_process_*' -a sleep 5
Trace all scheduler process events for 5 seconds, and count by both tracepoint and process name:
# perf record -e 'sched:sched_process_*' -a sleep 5
# perf report
Trace all scheduler process events for 5 seconds, and dump per-event details:
# perf record -e 'sched:sched_process_*' -a sleep 5
# perf script
Trace read() syscalls, when requested bytes is less than 10:
# perf record -e 'syscalls:sys_enter_read' --filter 'count < 10' -a
Sample CPU stacks at 99 Hertz, for 5 seconds:
# perf record -F 99 -ag -- sleep 5
# perf report
Dynamically instrument the kernel tcp_sendmsg() function, and trace it for 5 seconds, with stack traces:
# perf probe --add tcp_sendmsg
# perf record -e probe:tcp_sendmsg -ag -- sleep 5
# perf probe --del tcp_sendmsg
# perf report
Deleting the tracepoint (--del) wasn't necessary; I included it to show how to return the system to its original state.
Events
perf_events instruments "events", which are a unified interface for different kernel instrumentation frameworks. The types of events are:
- Hardware Events: These instrument low-level processor activity based on CPU performance counters. For example, CPU cycles, instructions retired, memory stall cycles, level 2 cache misses, etc. Some will be listed as Hardware Cache Events.
- Software Events: These are low level events based on kernel counters. For example, CPU migrations, minor faults, major faults, etc.
- Tracepoint Events: This are kernel-level events based on the ftrace framework. These tracepoints are placed in interesting and logical locations of the kernel, so that higher-level behavior can be easily traced. For example, system calls, TCP events, file system I/O, disk I/O, etc. These are grouped into libraries of tracepoints; eg, "sock:" for socket events, "sched:" for CPU scheduler events.
Details about the events can be collected, including timestamps, the code path that led to it, and other specific details. The capabilities of perf_events are enormous, and you're likely to only ever use a fraction.
Apart from those categories of events, there are two other ways perf_events can instrument the system:
- Profiling: Snapshots can be collected at an arbitrary frequency, using perf record -FHz. This is commonly used for CPU usage profiling.
- Dynamic Tracing: Software can be dynamically instrumented, creating events in any location. For kernel software, this uses the kprobes framework. For user-level software, uprobes.
The difference between tracepoints and dynamic tracing is shown in the following figure, which illustrates the coverage of common tracepoint libraries:
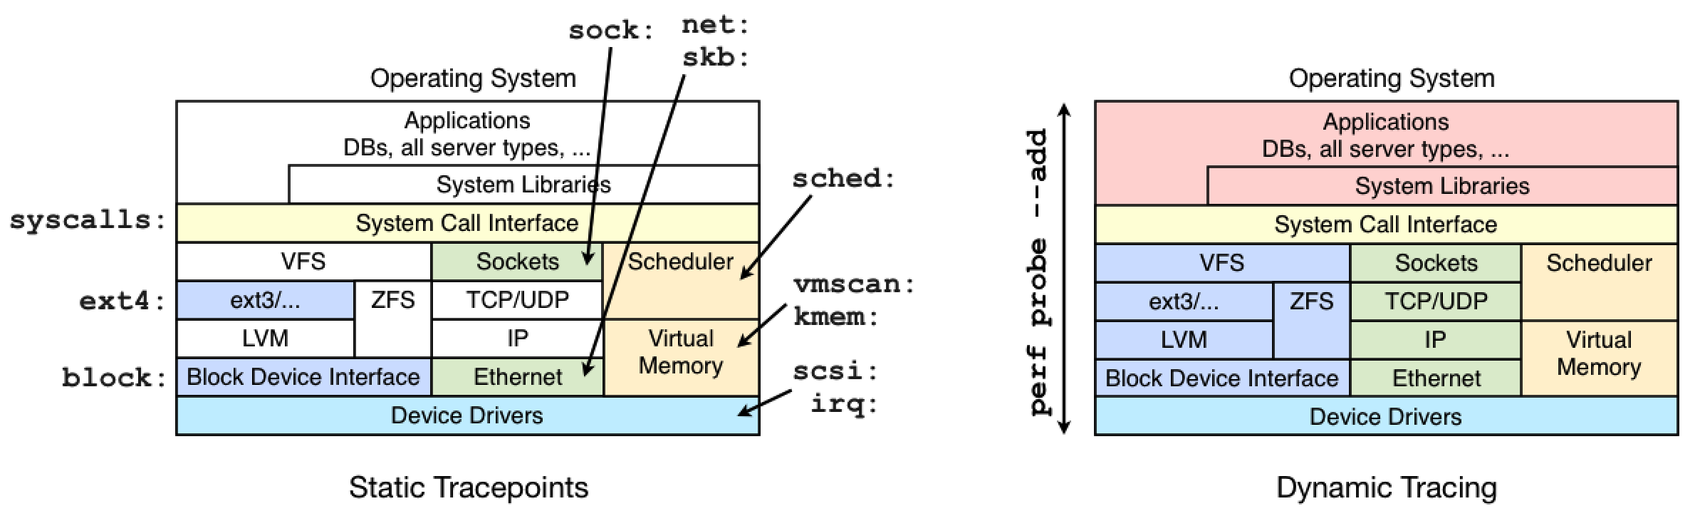
While dynamic tracing can see everything, it's also an unstable interface since it is instrumenting raw code. That means that any dynamic tracing tools you develop may break after a kernel patch or update. Try to use the static tracepoints first, since their interface should be much more stable. They can also be easier to use and understand, since they have been designed with a tracing end-user in mind.
Listing Events
Currently available events can be listed using the list subcommand:
# perf listList of pre-defined events (to be used in -e):cpu-cycles OR cycles                               [Hardware event]instructions                                       [Hardware event]cache-references                                   [Hardware event]cache-misses                                       [Hardware event]branch-instructions OR branches                    [Hardware event]branch-misses                                      [Hardware event]bus-cycles                                         [Hardware event]stalled-cycles-frontend OR idle-cycles-frontend    [Hardware event]stalled-cycles-backend OR idle-cycles-backend      [Hardware event]ref-cycles                                         [Hardware event]cpu-clock                                          [Software event]task-clock                                         [Software event]page-faults OR faults                              [Software event]context-switches OR cs                             [Software event]cpu-migrations OR migrations                       [Software event]minor-faults                                       [Software event]major-faults                                       [Software event]alignment-faults                                   [Software event]emulation-faults                                   [Software event]L1-dcache-loads                                    [Hardware cache event]L1-dcache-load-misses                              [Hardware cache event]L1-dcache-stores                                   [Hardware cache event]L1-dcache-store-misses                             [Hardware cache event]L1-dcache-prefetches                               [Hardware cache event]L1-dcache-prefetch-misses                          [Hardware cache event]
[...]rNNN                                               [Raw hardware event descriptor]cpu/t1=v1[,t2=v2,t3 ...]/modifier                  [Raw hardware event descriptor](see 'man perf-list' on how to encode it)mem:<addr>[:access]                                [Hardware breakpoint]probe:tcp_sendmsg                                  [Tracepoint event]
[...]sched:sched_process_exec                           [Tracepoint event]sched:sched_process_fork                           [Tracepoint event]sched:sched_process_wait                           [Tracepoint event]sched:sched_wait_task                              [Tracepoint event]sched:sched_process_exit                           [Tracepoint event]sched:sched_process_free                           [Tracepoint event]sched:sched_migrate_task                           [Tracepoint event]sched:sched_switch                                 [Tracepoint event]
[...]
# perf list | wc -l657
When you use dynamic tracing, you are extending this list. The probe:tcp_sendmsg tracepoint in this list is an example, which I added by instrumenting tcp_sendmsg(). Profiling (sampling) events are not listed.
Tracepoints
Summarizing the tracepoint library names and numbers of tracepoints, on my system:
# perf list | awk -F: '/Tracepoint event/ { lib[$1]++ } END {for (l in lib) { printf " %-16s %d\n", l, lib[l] } }' | sort | columnblock 19 module 5 skb 3compaction 3 napi 1 sock 2ext3 38 net 4 sunrpc 8ext4 87 oom 1 syscalls 552ftrace 1 power 9 task 2irq 5 printk 1 timer 12jbd 10 probe 1 udp 1jbd2 15 random 6 vmscan 15kmem 12 raw_syscalls 2 vsyscall 1kvm 41 rcu 1 workqueue 4kvmmmu 12 sched 18 writeback 30mce 1 scsi 5migrate 1 signal 2
These include:
- block: block device I/O
- ext3, ext4: file system operations
- kmem: kernel memory allocation events
- random: kernel random number generator events
- sched: CPU scheduler events
- syscalls: system call enter and exits
- task: task events
It's worth checking the list of tracepoints after every kernel upgrade, to see if any are new. The value of adding them has been debated from time to time, with it wondered if anyone will use them (I will!). There is a balance to aim for: I'd include the smallest number of probes that sufficiently covers common needs, and anything unusual or uncommon can be left to dynamic tracing.
Examples
These are some examples of perf_events, collected from a variety of 3.x Linux systems.
CPU Statistics
perf_events began life as a tool for instrumenting the processor's performance monitoring unit (PMU) hardware counters, also called performance instrumentation counters (PICs). The perf stat command instruments and summarizes key counters. This is from perf version 3.5.7.2:
# perf stat gzip file1Performance counter stats for 'gzip file1':1920.159821 task-clock # 0.991 CPUs utilized 13 context-switches # 0.007 K/sec 0 CPU-migrations # 0.000 K/sec 258 page-faults # 0.134 K/sec 5,649,595,479 cycles # 2.942 GHz [83.43%]1,808,339,931 stalled-cycles-frontend # 32.01% frontend cycles idle [83.54%]1,171,884,577 stalled-cycles-backend # 20.74% backend cycles idle [66.77%]8,625,207,199 instructions # 1.53 insns per cycle # 0.21 stalled cycles per insn [83.51%]1,488,797,176 branches # 775.351 M/sec [82.58%]53,395,139 branch-misses # 3.59% of all branches [83.78%]1.936842598 seconds time elapsed
This includes instructions per cycle (IPC), labled "insns per cycle", or in earlier versions, "IPC". This is a commonly examined metric, either IPC or its invert, CPI. Higher IPC values mean higher instruction throughput, and lower values indicate more stall cycles. I'd generally interpret high IPC values (eg, over 1.0) as good, indicating optimal processing of work. However, I'd want to double check what the instructions are, in case this is due to a spin loop: a high rate of instructions, but a low rate of actual work completed.
There are some advanced metrics now included in perf stat: frontend cycles idle, backend cycles idle, and stalled cycles per insn. To really understand these, you'll need some knowledge of CPU microarchitecture.
CPU Microarchitecture
The frontend and backend metrics refer to the CPU pipeline, and are also based on stall counts. The frontend processes CPU instructions, in order. It involves instruction fetch, along with branch prediction, and decode. The decoded instructions become micro-operations (uops) which the backend processes, and it may do so out of order. For a longer summery of these components, see Shannon Cepeda's great posts on frontend andbackend.
The backend can also process multiple uops in parallel; for modern processors, three or four. Along with pipelining, this is how IPC can become greater than one, as more than one instruction can be completed ("retired") per CPU cycle.
Stalled cycles per instruction is similar to IPC (inverted), however, only counting stalled cycles, which will be for memory or resource bus access. This makes it easy to interpret: stalls are latency, reduce stalls. I really like it as a metric, and hope it becomes as commonplace as IPC/CPI. Lets call it SCPI.
Detailed Mode
There is a "detailed" mode for perf stat:
# perf stat -d gzip file1Performance counter stats for 'gzip file1':1610.719530 task-clock # 0.998 CPUs utilized 20 context-switches # 0.012 K/sec 0 CPU-migrations # 0.000 K/sec 258 page-faults # 0.160 K/sec 5,491,605,997 cycles # 3.409 GHz [40.18%]1,654,551,151 stalled-cycles-frontend # 30.13% frontend cycles idle [40.80%]1,025,280,350 stalled-cycles-backend # 18.67% backend cycles idle [40.34%]8,644,643,951 instructions # 1.57 insns per cycle # 0.19 stalled cycles per insn [50.89%]1,492,911,665 branches # 926.860 M/sec [50.69%]53,471,580 branch-misses # 3.58% of all branches [51.21%]1,938,889,736 L1-dcache-loads # 1203.741 M/sec [49.68%]154,380,395 L1-dcache-load-misses # 7.96% of all L1-dcache hits [49.66%]0 LLC-loads # 0.000 K/sec [39.27%]0 LLC-load-misses # 0.00% of all LL-cache hits [39.61%]1.614165346 seconds time elapsed
This includes additional counters for Level 1 data cache events, and last level cache (LLC) events.
Specific Counters
Hardware cache event counters, seen in perf list, can be instrumented. Eg:
# perf list | grep L1-dcacheL1-dcache-loads                                    [Hardware cache event]L1-dcache-load-misses                              [Hardware cache event]L1-dcache-stores                                   [Hardware cache event]L1-dcache-store-misses                             [Hardware cache event]L1-dcache-prefetches                               [Hardware cache event]L1-dcache-prefetch-misses                          [Hardware cache event]
# perf stat -e L1-dcache-loads,L1-dcache-load-misses,L1-dcache-stores gzip file1Performance counter stats for 'gzip file1':1,947,551,657 L1-dcache-loads153,829,652 L1-dcache-misses#    7.90% of all L1-dcache hits  1,171,475,286 L1-dcache-stores1.538038091 seconds time elapsed
The percentage printed is a convenient calculation that perf_events has included, based on the counters I specified. If you include the "cycles" and "instructions" counters, it will include an IPC calculation in the output.
These hardware events that can be measured are often specific to the processor model. Many may not be available from within a virtualized environment.
Raw Counters
The Intel 64 and IA-32 Architectures Software Developer's Manual Volume 3B: System Programming Guide, Part 2 and the BIOS and Kernel Developer's Guide (BKDG) For AMD Family 10h Processors are full of interesting counters, but most cannot be found in perf list. If you find one you want to instrument, you can specify it as a raw event with the format: rUUEE, where UU == umask, and EE == event number. Here's an example where I've added a couple of raw counters:
# perf stat -e cycles,instructions,r80a2,r2b1 gzip file1Performance counter stats for 'gzip file1':5,586,963,328 cycles # 0.000 GHz 8,608,237,932 instructions # 1.54 insns per cycle 9,448,159 raw 0x80a2 11,855,777,803 raw 0x2b1 1.588618969 seconds time elapsed
If I did this right, then r80a2 has instrumented RESOURCE_STALLS.OTHER, and r2b1 has instrumented UOPS_DISPATCHED.CORE: the number of uops dispatched each cycle. It's easy to mess this up, and you'll want to double check that you are on the right page of the manual for your processor.
If you do find an awesome raw counter, please suggest it be added as an alias in perf_events, so we all can find it in perf list.
Other Options
The perf subcommands, especially perf stat, have an extensive option set which can be listed using "-h". I've included the full output for perf stathere from version 3.9.3, not as a reference, but as an illustration of the interface:
# perf stat -husage: perf stat [<options>] [<command>]-e, --event <event> event selector. use 'perf list' to list available events--filter <filter>event filter-i, --no-inherit child tasks do not inherit counters-p, --pid <pid> stat events on existing process id-t, --tid <tid> stat events on existing thread id-a, --all-cpus system-wide collection from all CPUs-g, --group put the counters into a counter group-c, --scale scale/normalize counters-v, --verbose be more verbose (show counter open errors, etc)-r, --repeat <n> repeat command and print average + stddev (max: 100)-n, --null null run - dont start any counters-d, --detailed detailed run - start a lot of events-S, --sync call sync() before starting a run-B, --big-num print large numbers with thousands' separators-C, --cpu <cpu> list of cpus to monitor in system-wide-A, --no-aggr disable CPU count aggregation-x, --field-separator <separator>print counts with custom separator-G, --cgroup <name> monitor event in cgroup name only-o, --output <file> output file name--append append to the output file--log-fd <n> log output to fd, instead of stderr--pre <command> command to run prior to the measured command--post <command> command to run after to the measured command-I, --interval-print <n>print counts at regular interval in ms (>= 100)--aggr-socket aggregate counts per processor socket
Options such as --repeat, --sync, --pre, and --post can be quite useful when doing automated testing or micro-benchmarking.
CPU Profiling
perf_events can profile CPU usage based on sampling at a fixed interval. It can also instrument CPU hardware counters, and profile based on cache misses, memory stall cycles, and other low-level processor events.
Sampling
Sampling CPU stacks at 99 Hertz (-F 99), for the entire system (-a, for all CPUs), with stack traces (-g, for call graphs), for 10 seconds:
# perf record -F 99 -a -g -- sleep 30
[ perf record: Woken up 9 times to write data ]
[ perf record: Captured and wrote 3.135 MB perf.data (~136971 samples) ]
# ls -lh perf.data
-rw------- 1 root root 3.2M Jan 26 07:26 perf.data
The choice of 99 Hertz, instead of 100 Hertz, is to avoid accidentally sampling in lockstep with some periodic activity, which would produce skewed results. This is also coarse: you may want to increase that to higher rates (eg, up to 997 Hertz) for finer resolution, especially if you are sampling short bursts of activity and you'd still like enough resolution to be useful. Bear in mind that higher frequencies means higher overhead.
The perf.data file can be processed in a variety of ways. On recent versions, the perf report command launches an ncurses navigator for call graph inspection. Older versions of perf (or if use --stdio in the new version) print the call graph as a tree, annotated with percentages:
# perf report --stdio
# ========
# captured on: Mon Jan 26 07:26:40 2014
# hostname : dev2
# os release : 3.8.6-ubuntu-12-opt
# perf version : 3.8.6
# arch : x86_64
# nrcpus online : 8
# nrcpus avail : 8
# cpudesc : Intel(R) Xeon(R) CPU X5675 @ 3.07GHz
# cpuid : GenuineIntel,6,44,2
# total memory : 8182008 kB
# cmdline : /usr/bin/perf record -F 99 -a -g -- sleep 30
# event : name = cpu-clock, type = 1, config = 0x0, config1 = 0x0, config2 = ...
# HEADER_CPU_TOPOLOGY info available, use -I to display
# HEADER_NUMA_TOPOLOGY info available, use -I to display
# pmu mappings: software = 1, breakpoint = 5
# ========
#
# Samples: 22K of event 'cpu-clock'
# Event count (approx.): 22751
#
# Overhead  Command      Shared Object                           Symbol
# ........  .......  .................  ...............................
#94.12%       dd  [kernel.kallsyms]  [k] _raw_spin_unlock_irqrestore|--- _raw_spin_unlock_irqrestore|          |--96.67%-- extract_buf|          extract_entropy_user|          urandom_read|          vfs_read|          sys_read|          system_call_fastpath|          read|          |--1.69%-- account|          |          |          |--99.72%-- extract_entropy_user|          |          urandom_read|          |          vfs_read|          |          sys_read|          |          system_call_fastpath|          |          read|           --0.28%-- [...]|          |--1.60%-- mix_pool_bytes.constprop.17
[...]
This tree starts with the on-CPU functions and works back through the ancestry. This approach is called a "callee based call graph". This can be flipped by using -G for an "inverted call graph", or by using the "caller" option to -g/--call-graph, instead of the "callee" default.
The hottest (most frequent) stack trace in this perf call graph occurred in 90.99% of samples, which is the product of the overhead percentage and top stack leaf (94.12% x 96.67%, which are relative rates). perf report can also be run with "-g graph" to show absolute overhead rates, in which case "90.99%" is directly displayed on the stack leaf:
    94.12%       dd  [kernel.kallsyms]  [k] _raw_spin_unlock_irqrestore|--- _raw_spin_unlock_irqrestore|          |--90.99%-- extract_buf
[...]
If user-level stacks look incomplete, you can try perf record with "-g dwarf" as a different technique to unwind them. See the Stacks section.
The output from perf report can be many pages long, which can become cumbersome to read. Try generating Flame Graphs from the same data.
Hardware Counters
Apart from sampling at a fixed interval, taking samples triggered by CPU hardware counters is another form of CPU profiling. The available events can be found using perf list:
# perf list | grep Hardwarecpu-cycles OR cycles                               [Hardware event]instructions                                       [Hardware event]cache-references                                   [Hardware event]cache-misses                                       [Hardware event]branch-instructions OR branches                    [Hardware event]branch-misses                                      [Hardware event]bus-cycles                                         [Hardware event]stalled-cycles-frontend OR idle-cycles-frontend    [Hardware event]stalled-cycles-backend OR idle-cycles-backend      [Hardware event]ref-cycles                                         [Hardware event]L1-dcache-loads                                    [Hardware cache event]L1-dcache-load-misses                              [Hardware cache event]L1-dcache-stores                                   [Hardware cache event]L1-dcache-store-misses                             [Hardware cache event]
[...]
For many of these, gathering a stack on every occurrence would induce far too much overhead, and would slow down the system and change the performance characteristics of the target. It's usually sufficient to only instrument a small fraction of their occurrences, rather than all of them. This can be done by specifying a threshold for triggering event collection, using "-c" and a count.
For example, the following one-liner instruments Level 1 data cache load misses, collecting a stack trace for one in every 10,000 occurrences:
# perf record -e L1-dcache-load-misses -c 10000 -ag -- sleep 5
The mechanics of "-c count" are implemented by the processor, which only interrupts the kernel when the threshold has been reached.
See the earlier Raw Counters section for an example of specifying a custom counter.
Static Tracing
The following examples demonstrate static tracing: the instrumentation of tracepoints and other static events.
Counting Syscalls
The following simple one-liner counts system calls for the executed command, and prints a summary (of non-zero counts):
# perf stat -e 'syscalls:sys_enter_*' gzip file1 2>&1 | awk '$1 != 0'Performance counter stats for 'gzip file1':1 syscalls:sys_enter_utimensat 1 syscalls:sys_enter_unlink 5 syscalls:sys_enter_newfstat 1,603 syscalls:sys_enter_read 3,201 syscalls:sys_enter_write 5 syscalls:sys_enter_access 1 syscalls:sys_enter_fchmod 1 syscalls:sys_enter_fchown 6 syscalls:sys_enter_open 9 syscalls:sys_enter_close 8 syscalls:sys_enter_mprotect 1 syscalls:sys_enter_brk 1 syscalls:sys_enter_munmap 1 syscalls:sys_enter_set_robust_list 1 syscalls:sys_enter_futex 1 syscalls:sys_enter_getrlimit 5 syscalls:sys_enter_rt_sigprocmask 14 syscalls:sys_enter_rt_sigaction 1 syscalls:sys_enter_exit_group 1 syscalls:sys_enter_set_tid_address 14 syscalls:sys_enter_mmap 1.543990940 seconds time elapsed
In this case, a gzip command was analyzed. The report shows that there were 3,201 write() syscalls, and half that number of read() syscalls. Many of the other syscalls will be due to process and library initialization.
A similar report can be seen using strace -c, the system call tracer, however it may induce much higher overhead than perf, as perf buffers data in-kernel.
perf vs strace
To explain the difference a little further: the current implementation of strace uses ptrace(2) to attach to the target process and stop it during system calls, like a debugger. This is violent, and can cause serious overhead. To demonstrate this, the following syscall-heavy program was run by itself, with perf, and with strace. I've only included the line of output that shows its performance:
# dd if=/dev/zero of=/dev/null bs=512 count=10000k
5242880000 bytes (5.2 GB) copied, 3.53031 s, 1.5 GB/s# perf stat -e 'syscalls:sys_enter_*' dd if=/dev/zero of=/dev/null bs=512 count=10000k
5242880000 bytes (5.2 GB) copied, 9.14225 s, 573 MB/s# strace -c dd if=/dev/zero of=/dev/null bs=512 count=10000k
5242880000 bytes (5.2 GB) copied, 218.915 s, 23.9 MB/s
With perf, the program ran 2.5x slower. But with strace, it ran 62x slower. That's likely to be a worst-case result: if syscalls are not so frequent, the difference between the tools will not be as great.
Recent version of perf have included a trace subcommand, to provide some similar functionality to strace, but with much lower overhead.
New Processes
Tracing new processes triggered by a "man ls":
# perf record -e sched:sched_process_exec -a
^C[ perf record: Woken up 1 times to write data ]
[ perf record: Captured and wrote 0.064 MB perf.data (~2788 samples) ]
# perf report -n --sort comm --stdio
[...]
# Overhead       Samples  Command
# ........  ............  .......
#11.11%             1    troff11.11%             1      tbl11.11%             1  preconv11.11%             1    pager11.11%             1    nroff11.11%             1      man11.11%             1   locale11.11%             1   grotty11.11%             1    groff
Nine different commands were executed, each once. I used -n to print the "Samples" column, and "--sort comm" to customize the remaining columns.
This works by tracing sched:sched_process_exec, when a process runs exec() to execute a different binary. This is often how new processes are created, but not always. An application may fork() to create a pool of worker processes, but not exec() a different binary. An application may also reexec: call exec() again, on itself, usually to clean up its address space. In that case, it's will be seen by this exec tracepoint, but it's not a new process.
The sched:sched_process_fork tracepoint can be traced to only catch new processes, created via fork(). The downside is that the process identified is the parent, not the new target, as the new process has yet to exec() it's final program.
Outbound Connections
There can be times when it's useful to double check what network connections are initiated by a server, from which processes, and why. You might be surprised. These connections can be important to understand, as they can be a source of latency.
For this example, I have a completely idle ubuntu server, and while tracing I'll login to it using ssh. I'm going to trace outbound connections via the connect() syscall. Given that I'm performing an inbound connection over SSH, will there be any outbound connections at all?
# perf record -e syscalls:sys_enter_connect -a
^C[ perf record: Woken up 1 times to write data ]
[ perf record: Captured and wrote 0.057 MB perf.data (~2489 samples) ]
# perf report --stdio
# ========
# captured on: Tue Jan 28 10:53:38 2014
# hostname : ubuntu
# os release : 3.5.0-23-generic
# perf version : 3.5.7.2
# arch : x86_64
# nrcpus online : 2
# nrcpus avail : 2
# cpudesc : Intel(R) Core(TM) i7-3820QM CPU @ 2.70GHz
# cpuid : GenuineIntel,6,58,9
# total memory : 1011932 kB
# cmdline : /usr/bin/perf_3.5.0-23 record -e syscalls:sys_enter_connect -a
# event : name = syscalls:sys_enter_connect, type = 2, config = 0x38b, ...
# HEADER_CPU_TOPOLOGY info available, use -I to display
# HEADER_NUMA_TOPOLOGY info available, use -I to display
# ========
#
# Samples: 21  of event 'syscalls:sys_enter_connect'
# Event count (approx.): 21
#
# Overhead  Command       Shared Object                       Symbol
# ........  .......  ..................  ...........................
#52.38%     sshd  libc-2.15.so        [.] __GI___connect_internal19.05%   groups  libc-2.15.so        [.] __GI___connect_internal9.52%     sshd  libpthread-2.15.so  [.] __connect_internal     9.52%     mesg  libc-2.15.so        [.] __GI___connect_internal9.52%     bash  libc-2.15.so        [.] __GI___connect_internal
The report shows that sshd, groups, mesg, and bash are all performing connect() syscalls. Ring a bell?
The stack traces that led to the connect() can explain why:
# perf record -e syscalls:sys_enter_connect -ag
^C[ perf record: Woken up 1 times to write data ]
[ perf record: Captured and wrote 0.057 MB perf.data (~2499 samples) ]
# perf report --stdio
[...]55.00%     sshd  libc-2.15.so        [.] __GI___connect_internal|--- __GI___connect_internal|          |--27.27%-- add_one_listen_addr.isra.0|          |--27.27%-- __nscd_get_mapping|          __nscd_get_map_ref|          |--27.27%-- __nscd_open_socket--18.18%-- [...]20.00%   groups  libc-2.15.so        [.] __GI___connect_internal|--- __GI___connect_internal|          |--50.00%-- __nscd_get_mapping|          __nscd_get_map_ref|          --50.00%-- __nscd_open_socket10.00%     mesg  libc-2.15.so        [.] __GI___connect_internal|--- __GI___connect_internal|          |--50.00%-- __nscd_get_mapping|          __nscd_get_map_ref|          --50.00%-- __nscd_open_socket10.00%     bash  libc-2.15.so        [.] __GI___connect_internal|--- __GI___connect_internal|          |--50.00%-- __nscd_get_mapping|          __nscd_get_map_ref|          --50.00%-- __nscd_open_socket5.00%     sshd  libpthread-2.15.so  [.] __connect_internal     |--- __connect_internal
Ah, these are nscd calls: the name service cache daemon. If you see hexadecimal numbers and not function names, you will need to install debug info: see the earlier section on Symbols. These nscd calls are likely triggered by calling getaddrinfo(), which server software may be using to resolve IP addresses for logging, or for matching hostnames in config files. Browsing the stack traces should identify why.
For sshd, this was called via add_one_listen_addr(): a name that was only visible after adding the openssh-server-dbgsym package. Unfortunately, the stack trace doesn't continue after add_one_listen_add(). I can browse the OpenSSH code to figure out the reasons we're calling into add_one_listen_add(), or, I can get the stack traces to work. See the earlier section on Stack Traces.
I took a quick look at the OpenSSH code, and it looks like this code-path is due to parsing ListenAddress from the sshd_config file, which can contain either an IP address or a hostname.
Socket Buffers
Tracing the consumption of socket buffers, and the stack traces, is one way to identify what is leading to socket or network I/O.
# perf record -e 'skb:consume_skb' -ag
^C[ perf record: Woken up 1 times to write data ]
[ perf record: Captured and wrote 0.065 MB perf.data (~2851 samples) ]
# perf report
[...]74.42%  swapper  [kernel.kallsyms]  [k] consume_skb|--- consume_skbarp_processarp_rcv__netif_receive_skb_core__netif_receive_skbnetif_receive_skbvirtnet_pollnet_rx_action__do_softirqirq_exitdo_IRQret_from_intrdefault_idlecpu_idlestart_secondary25.58%     sshd  [kernel.kallsyms]  [k] consume_skb|--- consume_skbdev_kfree_skb_anyfree_old_xmit_skbs.isra.24start_xmitdev_hard_start_xmitsch_direct_xmitdev_queue_xmitip_finish_outputip_outputip_local_outip_queue_xmittcp_transmit_skbtcp_write_xmit__tcp_push_pending_framestcp_sendmsginet_sendmsgsock_aio_writedo_sync_writevfs_writesys_writesystem_call_fastpath__write_nocancel
The swapper stack shows the network receive path, triggered by an interrupt. The sshd path shows writes.
Dynamic Tracing
For kernel analysis, I'm using CONFIG_KPROBES=y and CONFIG_KPROBE_EVENTS=y, to enable kernel dynamic tracing, and CONFIG_FRAME_POINTER=y, for frame pointer-based kernel stacks. For user-level analysis, CONFIG_UPROBES=y and CONFIG_UPROBE_EVENTS=y, for user-level dynamic tracing.
Kernel: tcp_sendmsg()
This example shows instrumenting the kernel tcp_sendmsg() function on the Linux 3.9.3 kernel:
# perf probe --add tcp_sendmsg
Failed to find path of kernel module.
Added new event:probe:tcp_sendmsg    (on tcp_sendmsg)You can now use it in all perf tools, such as:perf record -e probe:tcp_sendmsg -aR sleep 1
This adds a new tracepoint event. It suggests using the -R option, to collect raw sample records, which is already the default for tracepoints. Tracing this event for 5 seconds, recording stack traces:
# perf record -e probe:tcp_sendmsg -a -g -- sleep 5
[ perf record: Woken up 1 times to write data ]
[ perf record: Captured and wrote 0.228 MB perf.data (~9974 samples) ]
And the report:
# perf report --stdio
# ========
# captured on: Fri Jan 31 20:10:14 2014
# hostname : pgbackup
# os release : 3.9.3-ubuntu-12-opt
# perf version : 3.9.3
# arch : x86_64
# nrcpus online : 8
# nrcpus avail : 8
# cpudesc : Intel(R) Xeon(R) CPU E5-2670 0 @ 2.60GHz
# cpuid : GenuineIntel,6,45,7
# total memory : 8179104 kB
# cmdline : /lib/modules/3.9.3/build/tools/perf/perf record -e probe:tcp_sendmsg -a -g -- sleep 5
# event : name = probe:tcp_sendmsg, type = 2, config = 0x3b2, config1 = 0x0, config2 = 0x0, ...
# HEADER_CPU_TOPOLOGY info available, use -I to display
# HEADER_NUMA_TOPOLOGY info available, use -I to display
# pmu mappings: software = 1, tracepoint = 2, breakpoint = 5
# ========
#
# Samples: 12  of event 'probe:tcp_sendmsg'
# Event count (approx.): 12
#
# Overhead  Command      Shared Object           Symbol
# ........  .......  .................  ...............
#100.00%     sshd  [kernel.kallsyms]  [k] tcp_sendmsg|--- tcp_sendmsgsock_aio_writedo_sync_writevfs_writesys_writesystem_call_fastpath__write_nocancel|          |--8.33%-- 0x50f00000001b810--91.67%-- [...]
This shows the path from the write() system call to tcp_sendmsg().
You can delete these dynamic tracepoints if you want after use, using perf probe --del.
Kernel: tcp_sendmsg() with size
If your kernel has debuginfo (CONFIG_DEBUG_INFO=y), you can fish out kernel variables from functions. This is a simple example of examining a size_t (integer), on Linux 3.13.1.
Listing variables available for tcp_sendmsg():
# perf probe -V tcp_sendmsg
Available variables at tcp_sendmsg@<tcp_sendmsg+0>size_t  sizestruct kiocb*   iocbstruct msghdr*  msgstruct sock*    sk
Creating a probe for tcp_sendmsg() with the "size" variable:
# perf probe --add 'tcp_sendmsg size'
Added new event:probe:tcp_sendmsg    (on tcp_sendmsg with size)You can now use it in all perf tools, such as:perf record -e probe:tcp_sendmsg -aR sleep 1
Tracing this probe:
# perf record -e probe:tcp_sendmsg -a
^C[ perf record: Woken up 1 times to write data ]
[ perf record: Captured and wrote 0.052 MB perf.data (~2252 samples) ]
# perf script
# ========
# captured on: Fri Jan 31 23:49:55 2014
# hostname : dev1
# os release : 3.13.1-ubuntu-12-opt
# perf version : 3.13.1
# arch : x86_64
# nrcpus online : 2
# nrcpus avail : 2
# cpudesc : Intel(R) Xeon(R) CPU E5645 @ 2.40GHz
# cpuid : GenuineIntel,6,44,2
# total memory : 1796024 kB
# cmdline : /usr/bin/perf record -e probe:tcp_sendmsg -a
# event : name = probe:tcp_sendmsg, type = 2, config = 0x1dd, config1 = 0x0, config2 = ...
# HEADER_CPU_TOPOLOGY info available, use -I to display
# HEADER_NUMA_TOPOLOGY info available, use -I to display
# pmu mappings: software = 1, tracepoint = 2, breakpoint = 5
# ========
#sshd  1301 [001]   502.424719: probe:tcp_sendmsg: (ffffffff81505d80) size=b0sshd  1301 [001]   502.424814: probe:tcp_sendmsg: (ffffffff81505d80) size=40sshd  2371 [000]   502.952590: probe:tcp_sendmsg: (ffffffff81505d80) size=27sshd  2372 [000]   503.025023: probe:tcp_sendmsg: (ffffffff81505d80) size=3c0sshd  2372 [001]   503.203776: probe:tcp_sendmsg: (ffffffff81505d80) size=98sshd  2372 [001]   503.281312: probe:tcp_sendmsg: (ffffffff81505d80) size=2d0sshd  2372 [001]   503.461358: probe:tcp_sendmsg: (ffffffff81505d80) size=30sshd  2372 [001]   503.670239: probe:tcp_sendmsg: (ffffffff81505d80) size=40sshd  2372 [001]   503.742565: probe:tcp_sendmsg: (ffffffff81505d80) size=140sshd  2372 [001]   503.822005: probe:tcp_sendmsg: (ffffffff81505d80) size=20sshd  2371 [000]   504.118728: probe:tcp_sendmsg: (ffffffff81505d80) size=30sshd  2371 [000]   504.192575: probe:tcp_sendmsg: (ffffffff81505d80) size=70
[...]
The size is shown as hexadecimal.
Kernel: tcp_sendmsg() line number and local variable
With debuginfo, perf_events can create tracepoints for lines within kernel functions. Listing available line probes for tcp_sendmsg():
# perf probe -L tcp_sendmsg
<tcp_sendmsg@/mnt/src/linux-3.14.5/net/ipv4/tcp.c:0>0  int tcp_sendmsg(struct kiocb *iocb, struct sock *sk, struct msghdr *msg,size_t size)2  {struct iovec *iov;struct tcp_sock *tp = tcp_sk(sk);struct sk_buff *skb;6         int iovlen, flags, err, copied = 0;7         int mss_now = 0, size_goal, copied_syn = 0, offset = 0;bool sg;long timeo;
[...]79                 while (seglen > 0) {int copy = 0;81                         int max = size_goal;skb = tcp_write_queue_tail(sk);84                         if (tcp_send_head(sk)) {85                                 if (skb->ip_summed == CHECKSUM_NONE)max = mss_now;87                                 copy = max - skb->len;}90                         if (copy <= 0) {new_segment:
[...]
This is Linux 3.14.5; your kernel version may look different. Lets check what variables are available on line 81:
# perf probe -V tcp_sendmsg:81
Available variables at tcp_sendmsg:81@<tcp_sendmsg+537>bool    sgint     copiedint     copied_synint     flagsint     mss_nowint     offsetint     size_goallong int        timeosize_t  seglenstruct iovec*   iovstruct sock*    skunsigned char*  from
Now lets trace line 81, with the seglen variable that is checked in the loop:
# perf probe --add 'tcp_sendmsg:81 seglen'
Added new event:probe:tcp_sendmsg    (on tcp_sendmsg:81 with seglen)You can now use it in all perf tools, such as:perf record -e probe:tcp_sendmsg -aR sleep 1# perf record -e probe:tcp_sendmsg -a
^C[ perf record: Woken up 1 times to write data ]
[ perf record: Captured and wrote 0.188 MB perf.data (~8200 samples) ]
# perf scriptsshd  4652 [001] 2082360.931086: probe:tcp_sendmsg: (ffffffff81642ca9) seglen=0x80app_plugin.pl  2400 [001] 2082360.970489: probe:tcp_sendmsg: (ffffffff81642ca9) seglen=0x20postgres  2422 [000] 2082360.970703: probe:tcp_sendmsg: (ffffffff81642ca9) seglen=0x52app_plugin.pl  2400 [000] 2082360.970890: probe:tcp_sendmsg: (ffffffff81642ca9) seglen=0x7bpostgres  2422 [001] 2082360.971099: probe:tcp_sendmsg: (ffffffff81642ca9) seglen=0xbapp_plugin.pl  2400 [000] 2082360.971140: probe:tcp_sendmsg: (ffffffff81642ca9) seglen=0x55
[...]
This is pretty amazing. Remember that you can also include in-kernel filtering using --filter, to match only the data you want.
User: malloc()
While this is an interesting example, I want to say right off the bat that malloc() calls are very frequent, so you will need to consider the overheads of tracing calls like this.
Adding a libc malloc() probe:
# perf probe -x /lib/x86_64-linux-gnu/libc-2.15.so --add malloc
Added new event:probe_libc:malloc    (on 0x82f20)You can now use it in all perf tools, such as:perf record -e probe_libc:malloc -aR sleep 1
Tracing it system-wide:
# perf record -e probe_libc:malloc -a
^C[ perf record: Woken up 12 times to write data ]
[ perf record: Captured and wrote 3.522 MB perf.data (~153866 samples) ]
The report:
# perf report -n
[...]
# Samples: 45K of event 'probe_libc:malloc'
# Event count (approx.): 45158
#
# Overhead       Samples          Command  Shared Object      Symbol
# ........  ............  ...............  .............  ..........
#42.72%         19292       apt-config  libc-2.15.so   [.] malloc19.71%          8902             grep  libc-2.15.so   [.] malloc7.88%          3557             sshd  libc-2.15.so   [.] malloc6.25%          2824              sed  libc-2.15.so   [.] malloc6.06%          2738            which  libc-2.15.so   [.] malloc4.12%          1862  update-motd-upd  libc-2.15.so   [.] malloc3.72%          1680             stat  libc-2.15.so   [.] malloc1.68%           758            login  libc-2.15.so   [.] malloc1.21%           546        run-parts  libc-2.15.so   [.] malloc1.21%           545               ls  libc-2.15.so   [.] malloc0.80%           360        dircolors  libc-2.15.so   [.] malloc0.56%           252               tr  libc-2.15.so   [.] malloc0.54%           242              top  libc-2.15.so   [.] malloc0.49%           222       irqbalance  libc-2.15.so   [.] malloc0.44%           200             dpkg  libc-2.15.so   [.] malloc0.38%           173         lesspipe  libc-2.15.so   [.] malloc0.29%           130  update-motd-fsc  libc-2.15.so   [.] malloc0.25%           112            uname  libc-2.15.so   [.] malloc0.24%           108              cut  libc-2.15.so   [.] malloc0.23%           104           groups  libc-2.15.so   [.] malloc0.21%            94  release-upgrade  libc-2.15.so   [.] malloc0.18%            82        00-header  libc-2.15.so   [.] malloc0.14%            62             mesg  libc-2.15.so   [.] malloc0.09%            42  update-motd-reb  libc-2.15.so   [.] malloc0.09%            40             date  libc-2.15.so   [.] malloc0.08%            35             bash  libc-2.15.so   [.] malloc0.08%            35         basename  libc-2.15.so   [.] malloc0.08%            34          dirname  libc-2.15.so   [.] malloc0.06%            29               sh  libc-2.15.so   [.] malloc0.06%            26        99-footer  libc-2.15.so   [.] malloc0.05%            24              cat  libc-2.15.so   [.] malloc0.04%            18             expr  libc-2.15.so   [.] malloc0.04%            17         rsyslogd  libc-2.15.so   [.] malloc0.03%            12             stty  libc-2.15.so   [.] malloc0.00%             1             cron  libc-2.15.so   [.] malloc
This shows the most malloc() calls were by apt-config, while I was tracing.
User: malloc() with size
As of the Linux 3.13.1 kernel, this is not supported yet:
# perf probe -x /lib/x86_64-linux-gnu/libc-2.15.so --add 'malloc size'
Debuginfo-analysis is not yet supported with -x/--exec option.Error: Failed to add events. (-38)
As a workaround, can I access the user-level registers, and pull the first argument that way? (I'll update this if I find a way.)
Visualizations
perf_events has a builtin visualization: timecharts, as well as text-style visualization via its text user interface (TUI) and tree reports. The following two sections show visualizations of my own: flame graphs and heat maps. The software I'm using is open source and on github, and produces these from perf_events collected data. (It'd be very handy to have these integrated into perf_events directly; if you want to do that, let me know if I can help.)
Flame Graphs
Flame Graphs can be produced from perf_events profiling data using the FlameGraph tools software. This visualizes the same data you see in perf report, and works with any perf.data file that was captured with stack traces (-g).
Example
This example CPU flame graph shows a network workload for the 3.2.9-1 Linux kernel, running as a KVM instance (SVG, PNG):
Flame Graphs show the sample population across the x-axis, and stack depth on the y-axis. Each function (stack frame) is drawn as a rectangle, with the width relative to the number of samples. See the CPU Flame Graphs page for the full description of how these work.
You can use the mouse to explore where kernel CPU time is spent, quickly quantifying code-paths and determining where performance tuning efforts are best spent. This example shows that most time was spent in the vp_notify() code-path, spending 70.52% of all on-CPU samples performing iowrite16(), which is handled by the KVM hypervisor. This information has been extremely useful for directing KVM performance efforts.
A similar network workload on a bare metal Linux system looks quite different, as networking isn't processed via the virtio-net driver, for a start.
Generation
The example flame graph was generated using perf_events and the FlameGraph tools:
# git clone https://github.com/brendangregg/FlameGraph  # or download it from github
# cd FlameGraph
# perf record -F 99 -ag -- sleep 60
# perf script | ./stackcollapse-perf.pl > out.perf-folded
# cat out.perf-folded | ./flamegraph.pl > perf-kernel.svg
The first perf command profiles CPU stacks, as explained earlier. I adjusted the rate to 99 Hertz here; I actually generated the flame graph from a 1000 Hertz profile, but I'd only use that if you had a reason to go faster, which costs more in overhead. The samples are saved in a perf.data file, which can be viewed using perf report:
# perf report --stdio
[...]
# Overhead          Command          Shared Object                               Symbol
# ........  ...............  .....................  ...................................
#72.18%            iperf  [kernel.kallsyms]      [k] iowrite16|--- iowrite16|          |--99.53%-- vp_notify|          virtqueue_kick|          start_xmit|          dev_hard_start_xmit|          sch_direct_xmit|          dev_queue_xmit|          ip_finish_output|          ip_output|          ip_local_out|          ip_queue_xmit|          tcp_transmit_skb|          tcp_write_xmit|          |          |          |--98.16%-- tcp_push_one|          |          tcp_sendmsg|          |          inet_sendmsg|          |          sock_aio_write|          |          do_sync_write|          |          vfs_write|          |          sys_write|          |          system_call|          |          0x369e40e5cd|          |          |           --1.84%-- __tcp_push_pending_frames
[...]
This tree follows the flame graph when reading it top-down. When using -g/--call-graph (for "caller", instead of the "callee" default), it generates a tree that follows the flame graph when read bottom-up. The hottest stack trace in the flame graph (@70.52%) can be seen in this perf call graph as the product of the top three nodes (72.18% x 99.53% x 98.16%).
The perf report tree (and the ncurses navigator) do an excellent job at presenting this information as text. However, with text there are limitations. The output often does not fit in one screen (you could say it doesn't need to, if the bulk of the samples are identified on the first page). Also, identifying the hottest code paths requires reading the percentages. With the flame graph, all the data is on screen at once, and the hottest code-paths are immediately obvious as the widest functions.
For generating the flame graph, the perf script command dumps the stack samples, which are then aggregated by stackcollapse-perf.pl and folded into single lines per-stack. That output is then converted by flamegraph.pl into the SVG. I included a gratuitous "cat" command to make it clear that flamegraph.pl can process the output of a pipe, which could include Unix commands to filter or preprocess (grep, sed, awk).
Piping
A flame graph can be generated directly by piping all the steps:
# perf script | ./stackcollapse-perf.pl | ./flamegraph.pl > perf-kernel.svg
In practice I don't do this, as I often re-run flamegraph.pl multiple times, and this one-liner would execute everything multiple times. The output ofperf script can be dozens of Mbytes, taking many seconds to process. By writing stackcollapse-perf.pl to a file, you've cached the slowest step, and can also edit the file (vi) to delete unimportant stacks, such as CPU idle threads.
Filtering
The one-line-per-stack output of stackcollapse-perf.pl is also convenient for grep(1). Eg:
# perf script | ./stackcollapse-perf.pl > out.perf-folded# grep -v cpu_idle out.perf-folded | ./flamegraph.pl > nonidle.svg# grep ext4 out.perf-folded | ./flamegraph.pl > ext4internals.svg# egrep 'system_call.*sys_(read|write)' out.perf-folded | ./flamegraph.pl > rw.svg
I frequently elide the cpu_idle threads in this way, to focus on the real threads that are consuming CPU resources. If I miss this step, the cpu_idle threads can often dominate the flame graph, squeezing the interesting code paths.
Note that it would be a little more efficient to process the output of perf report instead of perf script; better still, perf report could have a report style (eg, "-g folded") that output folded stacks directly, obviating the need for stackcollapse-perf.pl. There could even be a perf mode that output the SVG directly (which wouldn't be the first one; see perf-timechart), although, that would miss the value of being able to grep the folded stacks (which I use frequently).
There are more examples of perf_events CPU flame graphs on the CPU flame graph page, including a summary of these instructions.
Heat Maps
Since perf_events can record high resolution timestamps (microseconds) for events, some latency measurements can be derived from trace data.
Example
The following heat map visualizes disk I/O latency data collected from perf_events (SVG, PNG):
Mouse-over blocks to explore the latency distribution over time. The x-axis is the passage of time, the y-axis latency, and the z-axis (color) is the number of I/O at that time and latency range. The distribution is bimodal, with the dark line at the bottom showing that many disk I/O completed with sub-millisecond latency: cache hits. There is a cloud of disk I/O from about 3 ms to 25 ms, which would be caused by random disk I/O (and queueing). Both these modes averaged to the 9 ms we saw earlier.
The following iostat output was collected at the same time as the heat map data was collected (shows a typical one second summary):
# iostat -x 1
[...]
Device: rrqm/s wrqm/s    r/s   w/s   rkB/s wkB/s avgrq-sz avgqu-sz await r_await w_await svctm  %util
vda       0.00   0.00   0.00  0.00    0.00  0.00     0.00     0.00  0.00    0.00    0.00  0.00   0.00
vdb       0.00   0.00 334.00  0.00 2672.00  0.00    16.00     2.97  9.01    9.01    0.00  2.99 100.00
This workload has an average I/O time (await) of 9 milliseconds, which sounds like a fairly random workload on 7200 RPM disks. The problem is that we don't know the distribution from the iostat output, or any similar latency average. There could be latency outliers present, which is not visible in the average, and yet are causing problems. The heat map did show I/O up to 50 ms, which you might not have expected from that iostat output. There could also be multiple modes, as we saw in the heat map, which are also not visible in an average.
Gathering
I used perf_events to record the block request (disk I/O) issue and completion static tracepoints:
# perf record -e block:block_rq_issue -e block:block_rq_complete -a sleep 120
[ perf record: Woken up 36 times to write data ]
[ perf record: Captured and wrote 8.885 MB perf.data (~388174 samples) ]
# perf script
[...]randread.pl  2522 [000]  6011.824759: block:block_rq_issue: 254,16 R 0 () 7322849 + 16 [randread.pl]randread.pl  2520 [000]  6011.824866: block:block_rq_issue: 254,16 R 0 () 26144801 + 16 [randread.pl]swapper     0 [000]  6011.828913: block:block_rq_complete: 254,16 R () 31262577 + 16 [0]randread.pl  2521 [000]  6011.828970: block:block_rq_issue: 254,16 R 0 () 70295937 + 16 [randread.pl]swapper     0 [000]  6011.835862: block:block_rq_complete: 254,16 R () 26144801 + 16 [0]randread.pl  2520 [000]  6011.835932: block:block_rq_issue: 254,16 R 0 () 5495681 + 16 [randread.pl]swapper     0 [000]  6011.837988: block:block_rq_complete: 254,16 R () 7322849 + 16 [0]randread.pl  2522 [000]  6011.838051: block:block_rq_issue: 254,16 R 0 () 108589633 + 16 [randread.pl]swapper     0 [000]  6011.850615: block:block_rq_complete: 254,16 R () 108589633 + 16 [0]
[...]
The full output from perf script is about 70,000 lines. I've included some here so that you can see the kind of data available.
Processing
To calculate latency for each I/O, I'll need to pair up the issue and completion events, so that I can calculate the timestamp delta. The columns look straightforward (and are in include/trace/events/block.h), with the 4th field the timestamp in seconds (with microsecond resolution), the 6th field the disk device ID (major, minor), and a later field (which varies based on the tracepoint) has the disk offset. I'll use the disk device ID and offset as the unique identifier, assuming the kernel will not issue concurrent I/O to the exact same location.
I'll use awk to do these calculations and print the completion times and latency:
# perf script | awk '{ gsub(/:/, "") } $5 ~ /issue/ { ts[$6, $10] = $4 }$5 ~ /complete/ { if (l = ts[$6, $9]) { printf "%.f %.f\n", $4 * 1000000,($4 - l) * 1000000; ts[$6, $10] = 0 } }' > out.lat_us
# more out.lat_us
6011793689 8437
6011797306 3488
6011798851 1283
6011806422 11248
6011824680 18210
6011824693 21908
[...]
I converted both columns to be microseconds, to make the next step easier.
Generation
Now I can use my trace2heatmap.pl program (github), to generate the interactive SVG heatmap from the trace data (and uses microseconds by default):
# ./trace2heatmap.pl --unitstime=us --unitslat=us --maxlat=50000 out.lat_us > out.svg
When I generated the heatmap, I truncated the y scale to 50 ms. You can adjust it to suit your investigation, increasing it to see more of the latency outliers, or decreasing it to reveal more resolution for the lower latencies: for example, with a 250 us limit.
Overheads
While this can be useful to do, be mindful of the overheads. In my case, I had a low rate of disk I/O (~300 IOPS), which generated an 8 Mbyte trace file after 2 minutes. If your disk IOPS were 100x that, your trace file will also be 100x, and the overheads for gathering and processing will add up.
For more about latency heatmaps, see my LISA 2010 presentation slides, and my CACM 2010 article, both about heat maps. Also see my Perf Heat Maps blog post.
More
There's more capabilities to perf_events than I've demonstrated here. I'll add examples of the other subcommands when I get a chance.
Here's a preview of perf trace, which was added in 3.7, demonstrated on 3.13.1:
# perf trace ls0.109 ( 0.000 ms):  ... [continued]: read()) = 10.430 ( 0.000 ms):  ... [continued]: execve()) = -20.565 ( 0.051 ms): execve(arg0: 140734989338352, arg1: 140734989358048, arg2: 40612288, arg3: 1407...0.697 ( 0.051 ms): execve(arg0: 140734989338353, arg1: 140734989358048, arg2: 40612288, arg3: 1407...0.797 ( 0.046 ms): execve(arg0: 140734989338358, arg1: 140734989358048, arg2: 40612288, arg3: 1407...0.915 ( 0.045 ms): execve(arg0: 140734989338359, arg1: 140734989358048, arg2: 40612288, arg3: 1407...1.030 ( 0.044 ms): execve(arg0: 140734989338362, arg1: 140734989358048, arg2: 40612288, arg3: 1407...1.414 ( 0.311 ms): execve(arg0: 140734989338363, arg1: 140734989358048, arg2: 40612288, arg3: 1407...2.156 ( 1.053 ms):  ... [continued]: brk()) = 0xac90002.319 ( 1.215 ms):  ... [continued]: access()) = -1 ENOENT No such file or directory2.479 ( 1.376 ms):  ... [continued]: mmap()) = 0xb3a840002.634 ( 0.052 ms): access(arg0: 139967406289504, arg1: 4, arg2: 139967408408688, arg3: 13996740839...2.787 ( 0.205 ms):  ... [continued]: open()) = 32.919 ( 0.337 ms):  ... [continued]: fstat()) = 03.049 ( 0.057 ms): mmap(arg0: 0, arg1: 22200, arg2: 1, arg3: 2, arg4: 3, arg5: 0         ) = 0xb3a...3.177 ( 0.184 ms):  ... [continued]: close()) = 03.298 ( 0.043 ms): access(arg0: 139967406278152, arg1: 0, arg2: 6, arg3: 7146772199173811245, arg4...3.432 ( 0.049 ms): open(arg0: 139967408376811, arg1: 524288, arg2: 0, arg3: 139967408376810, arg4:...3.560 ( 0.045 ms): read(arg0: 3, arg1: 140737350651528, arg2: 832, arg3: 139967408376810, arg4: 14...3.684 ( 0.042 ms): fstat(arg0: 3, arg1: 140737350651216, arg2: 140737350651216, arg3: 354389249727...3.814 ( 0.054 ms): mmap(arg0: 0, arg1: 2221680, arg2: 5, arg3: 2050, arg4: 3, arg5: 0    ) = 0xb36...
[...]
An advantage is that this is buffered tracing, which costs much less overhead than strace, as I described earlier. The perf trace output seen from this 3.13.1 kernel does, however, looks suspicious for a number of reasons. I think this is still an in-development feature. It reminds me of my dtrusstool, which has a similar role, before I added code to print each system call in a custom and appropriate way.
Building
The steps to build perf_events depends on your kernel version and Linux distribution. In summary:
- Get the Linux kernel source that matches your currently running kernel (eg, from the linux-source package, or kernel.org).
- Unpack the kernel source.
- cd tools/perf
- make
- Fix all errors, and most warnings, from (4).
The first error may be that you are missing make, or a compiler (gcc). Once you have those, you may then see various warnings about missing libraries, which disable perf features. I'd install as many as possible, and take note of the ones you are missing.
These perf build warnings are really helpful, and are generated by its Makefile. Here's the makefile from 3.9.3:
# grep found Makefile
msg := $(warning No libelf found, disables 'probe' tool, please install elfutils-libelf-devel/libelf-dev);
msg := $(error No gnu/libc-version.h found, please install glibc-dev[el]/glibc-static);
msg := $(warning No libdw.h found or old libdw.h found or elfutils is older than 0.138, disables dwarf support.Please install new elfutils-devel/libdw-dev);
msg := $(warning No libunwind found, disabling post unwind support. Please install libunwind-dev[el] >= 0.99);
msg := $(warning No libaudit.h found, disables 'trace' tool, please install audit-libs-devel or libaudit-dev);
msg := $(warning newt not found, disables TUI support. Please install newt-devel or libnewt-dev);
msg := $(warning GTK2 not found, disables GTK2 support. Please install gtk2-devel or libgtk2.0-dev);
$(if $(1),$(warning No $(1) was found))
msg := $(warning No bfd.h/libbfd found, install binutils-dev[el]/zlib-static to gain symbol demangling)
msg := $(warning No numa.h found, disables 'perf bench numa mem' benchmark, please install numa-libs-devel orlibnuma-dev);
Take the time to read them. This list is likely to grow as new features are added to perf_events.
The following notes show what I've specifically done for kernel versions and distributions, in case it is helpful.
Packages: Ubuntu, 3.8.6
Packages required for key functionality: gcc make bison flex elfutils libelf-dev libdw-dev libaudit-dev. You may also consider python-dev (for python scripting) and binutils-dev (for symbol demangling), which are larger packages.
Kernel Config: 3.8.6
Here are some kernel CONFIG options for perf_events functionality:
# for perf_events:
CONFIG_PERF_EVENTS=y
# for stack traces:
CONFIG_FRAME_POINTER=y
# kernel symbols:
CONFIG_KALLSYMS=y
# tracepoints:
CONFIG_TRACEPOINTS=y
# kernel function trace:
CONFIG_FTRACE=y
# kernel-level dynamic tracing:
CONFIG_KPROBES=y
CONFIG_KPROBE_EVENTS=y
# user-level dynamic tracing:
CONFIG_UPROBES=y
CONFIG_UPROBE_EVENTS=y
# full kernel debug info:
CONFIG_DEBUG_INFO=y
# kernel lock tracing:
CONFIG_LOCKDEP=y
# kernel lock tracing:
CONFIG_LOCK_STAT=y
# kernel dynamic tracepoint variables:
CONFIG_DEBUG_INFO=y
You may need to build your own kernel to enable these. The exact set you need depends on your needs and kernel version, and list is likely to grow as new features are added to perf_events.
Troubleshooting
If you see hexadecimal numbers instead of symbols, or have truncated stack traces, see the Prerequisites section.
Here are some rough notes from other issues I've encountered.
This sometimes works (3.5.7.2) and sometimes throws the following error (3.9.3):
ubuntu# perf stat -e 'syscalls:sys_enter_*' -a sleep 5
Error:
Too many events are opened.
Try again after reducing the number of events.
This can be fixed by increasing the file descriptor limit using ulimit -n.
Type 3 errors:
ubuntu# perf report
0xab7e48 [0x30]: failed to process type: 3
# ========
# captured on: Tue Jan 28 21:08:31 2014
# hostname : pgbackup
# os release : 3.9.3-ubuntu-12-opt
# perf version : 3.9.3
# arch : x86_64
# nrcpus online : 8
# nrcpus avail : 8
# cpudesc : Intel(R) Xeon(R) CPU E5-2670 0 @ 2.60GHz
# cpuid : GenuineIntel,6,45,7
# total memory : 8179104 kB
# cmdline : /lib/modules/3.9.3-ubuntu-12-opt/build/tools/perf/perf record-e sched:sched_process_exec -a
# event : name = sched:sched_process_exec, type = 2, config = 0x125, config1 = 0x0,config2 = 0x0, excl_usr = 0, excl_kern = 0, excl_host = 0, excl_guest = 1, precise_ip = 0
# HEADER_CPU_TOPOLOGY info available, use -I to display
# HEADER_NUMA_TOPOLOGY info available, use -I to display
# pmu mappings: software = 1, tracepoint = 2, breakpoint = 5
# ========
#
Warning: Timestamp below last timeslice flush
Other Tools
perf_events has the capabilities from many other tools rolled into one: strace(1), for tracing system calls, tcpdump(8), for tracing network packets, and blktrace(1), for tracing block device I/O (disk I/O), and other targets including file system and scheduler events. Tracing all events from one tool is not only convenient, it also allows direct correlations, including timestamps, between different instrumentation sources. Unlike these other tools, some assembly is required, which may not be for everyone (as explained in Audience).
Posts
I've also been writing blog posts on specific perf_events topics. My suggested reading order is from oldest to newest (top down):
- 22 Jun 2014: perf CPU Sampling
- 29 Jun 2014: perf Static Tracepoints
- 01 Jul 2014: perf Heat Maps
- 03 Jul 2014: perf Counting
- 10 Jul 2014: perf Hacktogram
- 11 Sep 2014: Linux perf Rides the Rocket
- 17 Sep 2014: node.js Flame Graphs on Linux
And posts on ftrace:
- 16 Jul 2014: iosnoop for Linux
- 23 Jul 2014: Linux iosnoop Latency Heat Maps
- 25 Jul 2014: opensnoop for Linux
- 28 Jul 2014: execsnoop for Linux: See Short-Lived Processes
Links
perf_events:
- perf-tools (github), a collection of my performance analysis tools based on Linux perf_events and ftrace.
- perf Main Page.
- The excellent perf Tutorial, which focuses more on CPU hardware counters.
- The Unofficial Linux Perf Events Web-Page by Vince Weaver.
- The perf user mailing list.
- The OMG SO PERF T-shirt (site has coarse language).
- Shannon Cepeda's great posts on pipeline speak: frontend and backend.
- Jiri Olsa's dwarf mode callchain patch.
- Linux kernel source: tools/perf/Documentation/examples.txt.
- Linux kernel source: tools/perf/Documentation/perf-record.txt.
- ... and other documentation under tools/perf/Documentation.
ftrace:
- perf-tools (github), a collection of my performance analysis tools based on Linux perf_events and ftrace.
- Linux kernel source: Documentation/trace/ftrace.txt.
- lwn.net Secrets of the Ftrace function tracer, by Steven Rostedt, Jan 2010.
- lwn.net Debugging the kernel using Ftrace - part 1, by Steven Rostedt, Dec 2009.
- lwn.net Debugging the kernel using Ftrace - part 2, by Steven Rostedt, Dec 2009.
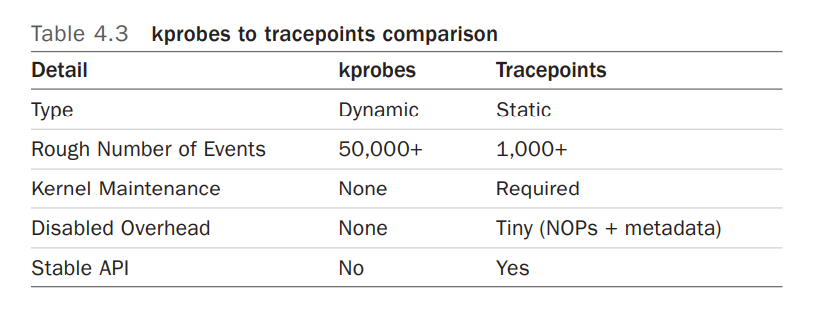
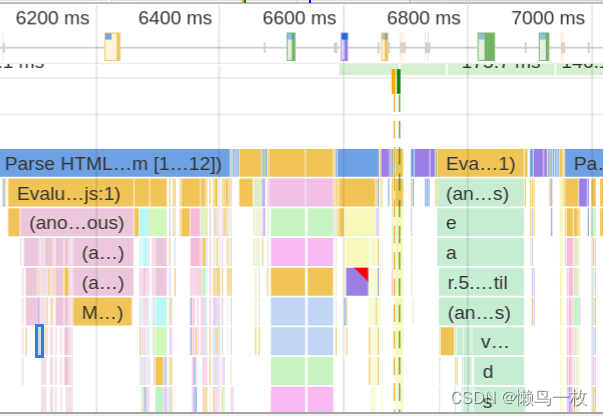

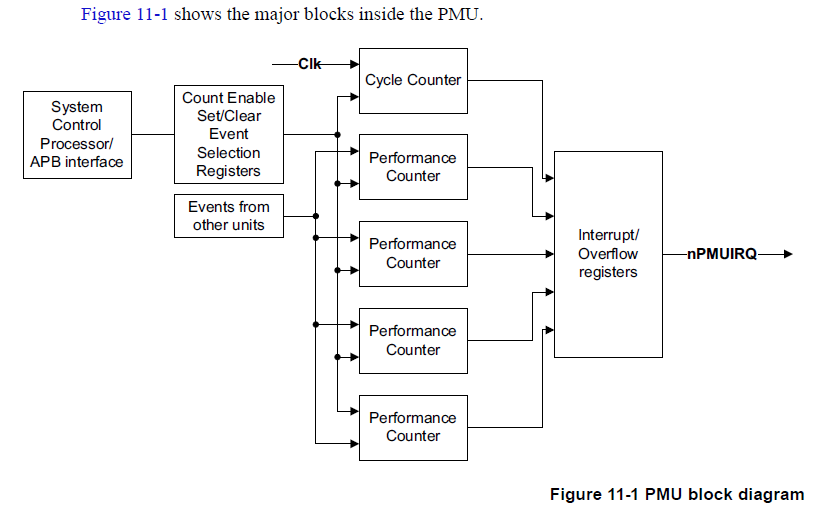

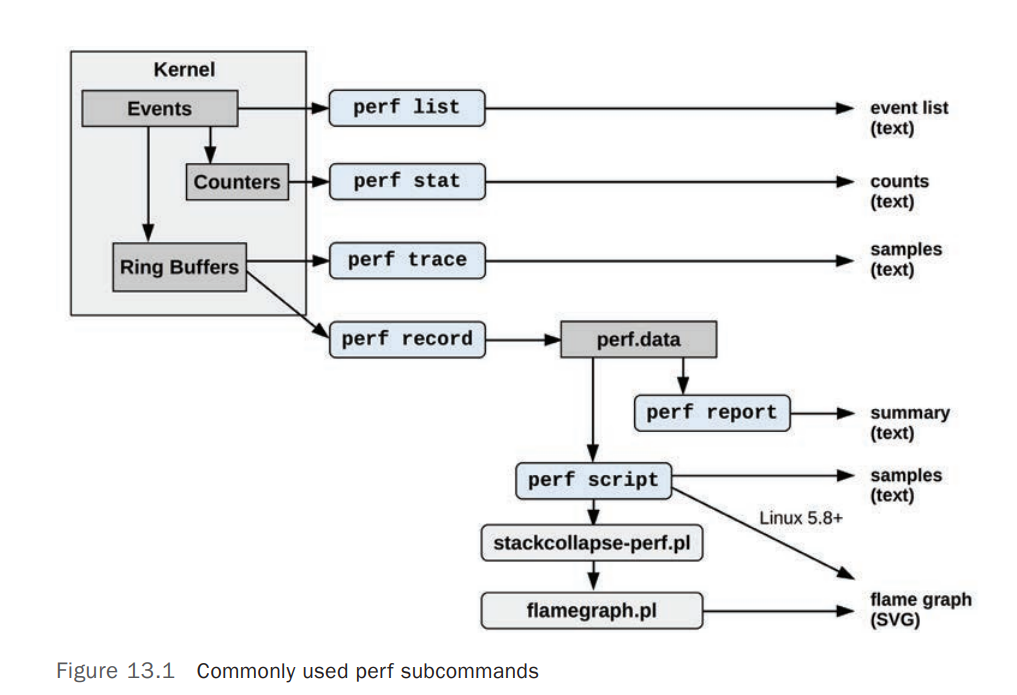
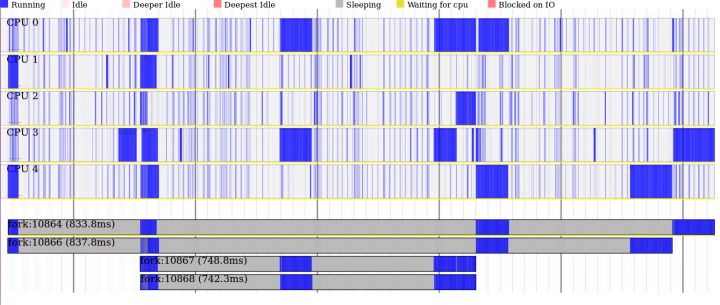


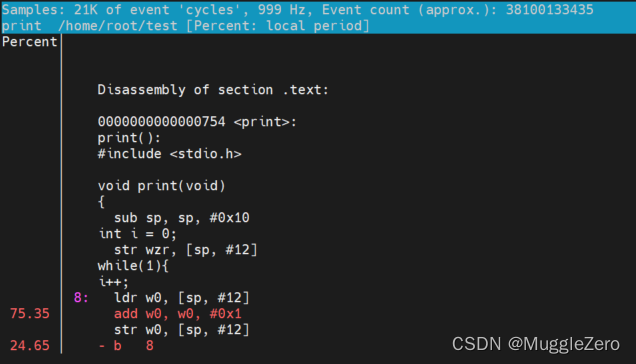

![[JavaScript] 理解 e.clientX,e.clientY e.pageX e.pageY e.offsetX e.offsetY](https://img-blog.csdnimg.cn/20200917224556661.png?x-oss-process=image/watermark,type_ZmFuZ3poZW5naGVpdGk,shadow_10,text_aHR0cHM6Ly9ibG9nLmNzZG4ubmV0L3FxXzQzNTQwMjE5,size_16,color_FFFFFF,t_70#pic_center)


