文章目录
- 前言
- 一、perf简介
- 二、perf子命令简介
- 三、perf工作模式
- 3.1 计数
- 3.2 采样
- 参考资料
前言
系统级性能优化通常包括两个阶段:性能剖析(performance profiling)和代码优化。
(1)性能剖析的目标是寻找性能瓶颈,查找引发性能问题的原因及热点代码。
(2)代码优化的目标是针对具体性能问题而优化代码或编译选项,以改善软件性能。
在性能剖析阶段,需要借助于现有的profiling工具,如perf等。
NAMEperf - Performance analysis tools for Linux
DESCRIPTIONPerformance counters for Linux are a new kernel-based subsystem that provide a framework for all things performance analysis. It covers hardware level (CPU/PMU, Performance MonitoringUnit) features and software features (software counters, tracepoints) as well.
一、perf简介
perf(perf_event,perf总是与event一起的)是官方的Linux性能分析工具,位于Linux内核源代码中的tools/perf下。它是一个具有分析、跟踪和脚本功能的多工具,是内核perf_events可观察性子系统的前端(front-end)。perf_events也称为Linux(Performance Counters for Linux:PCL)或Linux性能事件( Linux perf events:LPE)的性能计数器。perf_events和perf前端最初具有性能监视计数器(PMC)功能,但后来发展到支持基于事件的跟踪源:tracepoints, kprobes, uprobes, and USDT。如下所示:

图片来自于:https://www.brendangregg.com/perf.html
通过perf,应用程序可以利用PMU、tracepoint和内核中的计数器来进行性能统计。它不但可以分析制定应用 程序的性能问题(per thread),也可以用来分析内核的性能问题,当然也可以同时分析应用程序和内核,从而全面理解应用程序中的性能瓶颈。 使用perf,可以分析程序运行期间发生的硬件事件,比如instructions retired、processor clock cycles等; 也可以分析软件时间,比如page fault和进程切换。
与其他跟踪程序相比,perf 特别适用于CPU分析:分析(采样)CPU堆栈跟踪、跟踪CPU调度器行为,并检查PMC以了解微架构级别的CPU性能,包括循环行为。它的跟踪功能允许它分析其他目标,包括磁盘I/O和软件功能。
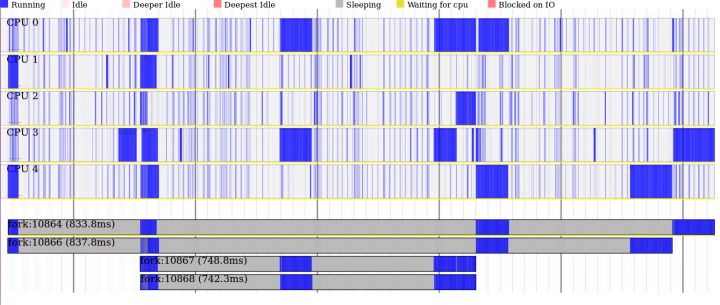
比如ftrace偏向于抓取数据,而perf对于抓取的数据进行了分析。如下图所示:

图片来自于:极客时间 容器高手实战
第一层是最基础的提供数据的机制,这里就包含了tracepoints、kprobes,还有一些别的events,比如perf使用的HW/SW events。
第二层是进行数据收集的工具,这里包含了ftrace、perf,还有ebpf。
第三层是用户层工具。
二、perf子命令简介
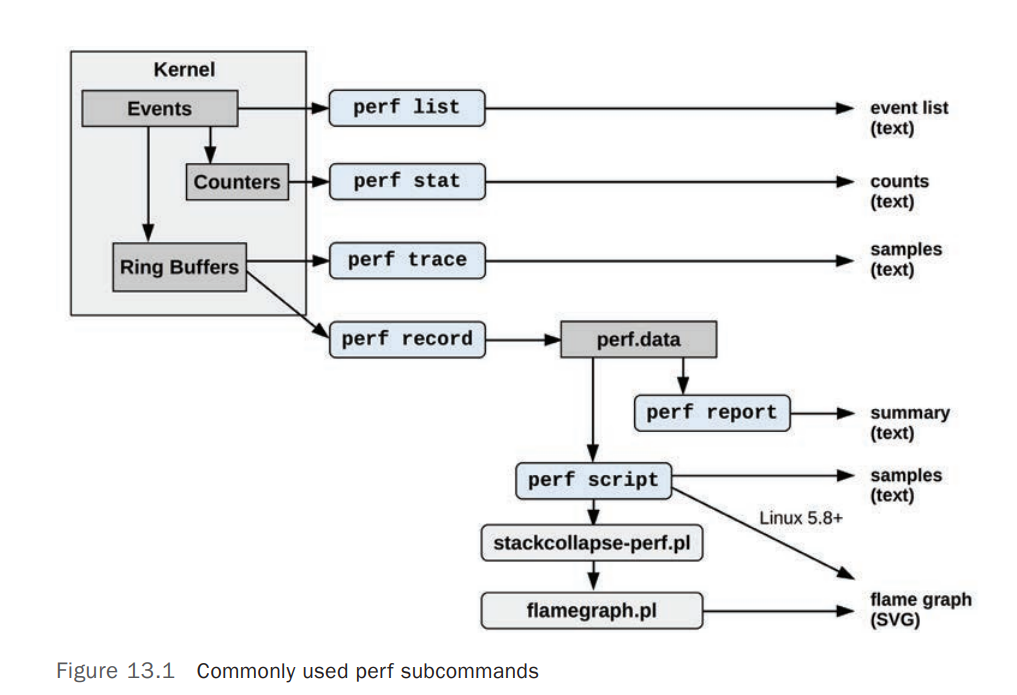
perf的功能通过子命令调用。作为常见用法示例,下面使用两个子命令:record用于检测事件并将其保存到文件,然后report用于汇总文件的内容。
NAMEperf-record - Run a command and record its profile into perf.data
DESCRIPTIONThis command runs a command and gathers a performance counter profile from it, into perf.data - without displaying anything.-a, --all-cpusSystem-wide collection from all CPUs (default if no target is specified).-F, --freq=Profile at this frequency.
NAMEperf-report - Read perf.data (created by perf record) and display the profile
DESCRIPTIONThis command displays the performance counter profile information recorded via perf record.--stdioUse the stdio interface.
[root@localhost ~]# perf record -F 99 -a -- sleep 30
[ perf record: Woken up 1 times to write data ]
[ perf record: Captured and wrote 0.686 MB perf.data (257 samples) ]
[root@localhost ~]# perf report --stdio
# To display the perf.data header info, please use --header/--header-only options.
#
#
# Total Lost Samples: 0
#
# Samples: 257  of event 'cycles:ppp'
# Event count (approx.): 2015944621
#
# Overhead  Command      Shared Object            Symbol
# ........  ...........  .......................  ...................................
#20.82%  perf         [kernel.vmlinux]         [k] unlink_anon_vmas16.08%  pool         [kernel.vmlinux]         [k] context_struct_compute_av13.41%  swapper      [kernel.vmlinux]         [k] exit_idle12.53%  perf         [kernel.vmlinux]         [k] generic_exec_single2.80%  bash         bash                     [.] 0x000000000003e5c81.75%  swapper      [kernel.vmlinux]         [k] intel_idle1.37%  pgrep        [kernel.vmlinux]         [k] pid_revalidate0.89%  bash         [kernel.vmlinux]         [.] irq_return0.81%  df           [kernel.vmlinux]         [k] error_swapgs0.68%  bash         bash                     [.] 0x000000000003e5d00.66%  pgrep        [kernel.vmlinux]         [k] _raw_spin_lock0.55%  swapper      [kernel.vmlinux]         [k] leave_mm0.52%  df           [kernel.vmlinux]         [.] irq_return0.51%  df           [kernel.vmlinux]         [k] symcmp0.49%  head         [kernel.vmlinux]         [k] get_vmalloc_info0.46%  who          ld-2.17.so               [.] strcmp0.41%  who          [kernel.vmlinux]         [k] vma_interval_tree_insert0.41%  who          ld-2.17.so               [.] _dl_runtime_resolve_xsavec0.39%  head         ld-2.17.so               [.] _dl_relocate_object0.37%  sleep        [kernel.vmlinux]         [k] __do_page_fault0.35%  pgrep        [kernel.vmlinux]         [k] avtab_search_node0.35%  who          [kernel.vmlinux]         [k] lookup_slow0.34%  tail         [kernel.vmlinux]         [k] clear_page_c_e0.34%  df           [kernel.vmlinux]         [k] mm_release0.34%  df           libc-2.17.so             [.] __gconv_transform_utf8_internal0.33%  df           [kernel.vmlinux]         [k] retint_userspace_restore_args0.33%  bash         [kernel.vmlinux]         [k] release_pages0.33%  sleep        [kernel.vmlinux]         [k] idle_balance0.32%  who          [kernel.vmlinux]         [.] irq_return0.31%  who          ld-2.17.so               [.] _dl_fixup0.30%  swapper      [kernel.vmlinux]         [k] pick_next_task_fair0.30%  who          [kernel.vmlinux]         [k] system_call0.30%  df           [kernel.vmlinux]         [k] link_path_walk0.30%  who          [kernel.vmlinux]         [k] error_swapgs0.30%  df           [kernel.vmlinux]         [k] __wake_up_bit0.29%  swapper      [kernel.vmlinux]         [k] cpuidle_enter_state0.29%  bash         [kernel.vmlinux]         [k] vm_normal_page0.28%  tail         [kernel.vmlinux]         [k] error_swapgs0.26%  head         [kernel.vmlinux]         [k] put_dec_trunc80.26%  swapper      [kernel.vmlinux]         [k] int_sqrt0.26%  bash         [kernel.vmlinux]         [k] __mem_cgroup_uncharge_common0.25%  tail         [kernel.vmlinux]         [k] tlb_finish_mmu
这个特定的例子对在任何CPU上运行的任何程序以99赫兹采样30秒,然后显示最频繁采样的函数。
perf子命令如下所示:
annotate Read perf.data (created by perf record) and display annotated codearchive Create archive with object files with build-ids found in perf.data filebench General framework for benchmark suitesbuildid-cache Manage build-id cache.buildid-list List the buildids in a perf.data filec2c Shared Data C2C/HITM Analyzer.config Get and set variables in a configuration file.data Data file related processingdiff Read perf.data files and display the differential profileevlist List the event names in a perf.data fileftrace simple wrapper for kernel's ftrace functionalityinject Filter to augment the events stream with additional informationkallsyms Searches running kernel for symbolskmem Tool to trace/measure kernel memory propertieskvm Tool to trace/measure kvm guest oslist List all symbolic event typeslock Analyze lock eventsmem Profile memory accessesrecord Run a command and record its profile into perf.datareport Read perf.data (created by perf record) and display the profilesched Tool to trace/measure scheduler properties (latencies)script Read perf.data (created by perf record) and display trace outputstat Run a command and gather performance counter statisticstest Runs sanity tests.timechart Tool to visualize total system behavior during a workloadtop System profiling tool.probe Define new dynamic tracepointstrace strace inspired tool
下图显示了常用的perf子命令及其数据源和输出类型:
三、perf工作模式
perf_events提供三种工作模式:采样模式(sampling)、计数模式(counting)和 bpf programs。
perf record 命令工作在采样模式:周期性地做事件采样,将事件数据写入内核缓冲区,perf命令以缓慢的异步速率读取内核缓冲区以写入perf.data文件。然后,perf report或perf script命令读取此文件。
perf stat 命令工作在计数模式:仅仅统计内核上下文中的事件,其中计数的摘要由perf打印。此模式不会生成perf.data文件。
count只是记录了event的发生次数,sample记录了大量信息(比如:IP、ADDR、TID、TIME、CPU、BT)。
sample功能,需要给perf_event分配ringbuffer空间,并且把这部分空间通过mmap映射到用户空间。
bpf programs,这是Linux4.4+内核中的一个新功能,可以在内核空间中执行自定义用户定义的程序,可以执行有效的数据过滤和汇总。
这里先不讨论bpf programs on events。
尝试使用perf-stat命令开始计数事件,看看这是否足够。此子命令开销最小。
当使用带有perf记录的采样模式时,需要稍微注意开销,因为捕获文件可能会很快变成数百兆字节。这取决于正在跟踪的事件的速率:频率越高,开销越高,perf.data大小越大。
要真正减少开销并生成更高级的摘要,请编写由perf执行的BPF程序。
3.1 计数
计数就是统计某个event在一段时间里发生了多少次。
perf stat可以看到在这段时间里这些Hardware event发生的数目:
[root@localhost ~]# perf stat
^CPerformance counter stats for 'system wide':24378.291792      cpu-clock (msec)          #    3.999 CPUs utilized855      context-switches          #    0.035 K/sec93      cpu-migrations            #    0.004 K/sec10,465      page-faults               #    0.429 K/sec147,631,390      cycles                    #    0.006 GHz80,102,008      instructions              #    0.54  insn per cycle16,125,726      branches                  #    0.661 M/sec835,656      branch-misses             #    5.18% of all branches6.095605891 seconds time elapsed
可以加上"-e"参数,指定某一个event来看它的计数,比如page-faults,这里我们看到在当前CPU上,这个event在1秒钟内发生了177次:
-e, --event=Select the PMU event.
[root@localhost ~]# perf stat -e page-faults -- sleep 1Performance counter stats for 'sleep 1':177 page-faults1.001049846 seconds time elapsed
其它的计数事件:
# CPU counter statistics for the specified command:
perf stat command# Detailed CPU counter statistics (includes extras) for the specified command:
perf stat -d command# CPU counter statistics for the specified PID, until Ctrl-C:
perf stat -p PID# CPU counter statistics for the entire system, for 5 seconds:
perf stat -a sleep 5# Various basic CPU statistics, system wide, for 10 seconds:
perf stat -e cycles,instructions,cache-references,cache-misses,bus-cycles -a sleep 10# Various CPU level 1 data cache statistics for the specified command:
perf stat -e L1-dcache-loads,L1-dcache-load-misses,L1-dcache-stores command# Various CPU data TLB statistics for the specified command:
perf stat -e dTLB-loads,dTLB-load-misses,dTLB-prefetch-misses command# Various CPU last level cache statistics for the specified command:
perf stat -e LLC-loads,LLC-load-misses,LLC-stores,LLC-prefetches command# Using raw PMC counters, eg, counting unhalted core cycles:
perf stat -e r003c -a sleep 5 # PMCs: counting cycles and frontend stalls via raw specification:
perf stat -e cycles -e cpu/event=0x0e,umask=0x01,inv,cmask=0x01/ -a sleep 5# Count syscalls per-second system-wide:
perf stat -e raw_syscalls:sys_enter -I 1000 -a# Count system calls by type for the specified PID, until Ctrl-C:
perf stat -e 'syscalls:sys_enter_*' -p PID# Count system calls by type for the entire system, for 5 seconds:
perf stat -e 'syscalls:sys_enter_*' -a sleep 5# Count scheduler events for the specified PID, until Ctrl-C:
perf stat -e 'sched:*' -p PID# Count scheduler events for the specified PID, for 10 seconds:
perf stat -e 'sched:*' -p PID sleep 10# Count ext4 events for the entire system, for 10 seconds:
perf stat -e 'ext4:*' -a sleep 10# Count block device I/O events for the entire system, for 10 seconds:
perf stat -e 'block:*' -a sleep 10# Count all vmscan events, printing a report every second:
perf stat -e 'vmscan:*' -a -I 1000
3.2 采样
perf record 在不加 -e 指定event的时候,它缺省的event就是Hardware event cycles。我们先用 perf stat来查看1秒钟cycles事件的数量,在下面的例子里这个数量是1,385,279次。
[root@localhost ~]# perf stat -e cycles -- sleep 1Performance counter stats for 'sleep 1':1,385,279 cycles1.000915487 seconds time elapsed
如果每次cycles event发生的时候,我们都记录当时的IP(就是处理器当时要执行的指令地址)、IP所属的进程等信息的话,这样系统的开销就太大了。所以perf就使用了对event采样的方式来记录IP、进程等信息。
perf对event的采样有两种模式:
第一种是按照event的数目(period),比如每发生10000次cycles event就记录一次IP、进程等信息, perf record 中的 -c 参数可以指定每发生多少次,就做一次记录。
比如在下面的例子里,我们指定了每10000 cycles event做一次采样之后,在1秒里总共就做了59次采样,比我们之前看到1秒钟1,385,279次cycles的次数要少多了。
[root@localhost ~]# perf record  -e cycles -c 10000 -- sleep 1
[ perf record: Woken up 1 times to write data ]
[ perf record: Captured and wrote 0.019 MB perf.data (59 samples) ]
第二种是定义一个频率(frequency), perf record 中的 -F 参数就是指定频率的,比如 perf record -e cycles -F 99 – sleep 1 ,就是指采样每秒钟做99次。
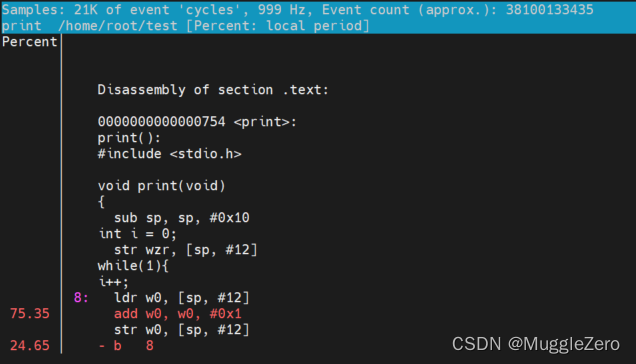
在 perf record 运行结束后,会在磁盘的当前目录留下perf.data这个文件,里面记录了所有采样得到的信息。然后我们再运行 perf report 命令,查看函数或者指令在这些采样里的分布比例。
其它的一些采样例子:
# Sample on-CPU functions for the specified command, at 99 Hertz:
perf record -F 99 command# Sample on-CPU functions for the specified PID, at 99 Hertz, until Ctrl-C:
perf record -F 99 -p PID# Sample on-CPU functions for the specified PID, at 99 Hertz, for 10 seconds:
perf record -F 99 -p PID sleep 10# Sample CPU stack traces (via frame pointers) for the specified PID, at 99 Hertz, for 10 seconds:
perf record -F 99 -p PID -g -- sleep 10# Sample CPU stack traces for the PID, using dwarf (dbg info) to unwind stacks, at 99 Hertz, for 10 seconds:
perf record -F 99 -p PID --call-graph dwarf sleep 10# Sample CPU stack traces for the entire system, at 99 Hertz, for 10 seconds (< Linux 4.11):
perf record -F 99 -ag -- sleep 10# Sample CPU stack traces for the entire system, at 99 Hertz, for 10 seconds (>= Linux 4.11):
perf record -F 99 -g -- sleep 10# If the previous command didn't work, try forcing perf to use the cpu-clock event:
perf record -F 99 -e cpu-clock -ag -- sleep 10# Sample CPU stack traces for a container identified by its /sys/fs/cgroup/perf_event cgroup:
perf record -F 99 -e cpu-clock --cgroup=docker/1d567f4393190204...etc... -a -- sleep 10# Sample CPU stack traces for the entire system, with dwarf stacks, at 99 Hertz, for 10 seconds:
perf record -F 99 -a --call-graph dwarf sleep 10# Sample CPU stack traces for the entire system, using last branch record for stacks, ... (>= Linux 4.?):
perf record -F 99 -a --call-graph lbr sleep 10# Sample CPU stack traces, once every 10,000 Level 1 data cache misses, for 5 seconds:
perf record -e L1-dcache-load-misses -c 10000 -ag -- sleep 5# Sample CPU stack traces, once every 100 last level cache misses, for 5 seconds:
perf record -e LLC-load-misses -c 100 -ag -- sleep 5 # Sample on-CPU kernel instructions, for 5 seconds:
perf record -e cycles:k -a -- sleep 5 # Sample on-CPU user instructions, for 5 seconds:
perf record -e cycles:u -a -- sleep 5 # Sample on-CPU user instructions precisely (using PEBS), for 5 seconds:
perf record -e cycles:up -a -- sleep 5 # Perform branch tracing (needs HW support), for 1 second:
perf record -b -a sleep 1# Sample CPUs at 49 Hertz, and show top addresses and symbols, live (no perf.data file):
perf top -F 49# Sample CPUs at 49 Hertz, and show top process names and segments, live:
perf top -F 49 -ns comm,dso
参考资料
https://www.brendangregg.com/perf.html
https://perf.wiki.kernel.org/index.php/Main_Page
https://www.cnblogs.com/arnoldlu/p/6241297.html
Systems.Performance.Enterprise.and.the.Cloud.2nd.Edition.2020.12


![[JavaScript] 理解 e.clientX,e.clientY e.pageX e.pageY e.offsetX e.offsetY](https://img-blog.csdnimg.cn/20200917224556661.png?x-oss-process=image/watermark,type_ZmFuZ3poZW5naGVpdGk,shadow_10,text_aHR0cHM6Ly9ibG9nLmNzZG4ubmV0L3FxXzQzNTQwMjE5,size_16,color_FFFFFF,t_70#pic_center)