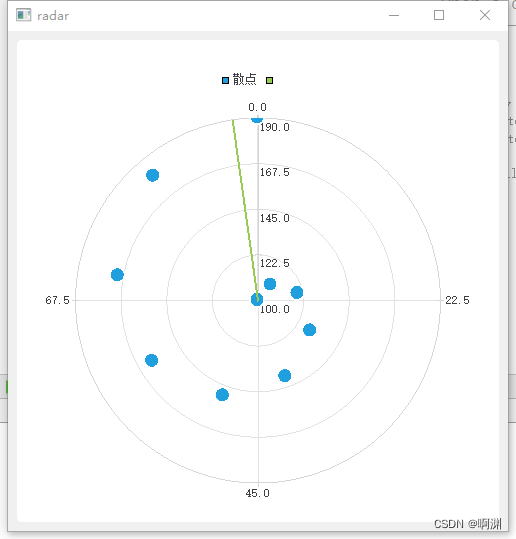
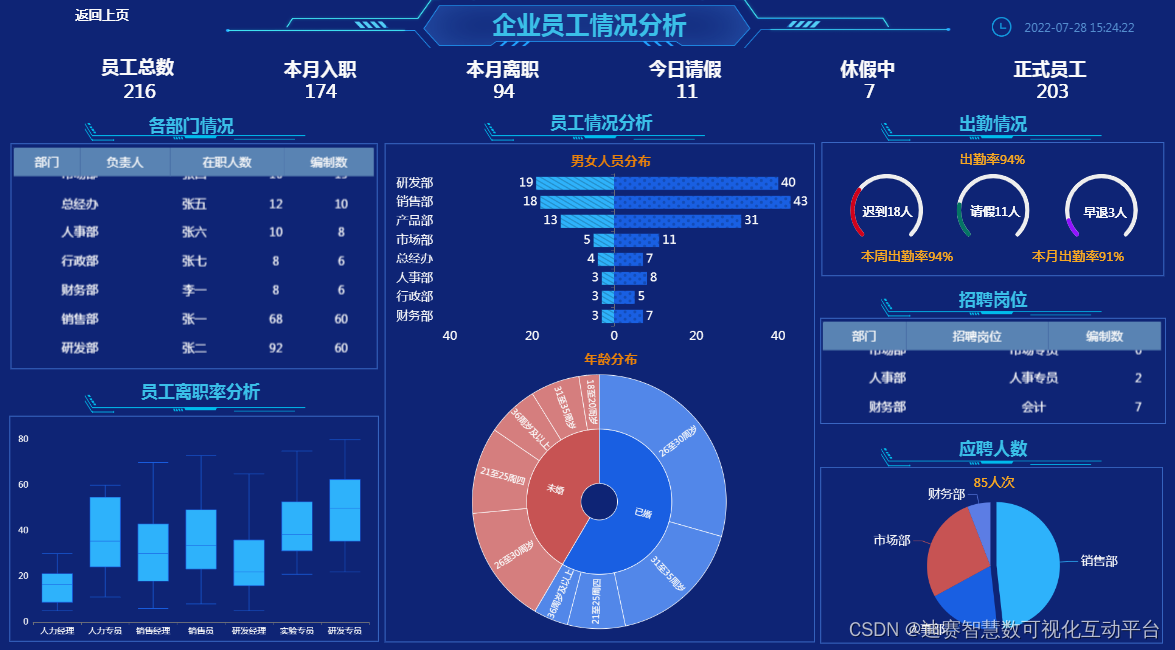
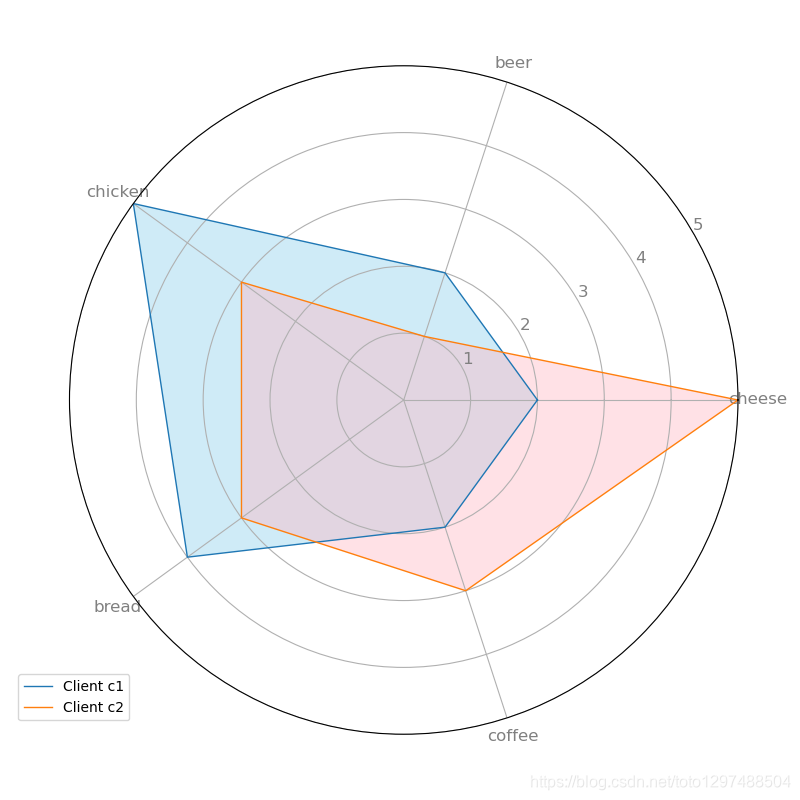
效果图
源代码
<!DOCTYPE html>
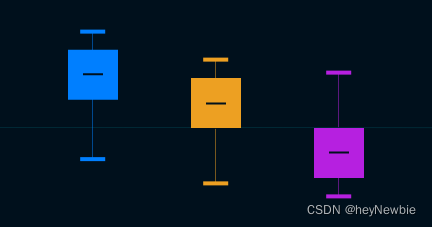
<html><head><meta charset="utf-8"><title>ECharts</title><!-- 引入 echarts.js --><script src="js/echarts.min.js"></script><script src="dist/extension/dataTool.js"></script></head><body><!-- 为ECharts准备一个具备大小(宽高)的Dom --><div id="main" style="width: 600px;height:400px;"></div><script type="text/javascript">// 基于准备好的dom,初始化echarts实例var myChart = echarts.init(document.getElementById('main'));var option;var data = echarts.dataTool.prepareBoxplotData([[850, 740, 900, 1070, 930, 850, 950, 980, 980, 880, 1000, 980, 930, 650, 760, 810, 1000, 1000, 960, 960],[960, 940, 960, 940, 880, 800, 850, 880, 900, 840, 830, 790, 810, 880, 880, 830, 800, 790, 760, 800],[880, 880, 880, 860, 720, 720, 620, 860, 970, 950, 880, 910, 850, 870, 840, 840, 850, 840, 840, 840],[890, 810, 810, 820, 800, 770, 760, 740, 750, 760, 910, 920, 890, 860, 880, 720, 840, 850, 850, 780],[890, 840, 780, 810, 760, 810, 790, 810, 820, 850, 870, 870, 810, 740, 810, 940, 950, 800, 810, 870]]);option = {title: [{text: 'Michelson-Morley Experiment',left: 'center',},{text: 'upper: Q3 + 1.5 * IQR \nlower: Q1 - 1.5 * IQR',borderColor: '#999',borderWidth: 1,textStyle: {fontSize: 14},left: '10%',top: '90%'}],tooltip: {trigger: 'item',axisPointer: {type: 'shadow'}},grid: {left: '10%',right: '10%',bottom: '15%'},xAxis: {type: 'category',data: data.axisData,boundaryGap: true,nameGap: 30,splitArea: {show: false},axisLabel: {formatter: 'expr {value}'},splitLine: {show: false}},yAxis: {type: 'value',name: 'km/s minus 299,000',splitArea: {show: true}},series: [{name: 'boxplot',type: 'boxplot',data: data.boxData,tooltip: {formatter: function(param) {return ['Experiment ' + param.name + ': ','upper: ' + param.data[5],'Q3: ' + param.data[4],'median: ' + param.data[3],'Q1: ' + param.data[2],'lower: ' + param.data[1]].join('<br/>');}}},{name: 'outlier',type: 'scatter',data: data.outliers}]};myChart.setOption(option);</script></body></html>








](https://img-blog.csdnimg.cn/b7d5f168deff4064a604be2dfbb5d4fb.gif#pic_center)
