目录
创建盒须图类
设置盒须图数据
计算中间值
源代码
widget.cpp
实现效果如下:
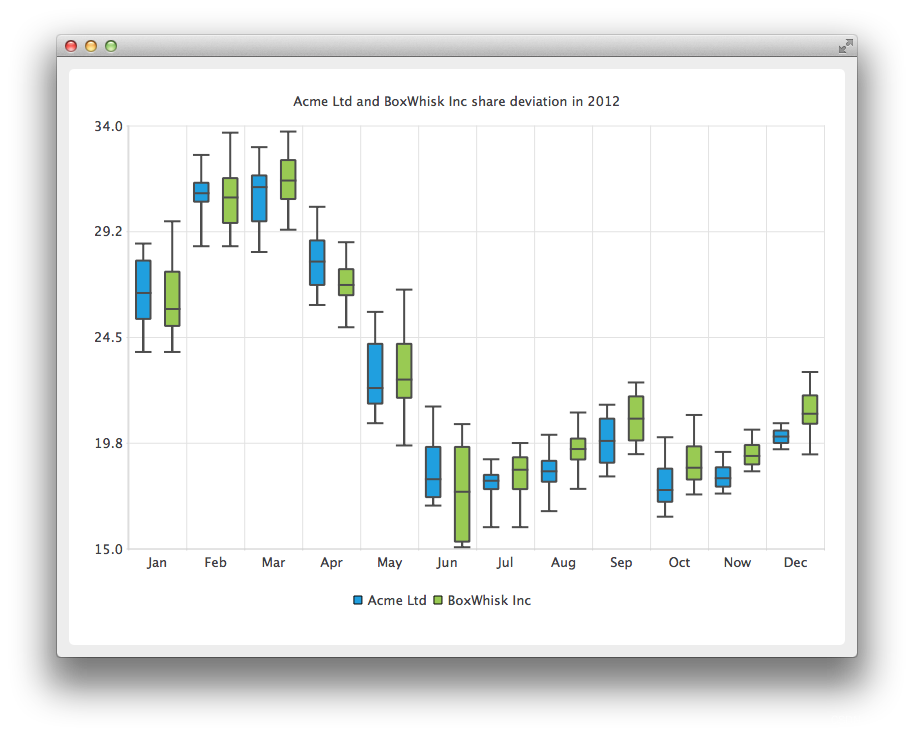
QBoxPlotSeries类以方框和胡须图表的形式显示数据。
“长方体绘图”系列充当长方体和胡须项目的容器。多个系列中的项目根据其索引值分组。
QBarCategoryAxis类用于将类别添加到图表的轴。类别标签必须是唯一的。如果为多个长方体和胡须项目定义了相同的类别标签,则只绘制第一个类别标签。
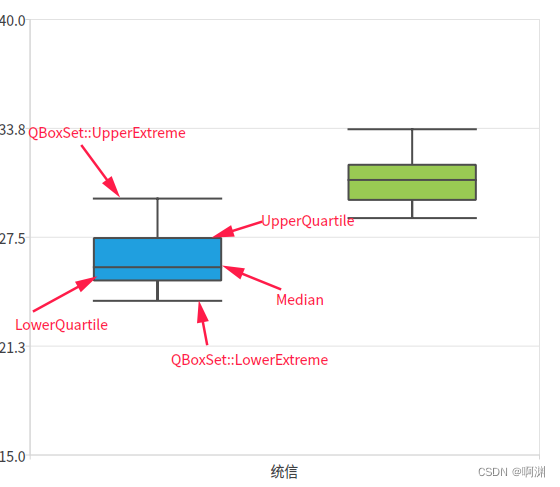
盒须图最主要设置为QBarSet的设置,详细信息如下表:
| QBoxSet::LowerExtreme | 0 | 盒须图最小值 |
| QBoxSet::LowerQuartile | 1 | 盒须图中间部分的最小值 |
| QBoxSet::Median | 2 | 盒须图中间值 |
| QBoxSet::UpperQuartile | 3 | 盒须图中间部分的最大值 |
| QBoxSet::UpperExtreme | 4 | 盒须图最大值 |
如下图:
创建盒须图类
通过new创建两个盒须图类,可以通过setname设置其名字.
m_ptrBoxPlotSeries(new QBoxPlotSeries)m_ptrBoxPlotSeries2(new QBoxPlotSeries) m_ptrBoxPlotSeries->setName("统信");m_ptrBoxPlotSeries2->setName("麒麟");设置盒须图数据
数据设置使用QBarSet进行设置.
因为QBarSet的设置有大小之分,所以我们可以使用qSort对数据进行排序.
那么最小值为listData.first().最大值为listData.last().
中间值为listData的中间值.
QList<qreal> listData;listData << 25.74 << 25.28 << 25.86 << 26.05 << 26.64 << 28.47 << 28.30<< 29.22 << 29.72 << 27.50 << 25.62 << 25.50 << 25.15 << 26.47<< 27.41 << 25.78 << 24.82 << 24.89 << 24.88 << 24.60 << 23.85;qSort(listData.begin(), listData.end());QBoxSet *box = new QBoxSet("统信");int count = listData.count();box->setValue(QBoxSet::LowerExtreme, listData.first());box->setValue(QBoxSet::UpperExtreme, listData.last());box->setValue(QBoxSet::Median, findMedian(listData, 0, count));box->setValue(QBoxSet::LowerQuartile, findMedian(listData, 0, count / 2));box->setValue(QBoxSet::UpperQuartile,findMedian(listData, count / 2 + (count % 2), count));m_ptrBoxPlotSeries->append(box);计算中间值
传入列表数据,将计算,起点和终点之间的中间值.如果%2 为1那么说明起为单数,可以使用二分之一总数+起始位置.
如果是双数,计算左右值的和除以2.
qreal Widget::findMedian(QList<qreal> sortedList, int begin, int end)
{//! [5]int count = end - begin;if (count % 2) {return sortedList.at(count / 2 + begin);} else {qreal right = sortedList.at(count / 2 + begin);qreal left = sortedList.at(count / 2 - 1 + begin);return (right + left) / 2.0;}//! [5]
}
源代码
源代码地址git地址
QtChartDemo/QBoxPlotSeries/BoxPlotSeries · master · 啊渊 / QT博客案例 · GitCode
源代码
widget.cpp
#include "widget.h"
#include <QtDebug>
#include <QLegendMarker>
#include <QBarLegendMarker>
Widget::Widget(QWidget *parent): QWidget(parent), m_ptrChart(new QChart), m_ptrChartview(new QChartView(m_ptrChart, this)), m_ptrBoxPlotSeries(new QBoxPlotSeries), m_ptrBoxPlotSeries2(new QBoxPlotSeries)
{initUI();initConnect();
}
void Widget::initUI()
{setWindowTitle(tr("盒须图样例"));m_ptrChart->setMinimumSize(500, 500);m_ptrChart->setTitle("盒须图样例");initData();m_ptrChart->createDefaultAxes();m_ptrChart->axes(Qt::Vertical).first()->setMin(15.0);m_ptrChart->axes(Qt::Vertical).first()->setMax(40.0);m_ptrChart->setAnimationOptions(QChart::AllAnimations);m_ptrChartview->setFixedSize(600, 600);m_ptrChartview->setRenderHint(QPainter::Antialiasing);
}void Widget::initConnect()
{foreach (auto marker, m_ptrChart->legend()->markers()) {QObject::disconnect(marker, &QLegendMarker::clicked, this,&Widget::handleMarkerClicked);QObject::connect(marker, &QLegendMarker::clicked, this,&Widget::handleMarkerClicked);}
}
void Widget::handleMarkerClicked()
{QLegendMarker *marker = qobject_cast<QLegendMarker *>(sender());//断言Q_ASSERT(marker);switch (marker->type()) {case QLegendMarker::LegendMarkerTypeBoxPlot: {//控序列隐藏/显示// Toggle visibility of seriesmarker->series()->setVisible(!marker->series()->isVisible());// Turn legend marker back to visible, since hiding series also// hides the marker and we don't want it to happen now.marker->setVisible(true);//修改图例// Dim the marker, if series is not visibleqreal alpha = 1.0;if (!marker->series()->isVisible()) alpha = 0.5;QColor color;QBrush brush = marker->labelBrush();color = brush.color();color.setAlphaF(alpha);brush.setColor(color);marker->setLabelBrush(brush);brush = marker->brush();color = brush.color();color.setAlphaF(alpha);brush.setColor(color);marker->setBrush(brush);QPen pen = marker->pen();color = pen.color();color.setAlphaF(alpha);pen.setColor(color);marker->setPen(pen);break;}default: {qInfo() << "Unknown marker type";break;}}
}
void Widget::initData()
{QList<qreal> listData;listData << 25.74 << 25.28 << 25.86 << 26.05 << 26.64 << 28.47 << 28.30<< 29.22 << 29.72 << 27.50 << 25.62 << 25.50 << 25.15 << 26.47<< 27.41 << 25.78 << 24.82 << 24.89 << 24.88 << 24.60 << 23.85;qSort(listData.begin(), listData.end());QBoxSet *box = new QBoxSet("统信");int count = listData.count();box->setValue(QBoxSet::LowerExtreme, listData.first());box->setValue(QBoxSet::UpperExtreme, listData.last());box->setValue(QBoxSet::Median, findMedian(listData, 0, count));box->setValue(QBoxSet::LowerQuartile, findMedian(listData, 0, count / 2));box->setValue(QBoxSet::UpperQuartile,findMedian(listData, count / 2 + (count % 2), count));m_ptrBoxPlotSeries->append(box);listData.clear();qInfo() << listData;listData << 30.79 << 29.62 << 29.67 << 30.37 << 30.16 << 30.22 << 31.02<< 33.70 << 32.60 << 32.24 << 31.98 << 31.79 << 31.10 << 30.79<< 31.53 << 30.92 << 29.00 << 29.58 << 30.37 << 29.40 << 28.60;qSort(listData.begin(), listData.end());QBoxSet *box2 = new QBoxSet("麒麟");count = listData.count();qInfo() << findMedian(listData, 0, count);qInfo() << findMedian(listData, 0, count / 2);qInfo() << findMedian(listData, count / 2 + (count % 2), count);box2->setValue(QBoxSet::LowerExtreme, listData.first());box2->setValue(QBoxSet::UpperExtreme, listData.last());box2->setValue(QBoxSet::Median, findMedian(listData, 0, count));box2->setValue(QBoxSet::LowerQuartile, findMedian(listData, 0, count / 2));box2->setValue(QBoxSet::UpperQuartile,findMedian(listData, count / 2 + (count % 2), count));m_ptrBoxPlotSeries2->append(box2);m_ptrBoxPlotSeries->setName("统信");m_ptrBoxPlotSeries2->setName("麒麟");m_ptrChart->addSeries(m_ptrBoxPlotSeries);m_ptrChart->addSeries(m_ptrBoxPlotSeries2);
}
qreal Widget::findMedian(QList<qreal> sortedList, int begin, int end)
{//! [5]int count = end - begin;if (count % 2) {return sortedList.at(count / 2 + begin);} else {qreal right = sortedList.at(count / 2 + begin);qreal left = sortedList.at(count / 2 - 1 + begin);return (right + left) / 2.0;}//! [5]
}
Widget::~Widget() {}
widget.h
#ifndef WIDGET_H
#define WIDGET_H#include <QWidget>
#include <QChart>
#include <QChartView>
#include <QBoxPlotSeries>
#include <QBoxSet>
QT_CHARTS_USE_NAMESPACE
class Widget : public QWidget {Q_OBJECTpublic:Widget(QWidget *parent = 0);~Widget();void initUI();void initConnect();void initData();qreal findMedian(QList<qreal> sortedList, int begin, int end);public slots:void handleMarkerClicked();private:QChart *m_ptrChart;QChartView *m_ptrChartview;QBoxPlotSeries *m_ptrBoxPlotSeries;QBoxPlotSeries *m_ptrBoxPlotSeries2;
};#endif  // WIDGET_H


](https://img-blog.csdnimg.cn/b7d5f168deff4064a604be2dfbb5d4fb.gif#pic_center)