提示:文章写完后,目录可以自动生成,如何生成可参考右边的帮助文档
目录
环境
一、前期准备:
1.下载ELK+MetircBeat rpm包
2.CentOS 设置
二、安装Elasticsearch
1.安装rpm
2.配置Elasticsearch
修改配置档
开防火墙
设置账号
开启Elasticsearch
2.验证Elasticsearch
三、安装Kibana
1.安装rpm
2.配置
启动Kibana
无浏览器操作
3.初始化Kibana
4.加载样例数据
四、安装MetricBeat
1.官方流程
2.安装RPM
3.配置
4.启动MetricBeat
五、遇到过的问题
1.Kibana
取token报错
Kibana Server is not ready yet and Unable to retrieve version information from Elasticsearch nodes. self signed certificate in certificate chain
2.MetricBeat
配置ssl.ca_trusted_fingerprint问题 Exiting: couldn't connect to any of the configured Elasticsearch hosts. Errors: [error connecting to Elasticsearch at https://192.168.50.101:9200: Get "https://192.168.50.101:9200": decode 'ca_trusted_fingerprint': encoding/hex: invalid byte: U+003A ':']
总结
环境
Hyper-V + CentOS 7.9
系统:CentOS 7.9
下载URL:CentOS Mirrors List
虚拟机:Hyper-V
开启方式:开始菜单->启用或关闭Windows功能->Hyper-V
如果无法开启需要根据CPU修改BIOS

一、前期准备:
1.下载ELK+MetircBeat rpm包
注意:版本一定要一致,否则平添烦恼
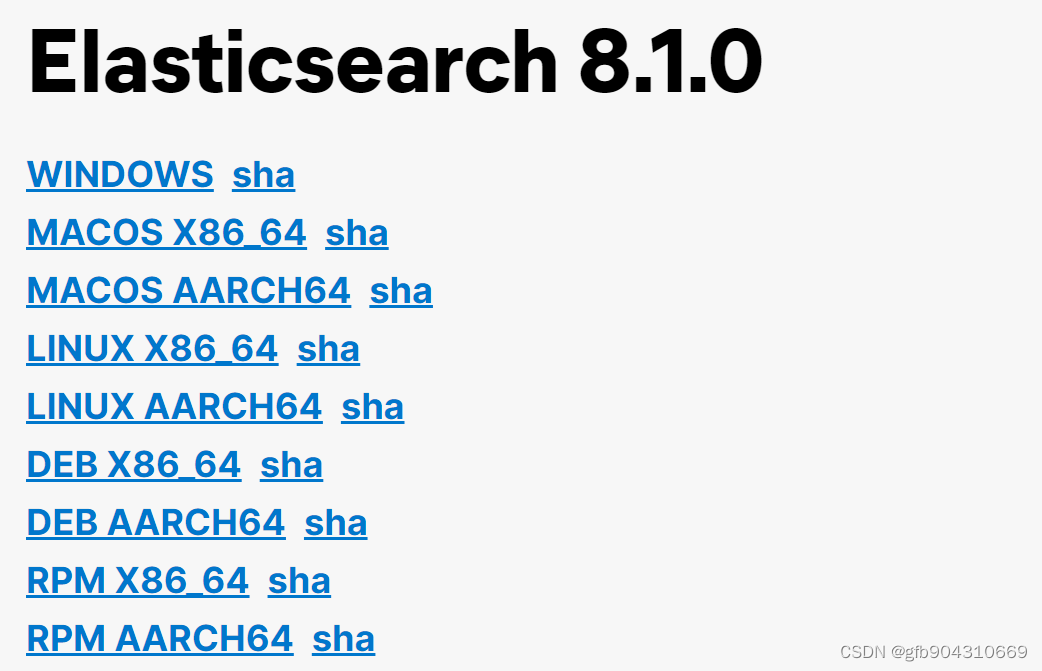
ElasticSearch:Elasticsearch 8.1.0 | Elastic![]() https://www.elastic.co/cn/downloads/past-releases/elasticsearch-8-1-0
https://www.elastic.co/cn/downloads/past-releases/elasticsearch-8-1-0
Kibana:Kibana 8.1.0 | Elastic![]() https://www.elastic.co/cn/downloads/past-releases/kibana-8-1-0
https://www.elastic.co/cn/downloads/past-releases/kibana-8-1-0
Logstash:Logstash 8.1.0 | Elastic![]() https://www.elastic.co/cn/downloads/past-releases/logstash-8-1-0
https://www.elastic.co/cn/downloads/past-releases/logstash-8-1-0
FileBeat:Filebeat 8.1.0 | Elastic![]() https://www.elastic.co/cn/downloads/past-releases/filebeat-8-1-0
https://www.elastic.co/cn/downloads/past-releases/filebeat-8-1-0
MetricBeat:Metricbeat 8.1.0 | Elastic![]() https://www.elastic.co/cn/downloads/past-releases/metricbeat-8-1-0选择RPM X86_64,下载后把安装包拷到机器里
https://www.elastic.co/cn/downloads/past-releases/metricbeat-8-1-0选择RPM X86_64,下载后把安装包拷到机器里
2.CentOS 设置
vi /etc/sysctl.conf在末尾加上
vm.max_map_count=262144二、安装Elasticsearch
1.安装rpm
rpm -ivh elasticsearch-8.1.0-x86_64.rpm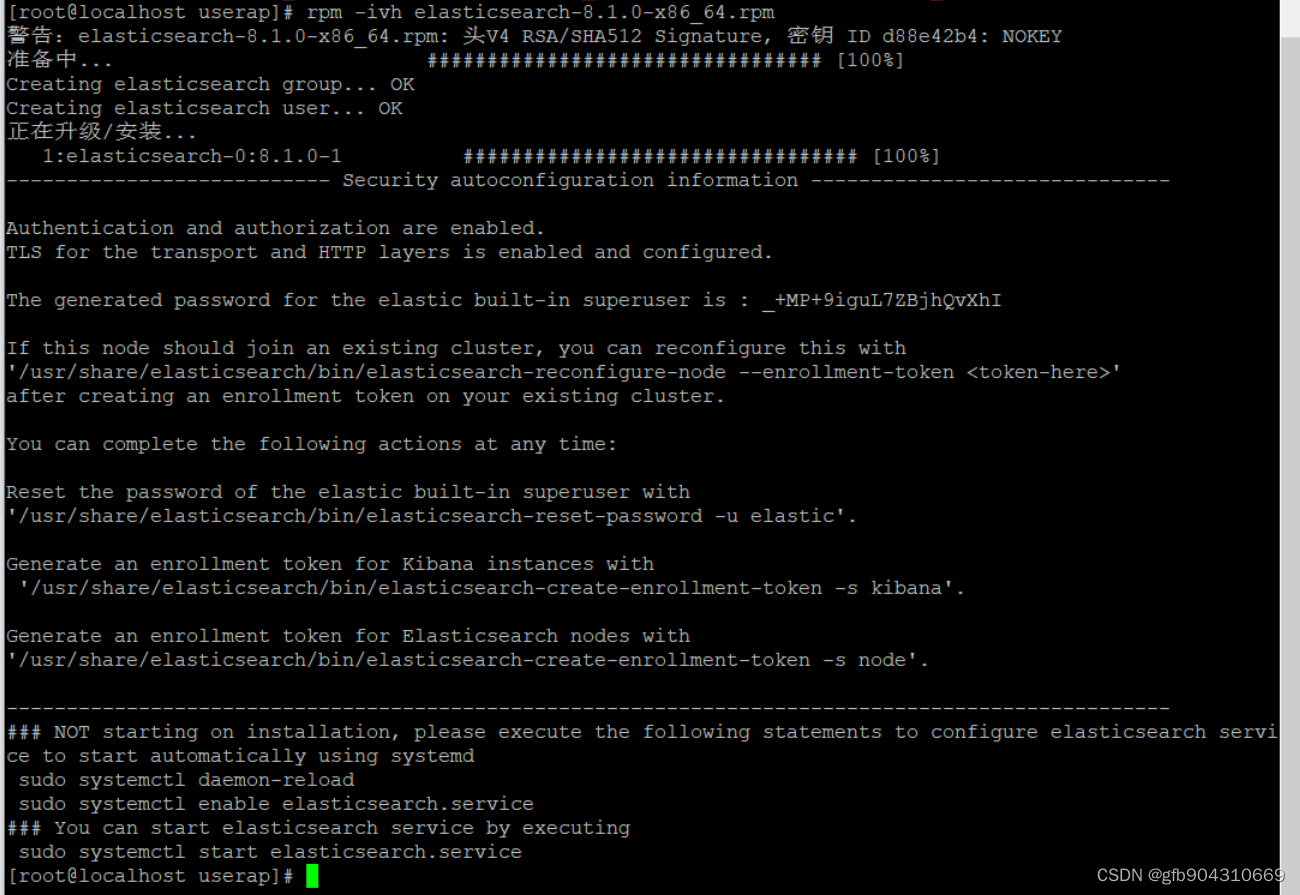
安装完成,执行命令:
systemctl enable elasticsearch #设为开机启动
2.配置Elasticsearch
修改配置档
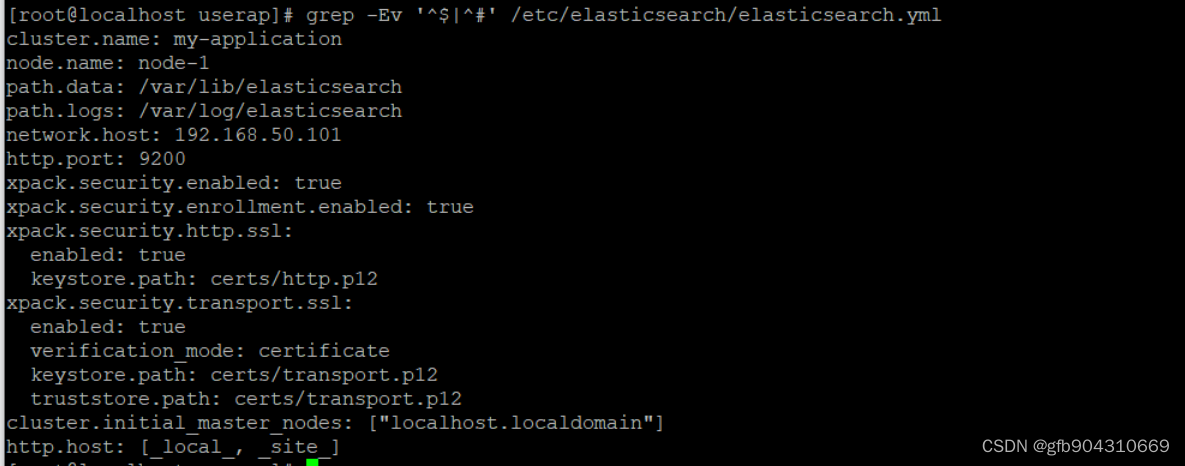
vi /etc/elasticsearch/elasticsearch.yml需要修改的内容:
# 集群名,17行
cluster.name: my-es
# node名,23行
node.name: node-1
# 数据目录,33行
path.data: /root/data/elasticsearch/data
# 日志目录,37行
path.logs: /var/log/elasticsearch
# 配置IP,55行
network.host: 192.168.50.101
# 配置站点端口,59行
http.port: 9200
标准如下
开防火墙
9200、9300是es server;5601是kibana
firewall-cmd --permanent --add-port={9200/tcp,9300/tcp,5601/tcp}
firewall-cmd --reload
效果:

设置账号
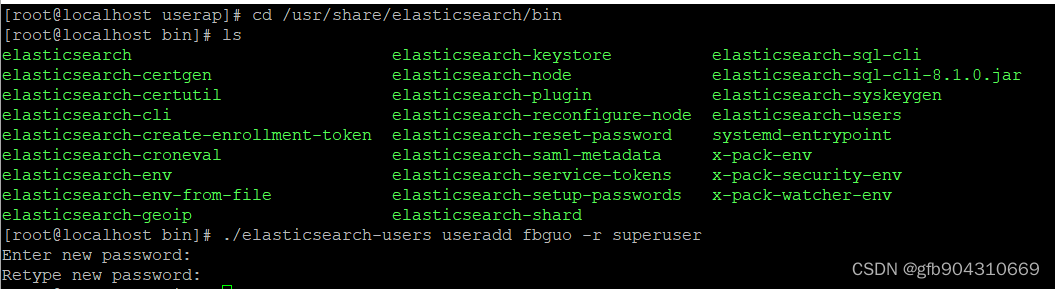
cd /usr/share/elasticsearch/bin
./elasticsearch-users useradd fbguo -r superuser
然后输入两次密码,效果:
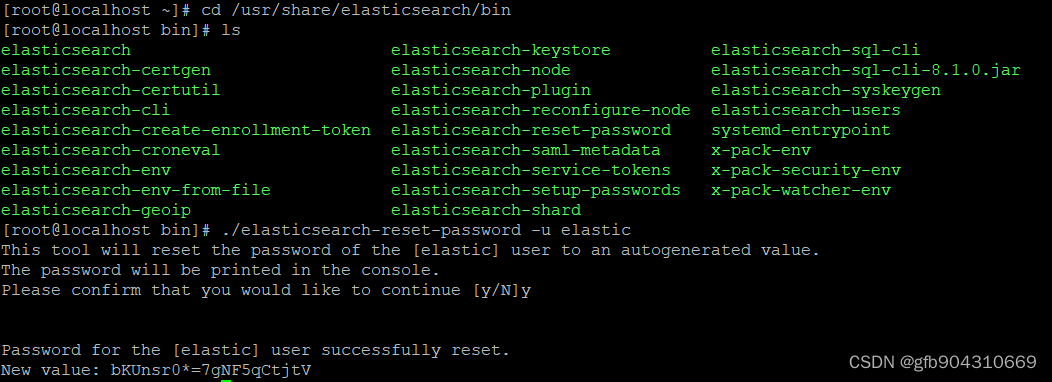
重置elastic(内置超级用户账号)
./elasticsearch-reset-password -u elastic效果
开启Elasticsearch
systemctl start elasticsearch
2.验证Elasticsearch
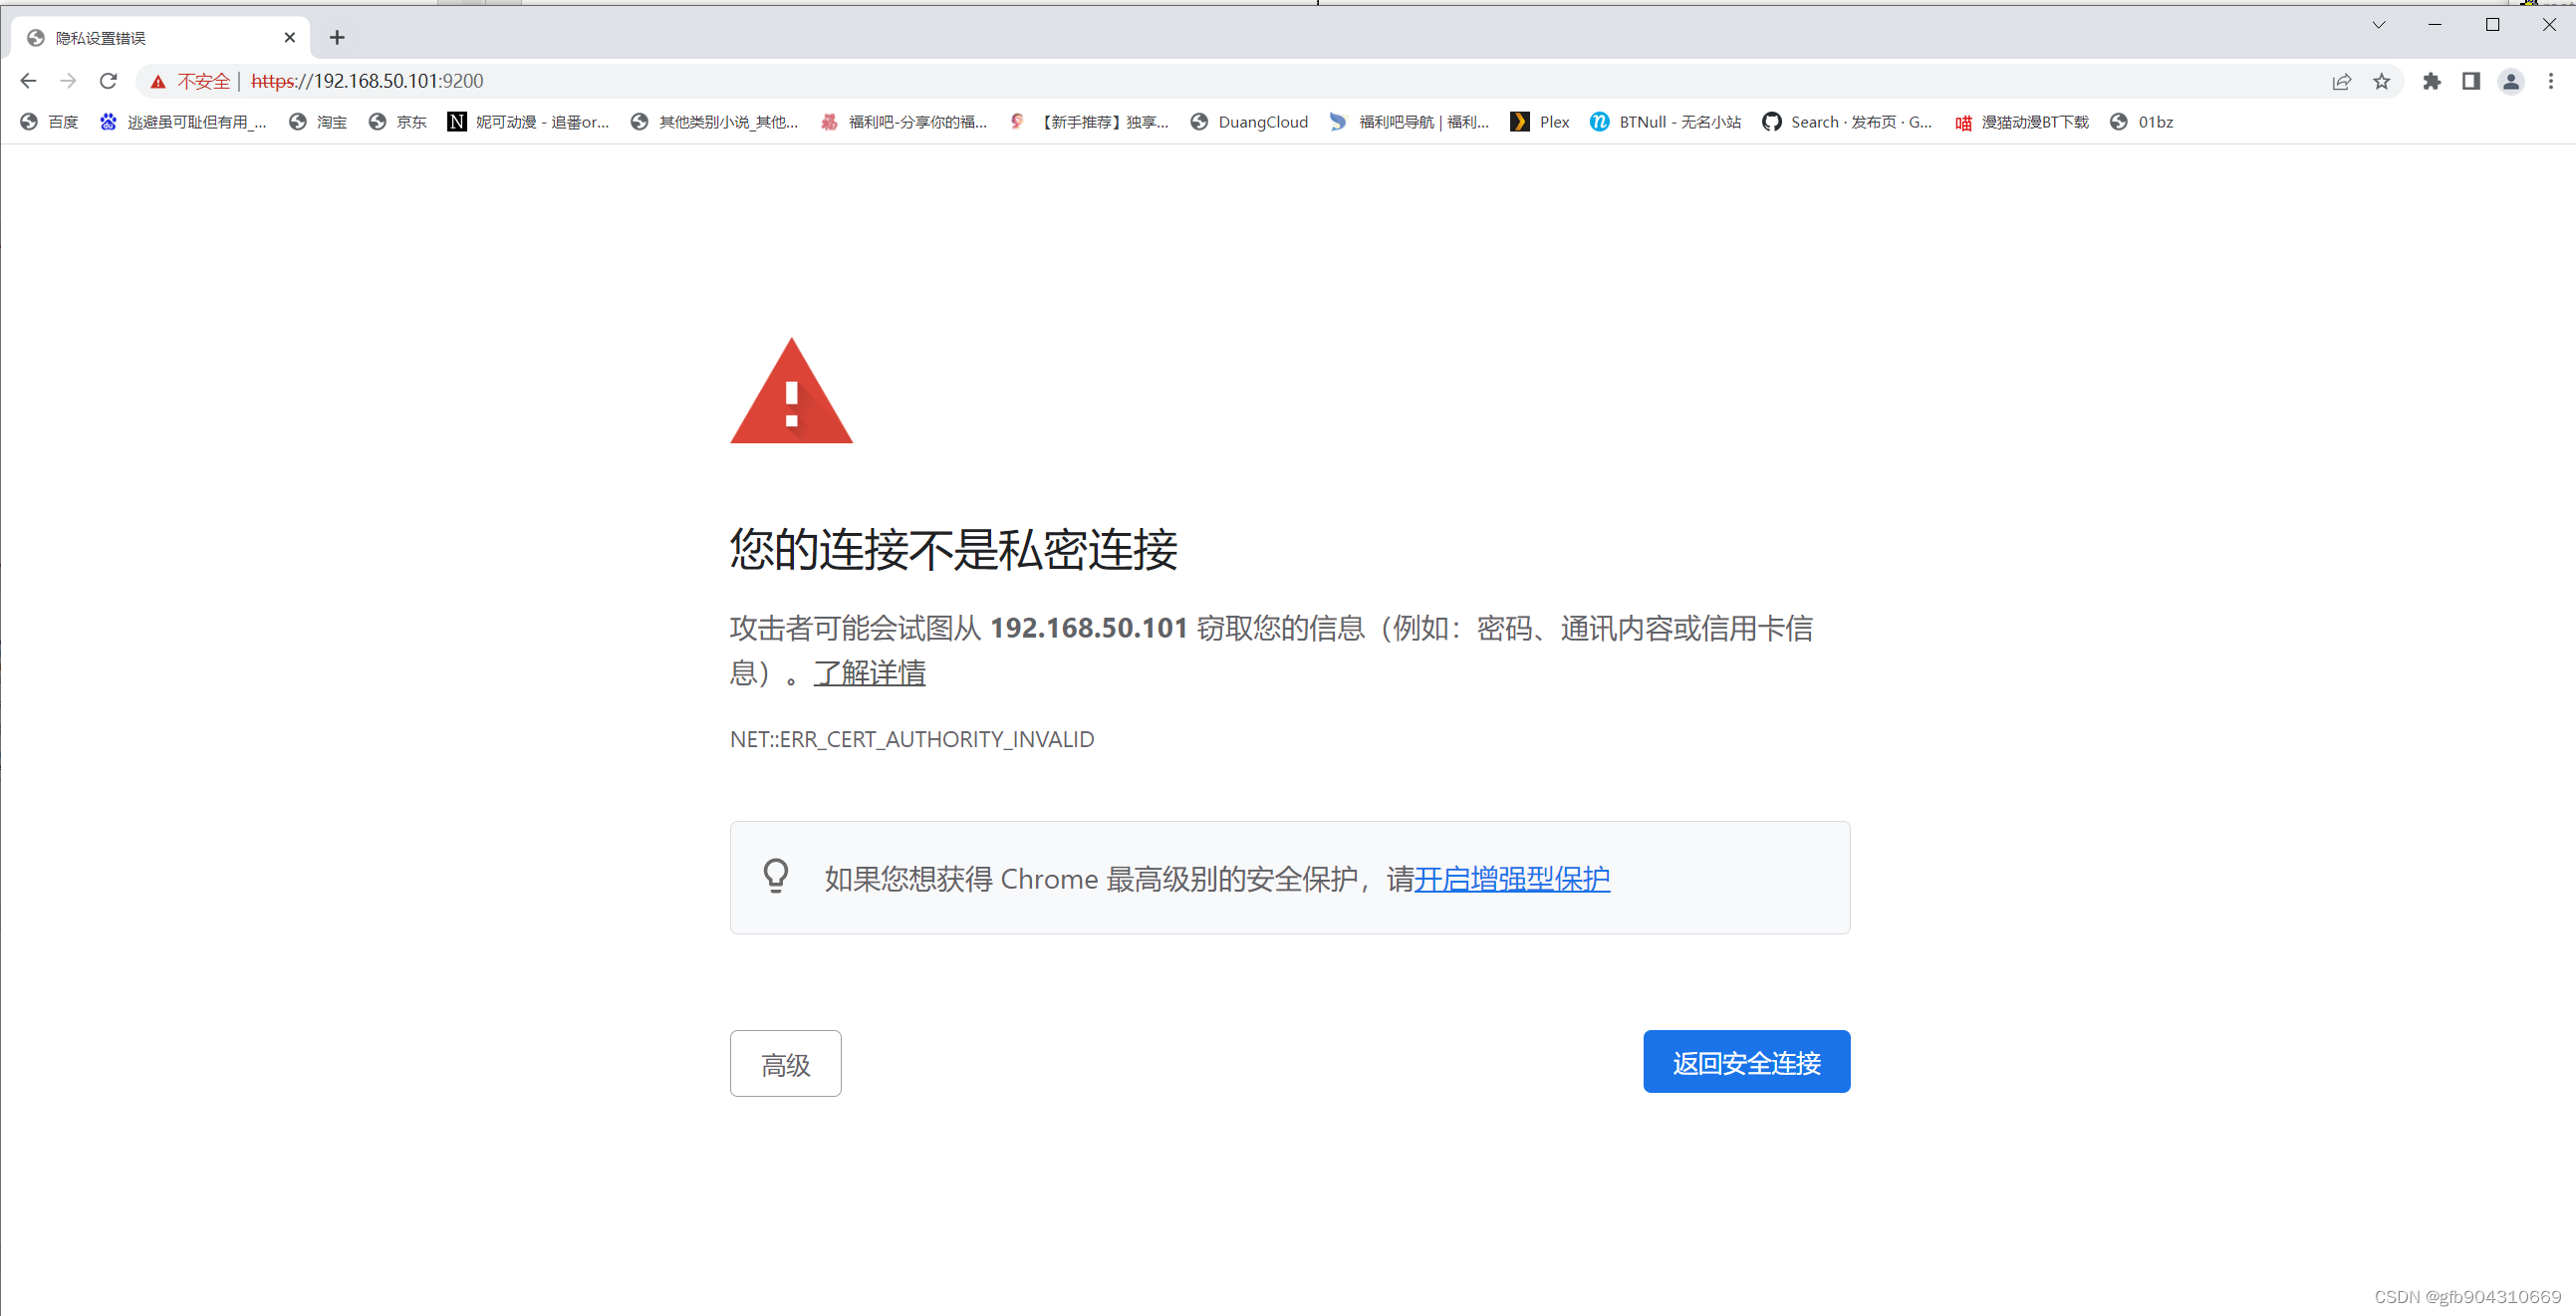
访问https://192.168.50.101:9200 注意是https
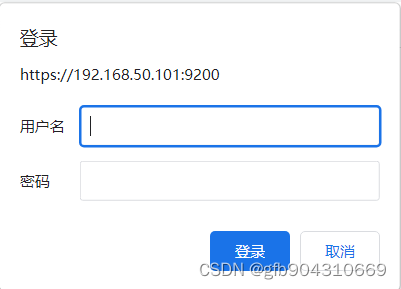
 提示登录,使用刚刚创建的账号
成功
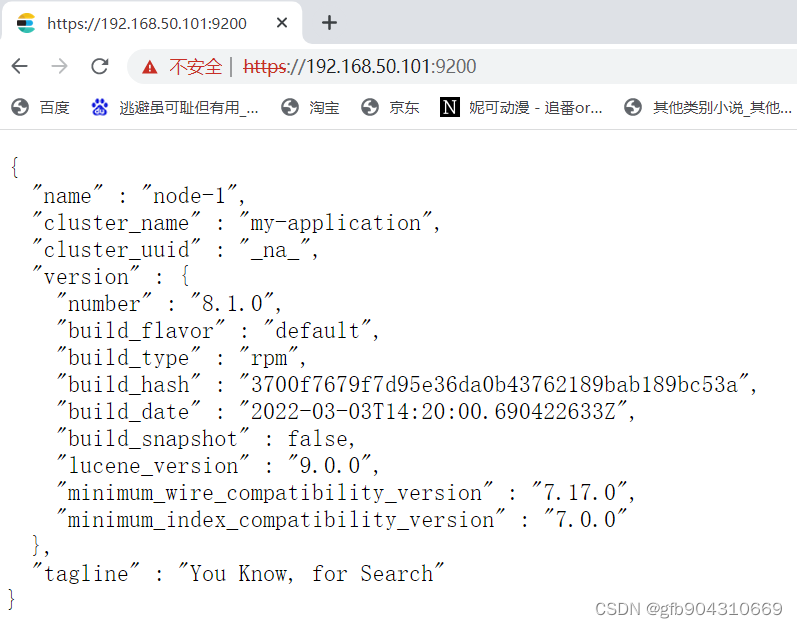
此时建议使用Hyper-V 设置检查点,以免之后操作错了不能roll-back
三、安装Kibana
1.安装rpm
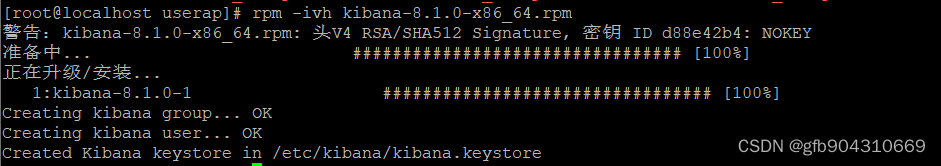
rpm -ivh kibana-8.1.0-x86_64.rpm
效果:
设置开机启动
systemctl enable kibana.service
2.配置
启动Kibana
systemctl start kibana.service查看状态
systemctl status kibana.service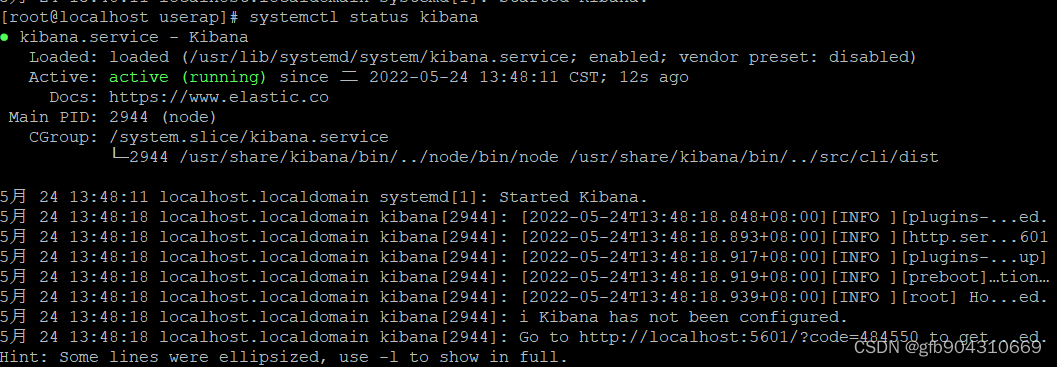
如果有浏览器的机器可以按上图所说直接访问提供的网页进行初始化
本机是:http://localhost:5601/?code=484550
没有浏览器的执行下面的步骤
无浏览器操作
关闭kibana
systemctl stop kibana.service修改配置档
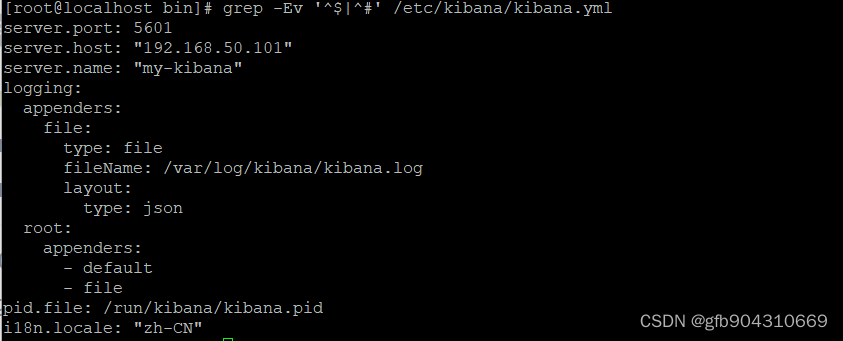
vi /etc/kibana/kibana.yml需要修改的内容:
# 站点端口号
server.port: 5601
# 站点IP地址
server.host: "192.168.50.101“
#节点名
server.name: "my-kibana"
# 语言显示为中文
i18n.locale: "zh-CN“
效果图:
开启kibana
systemctl start kibana.service3.初始化Kibana
浏览器访问http://192.168.50.101:5601
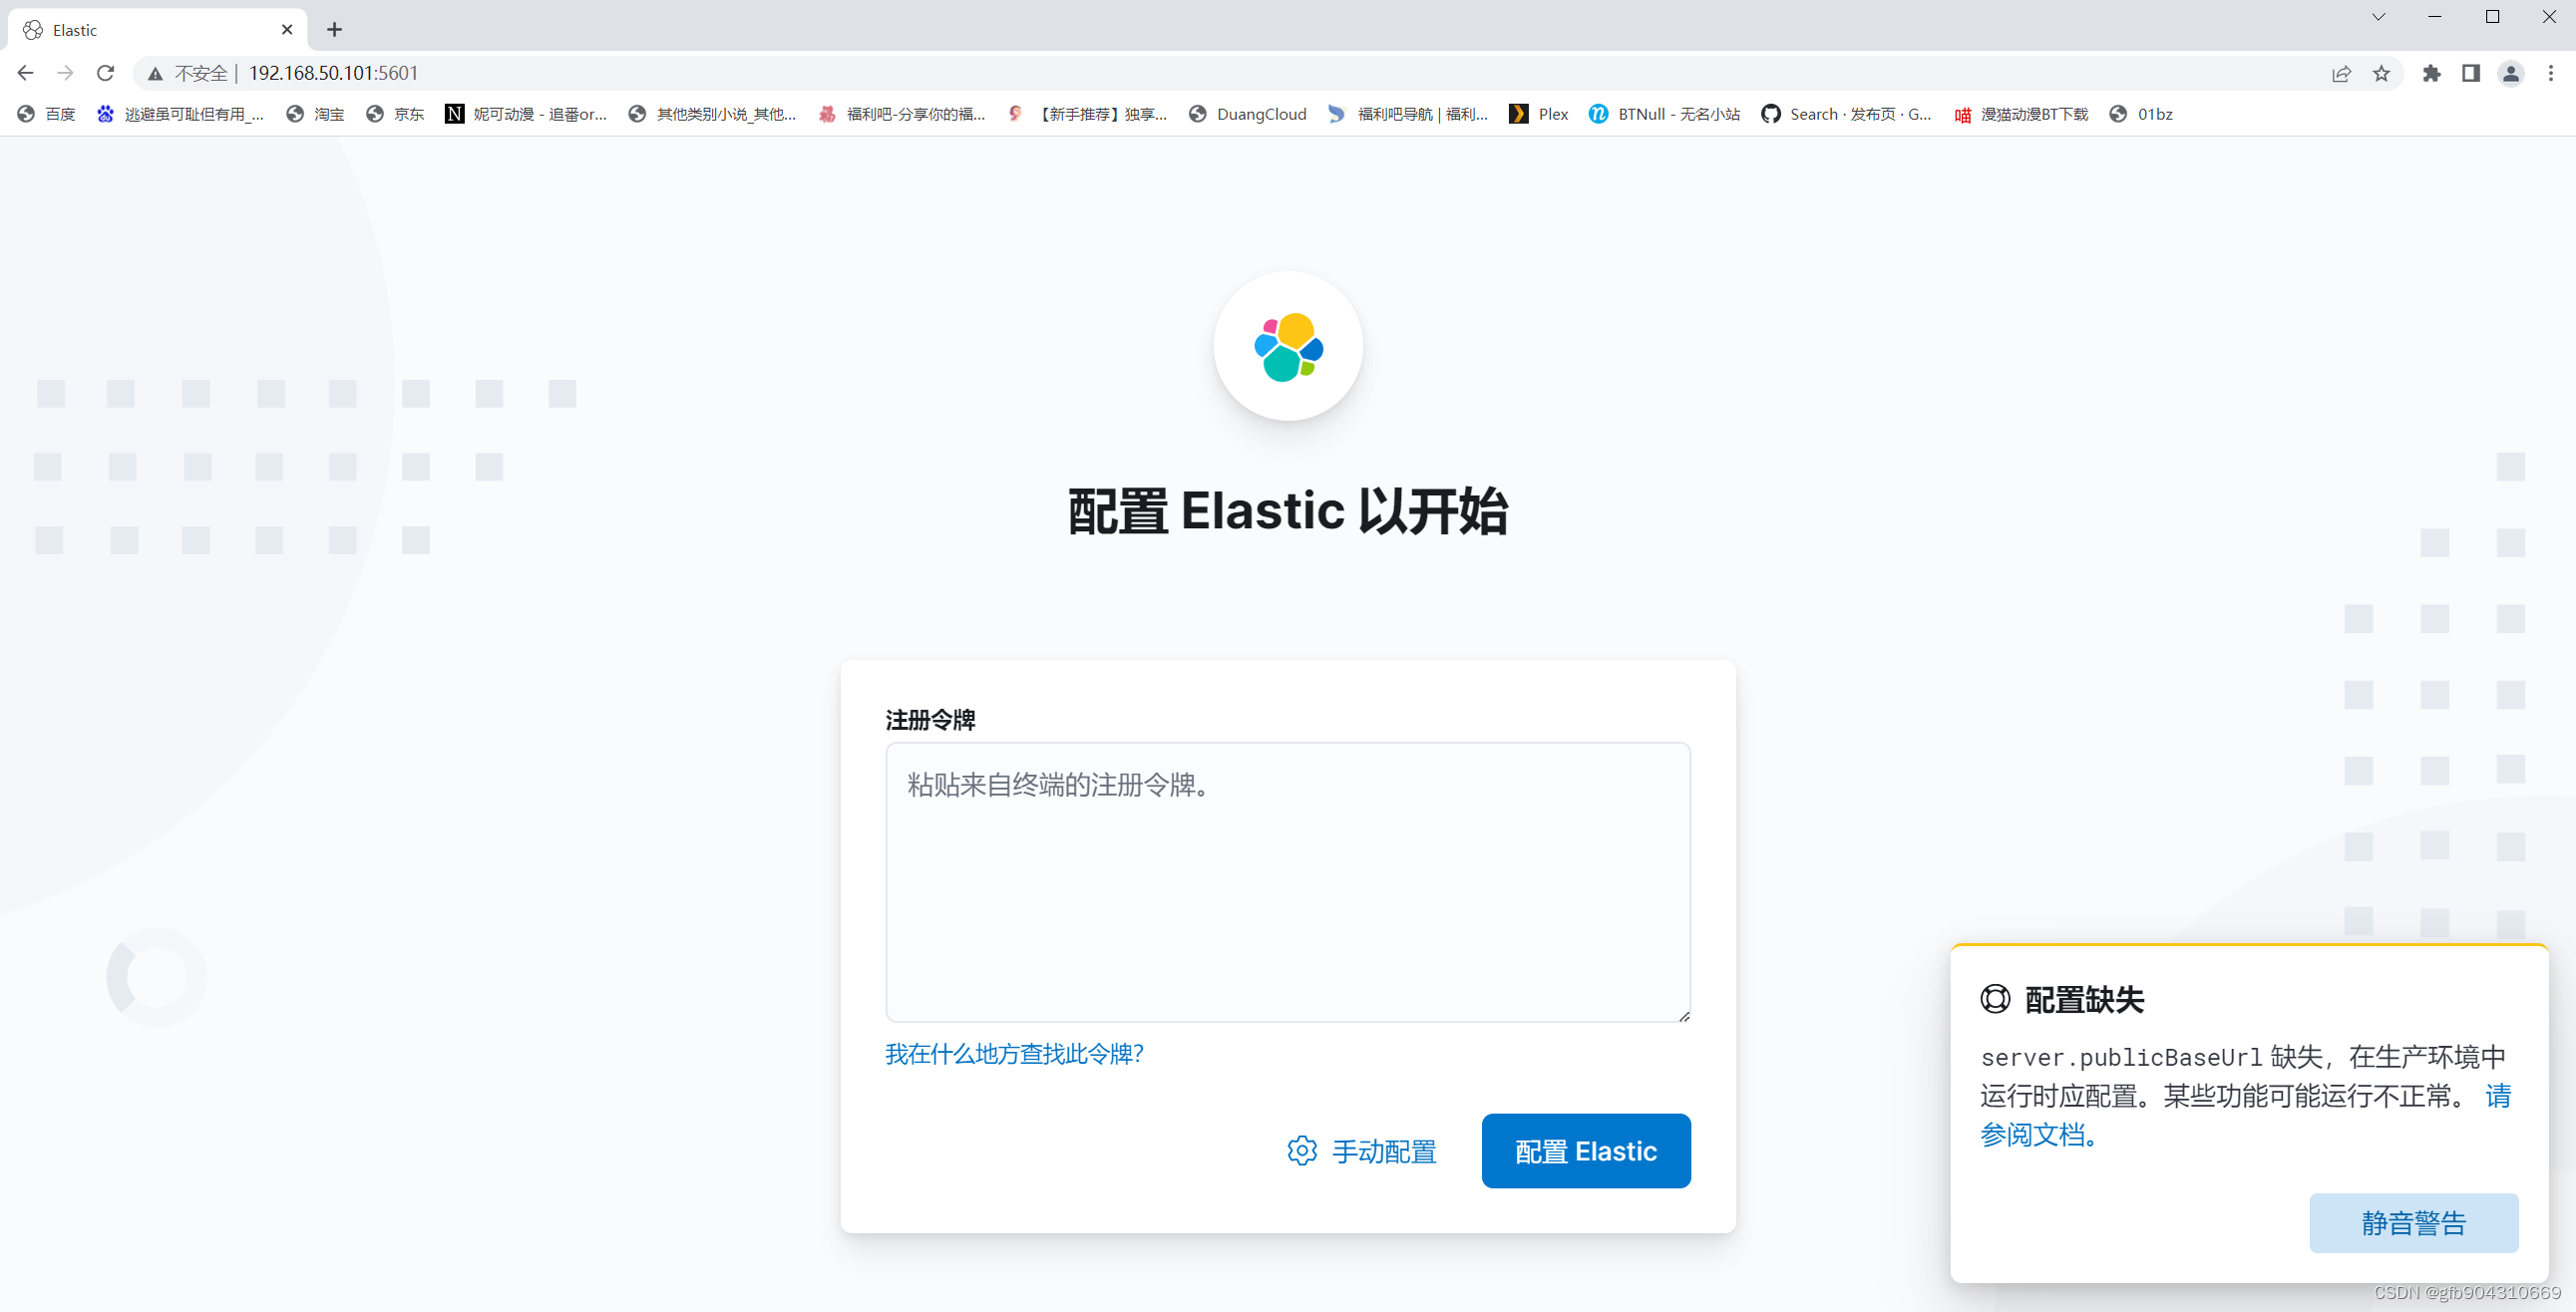
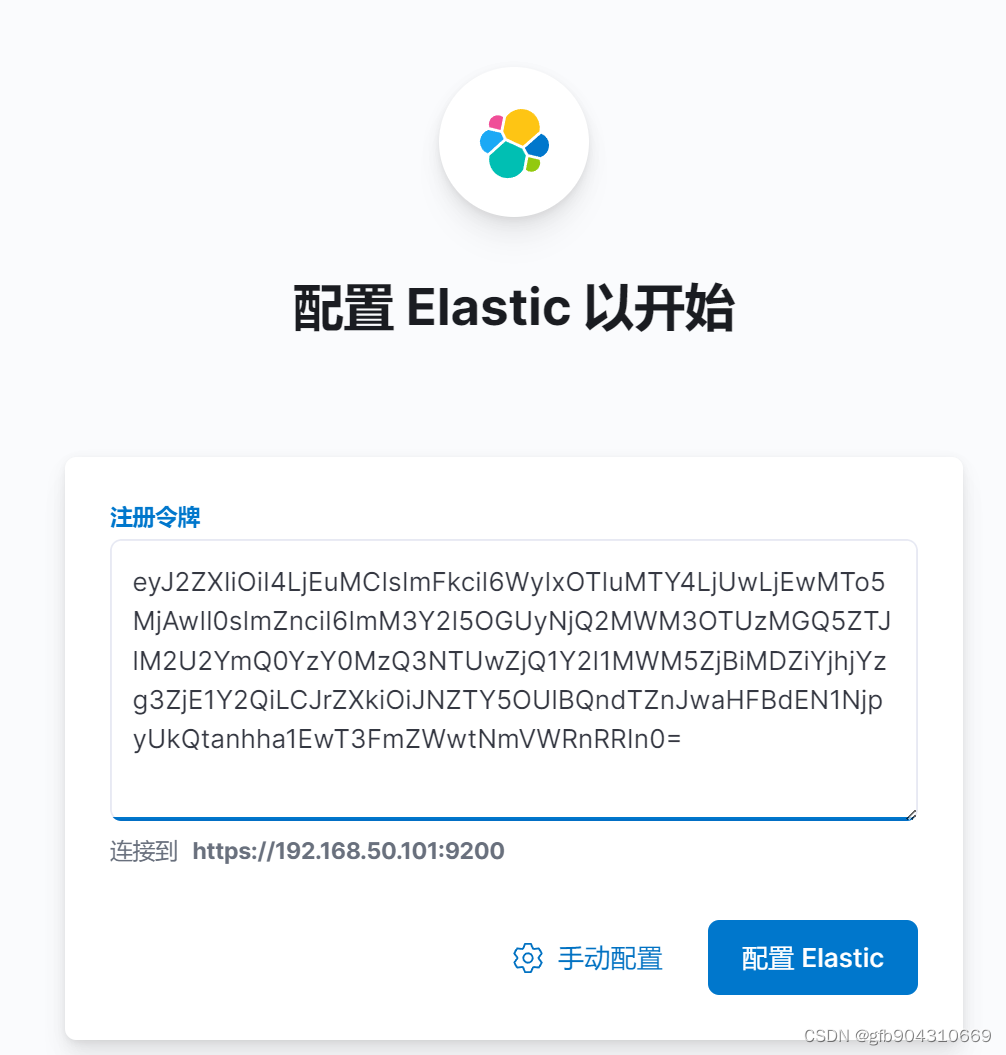
申请配置令牌
cd /usr/share/elasticsearch/bin
./elasticsearch-create-enrollment-token -s kibana --url "https://192.168.50.101:9200"
效果:

复制到浏览器
提示需要验证码
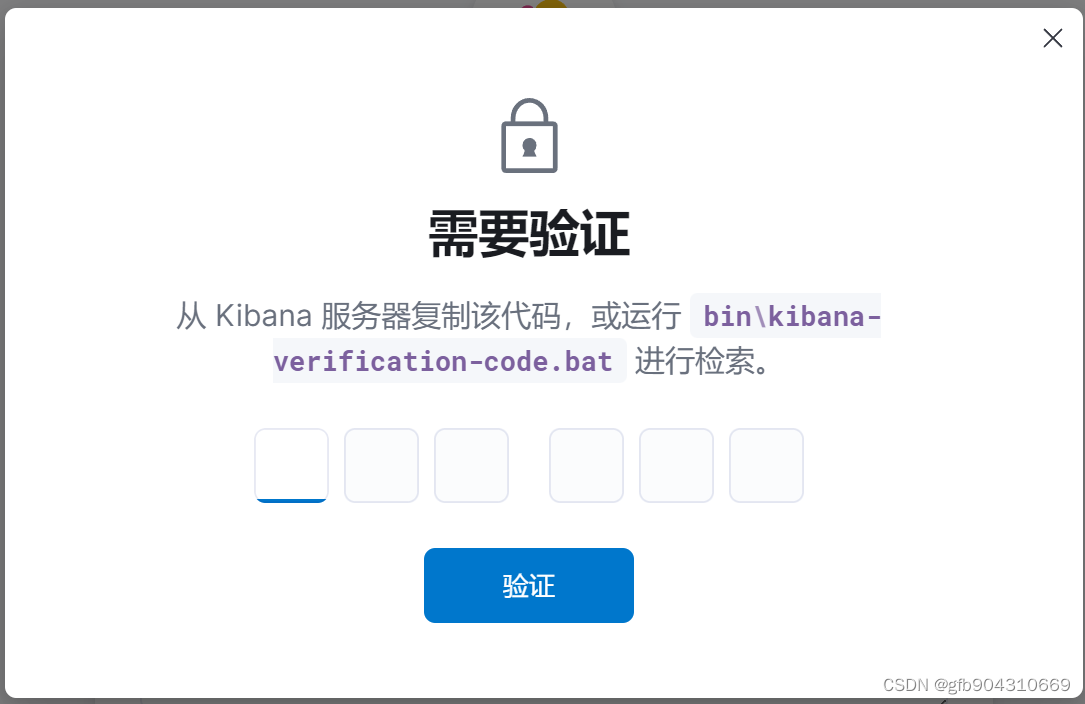
获取验证码
cd /usr/share/kibana/bin
./kibana-verification-code
效果
![]()
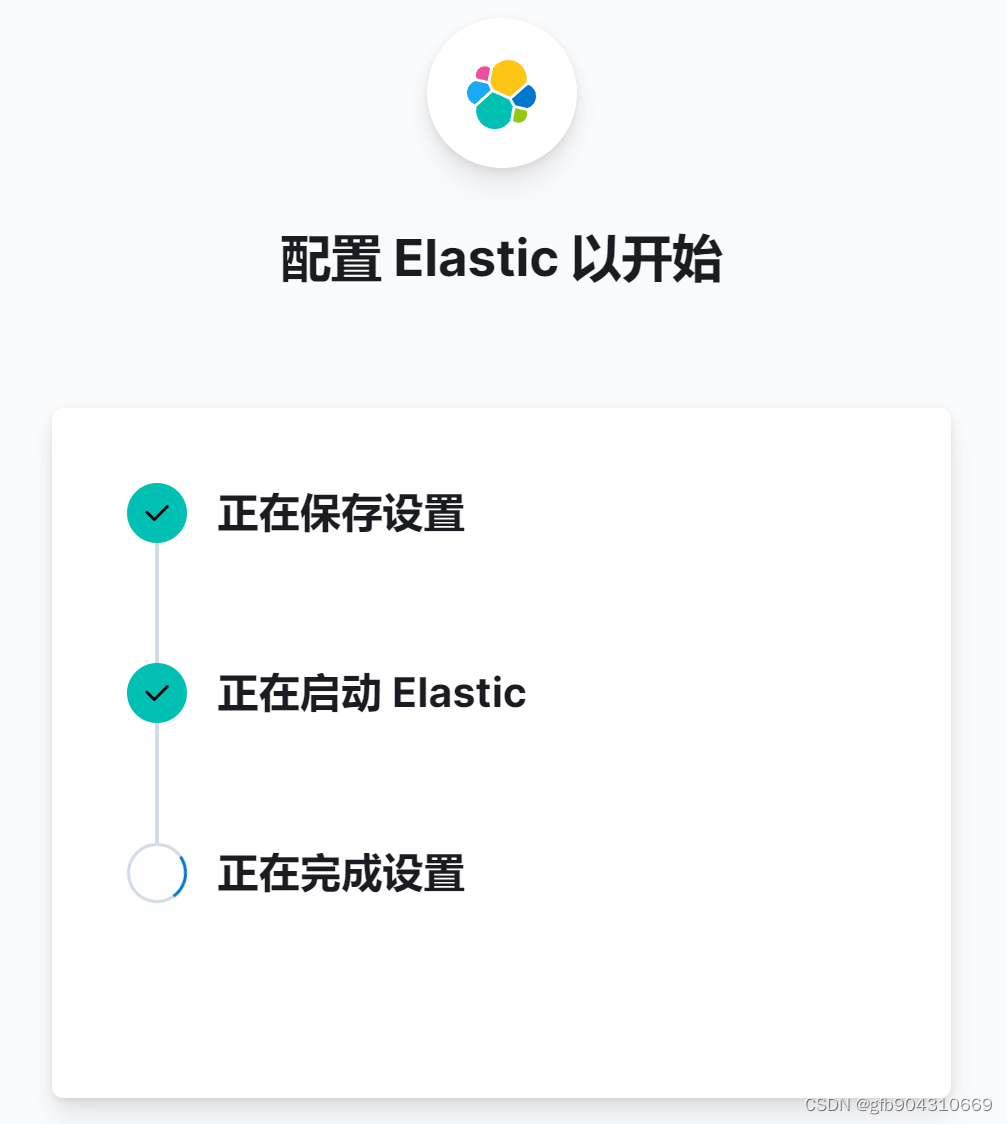
等待自动配置
提示登录,使用自己申请的账号,本机是:fbguo
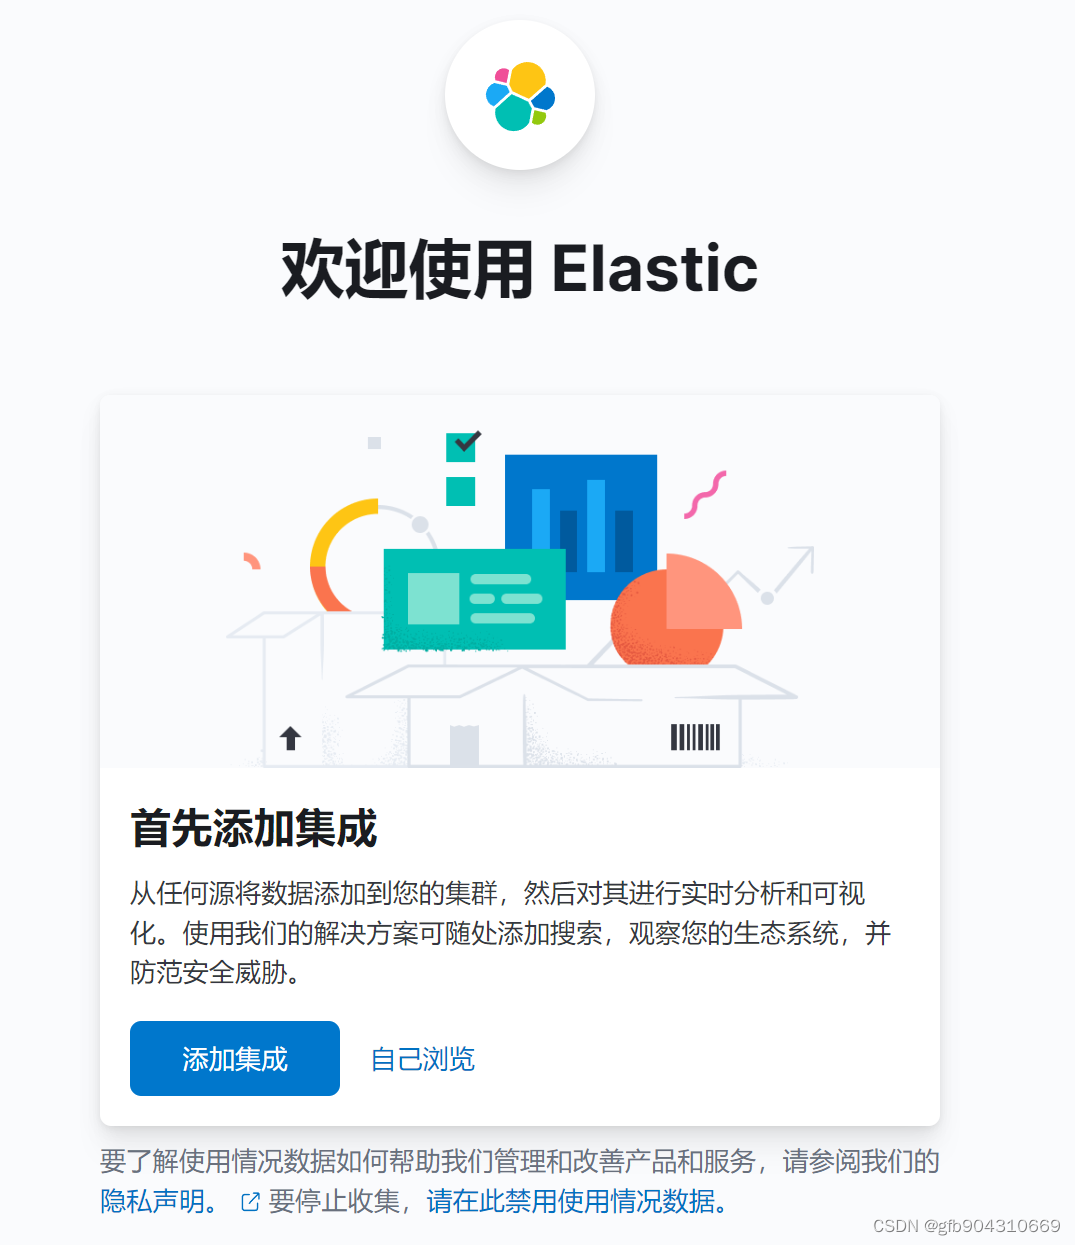
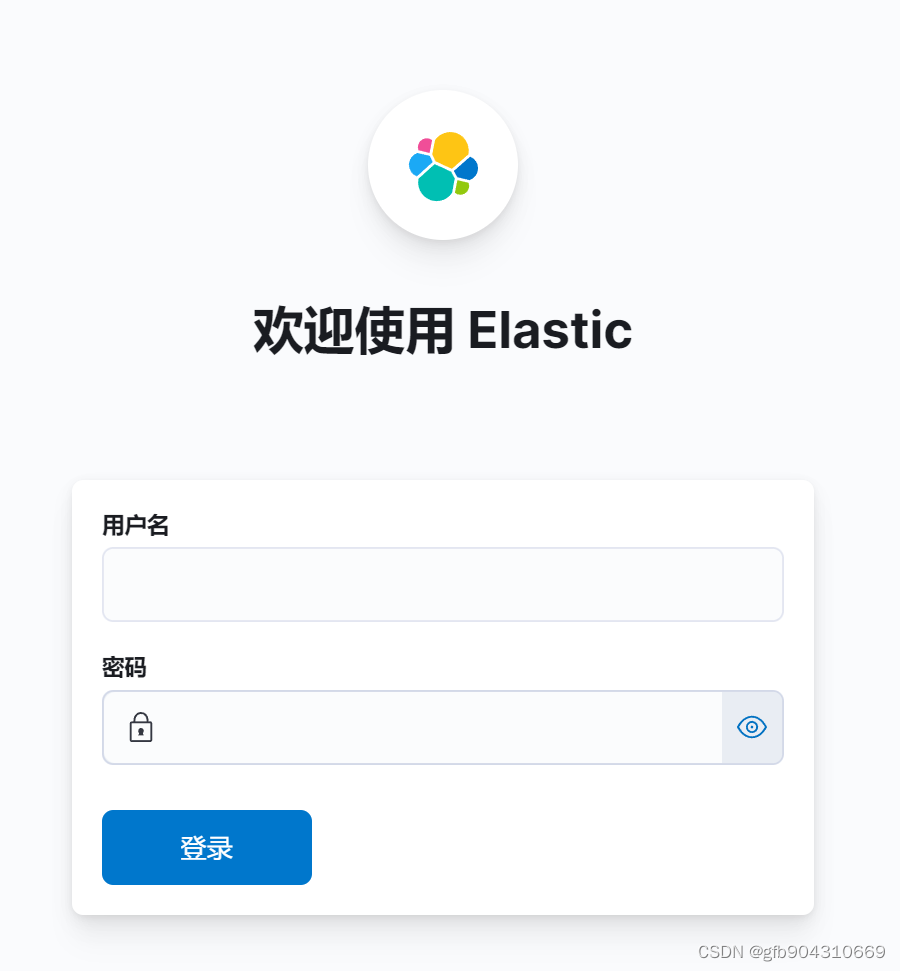 成功
成功
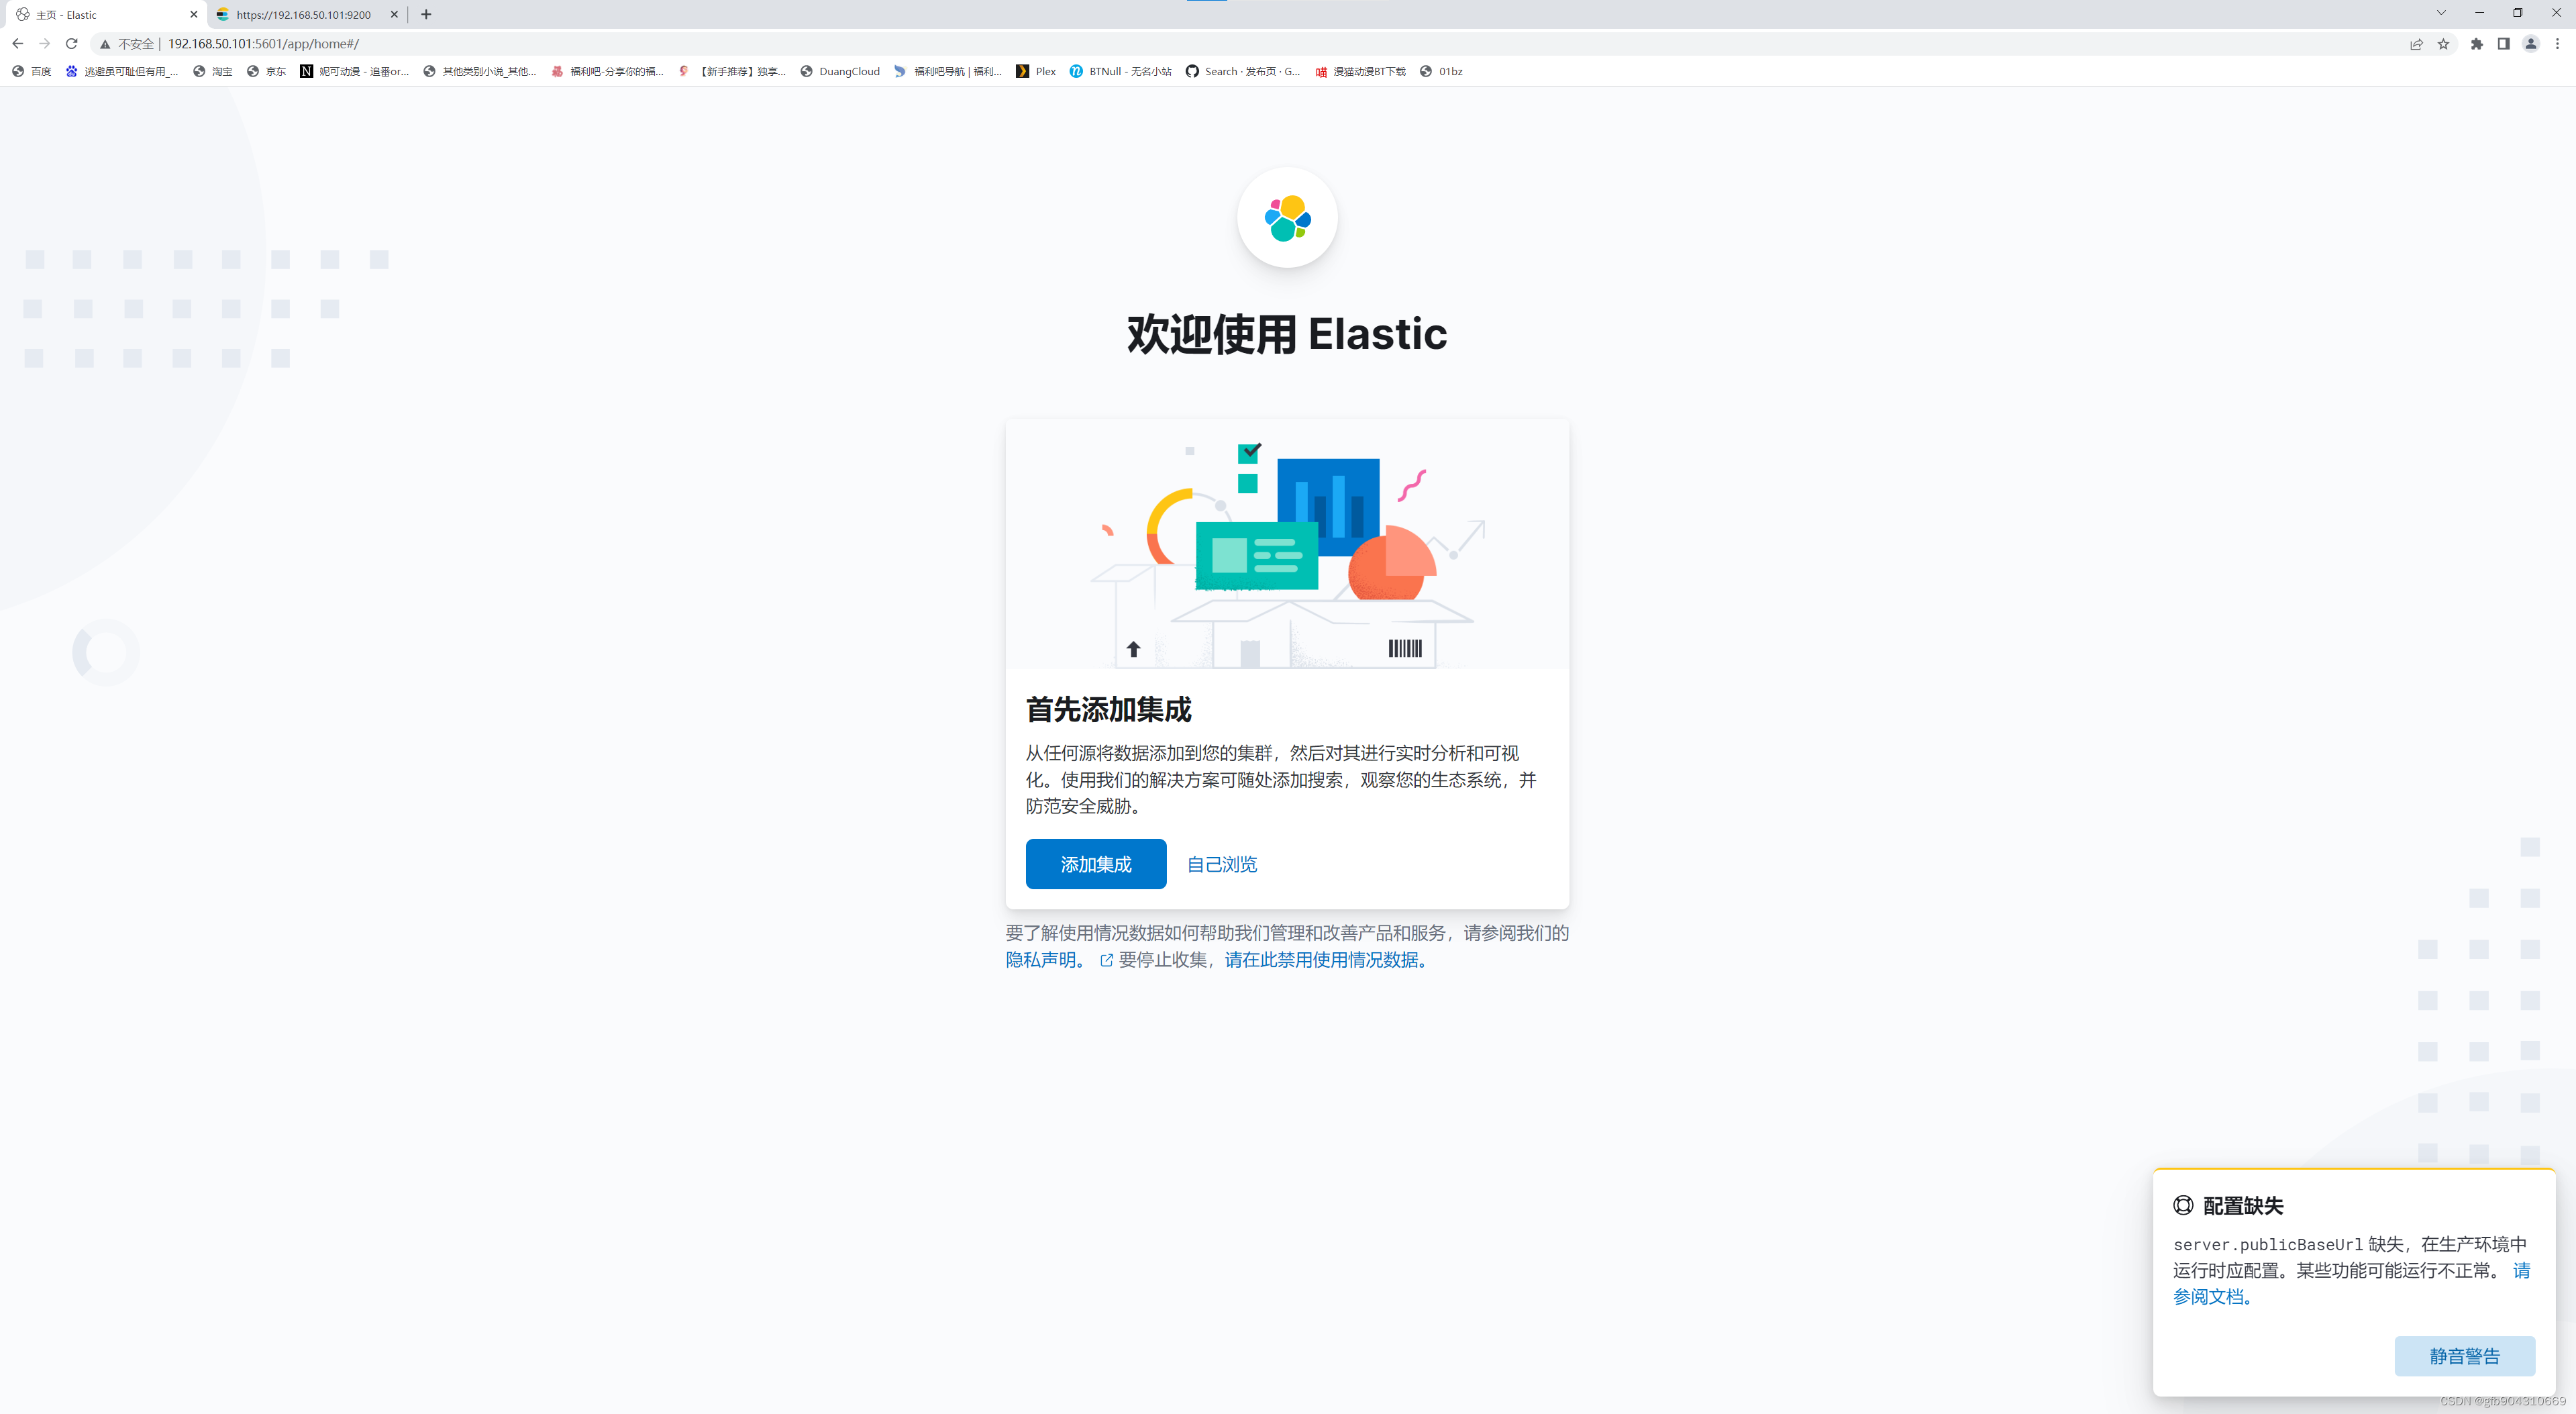
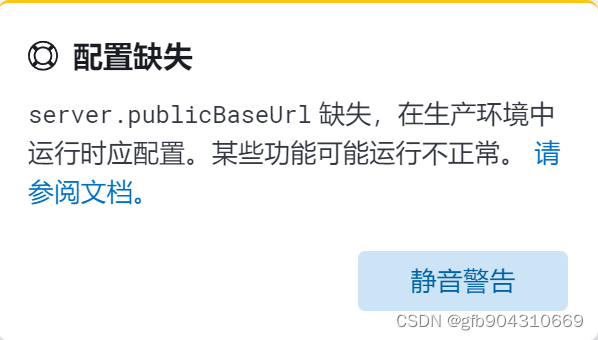
解决publicBaseUrl,我目前不解决好像也没遇到问题
解决方法是将kibana.yml中server.publicBaseUrl改成当前访问的地址,不以/结尾

4.加载样例数据
点击添加集成
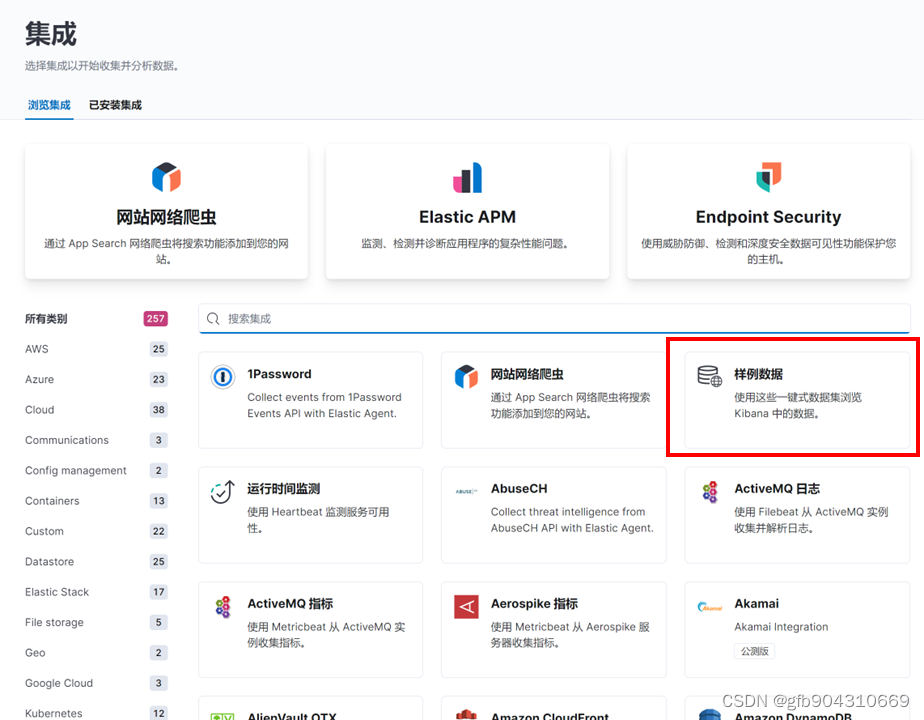
三个都添加上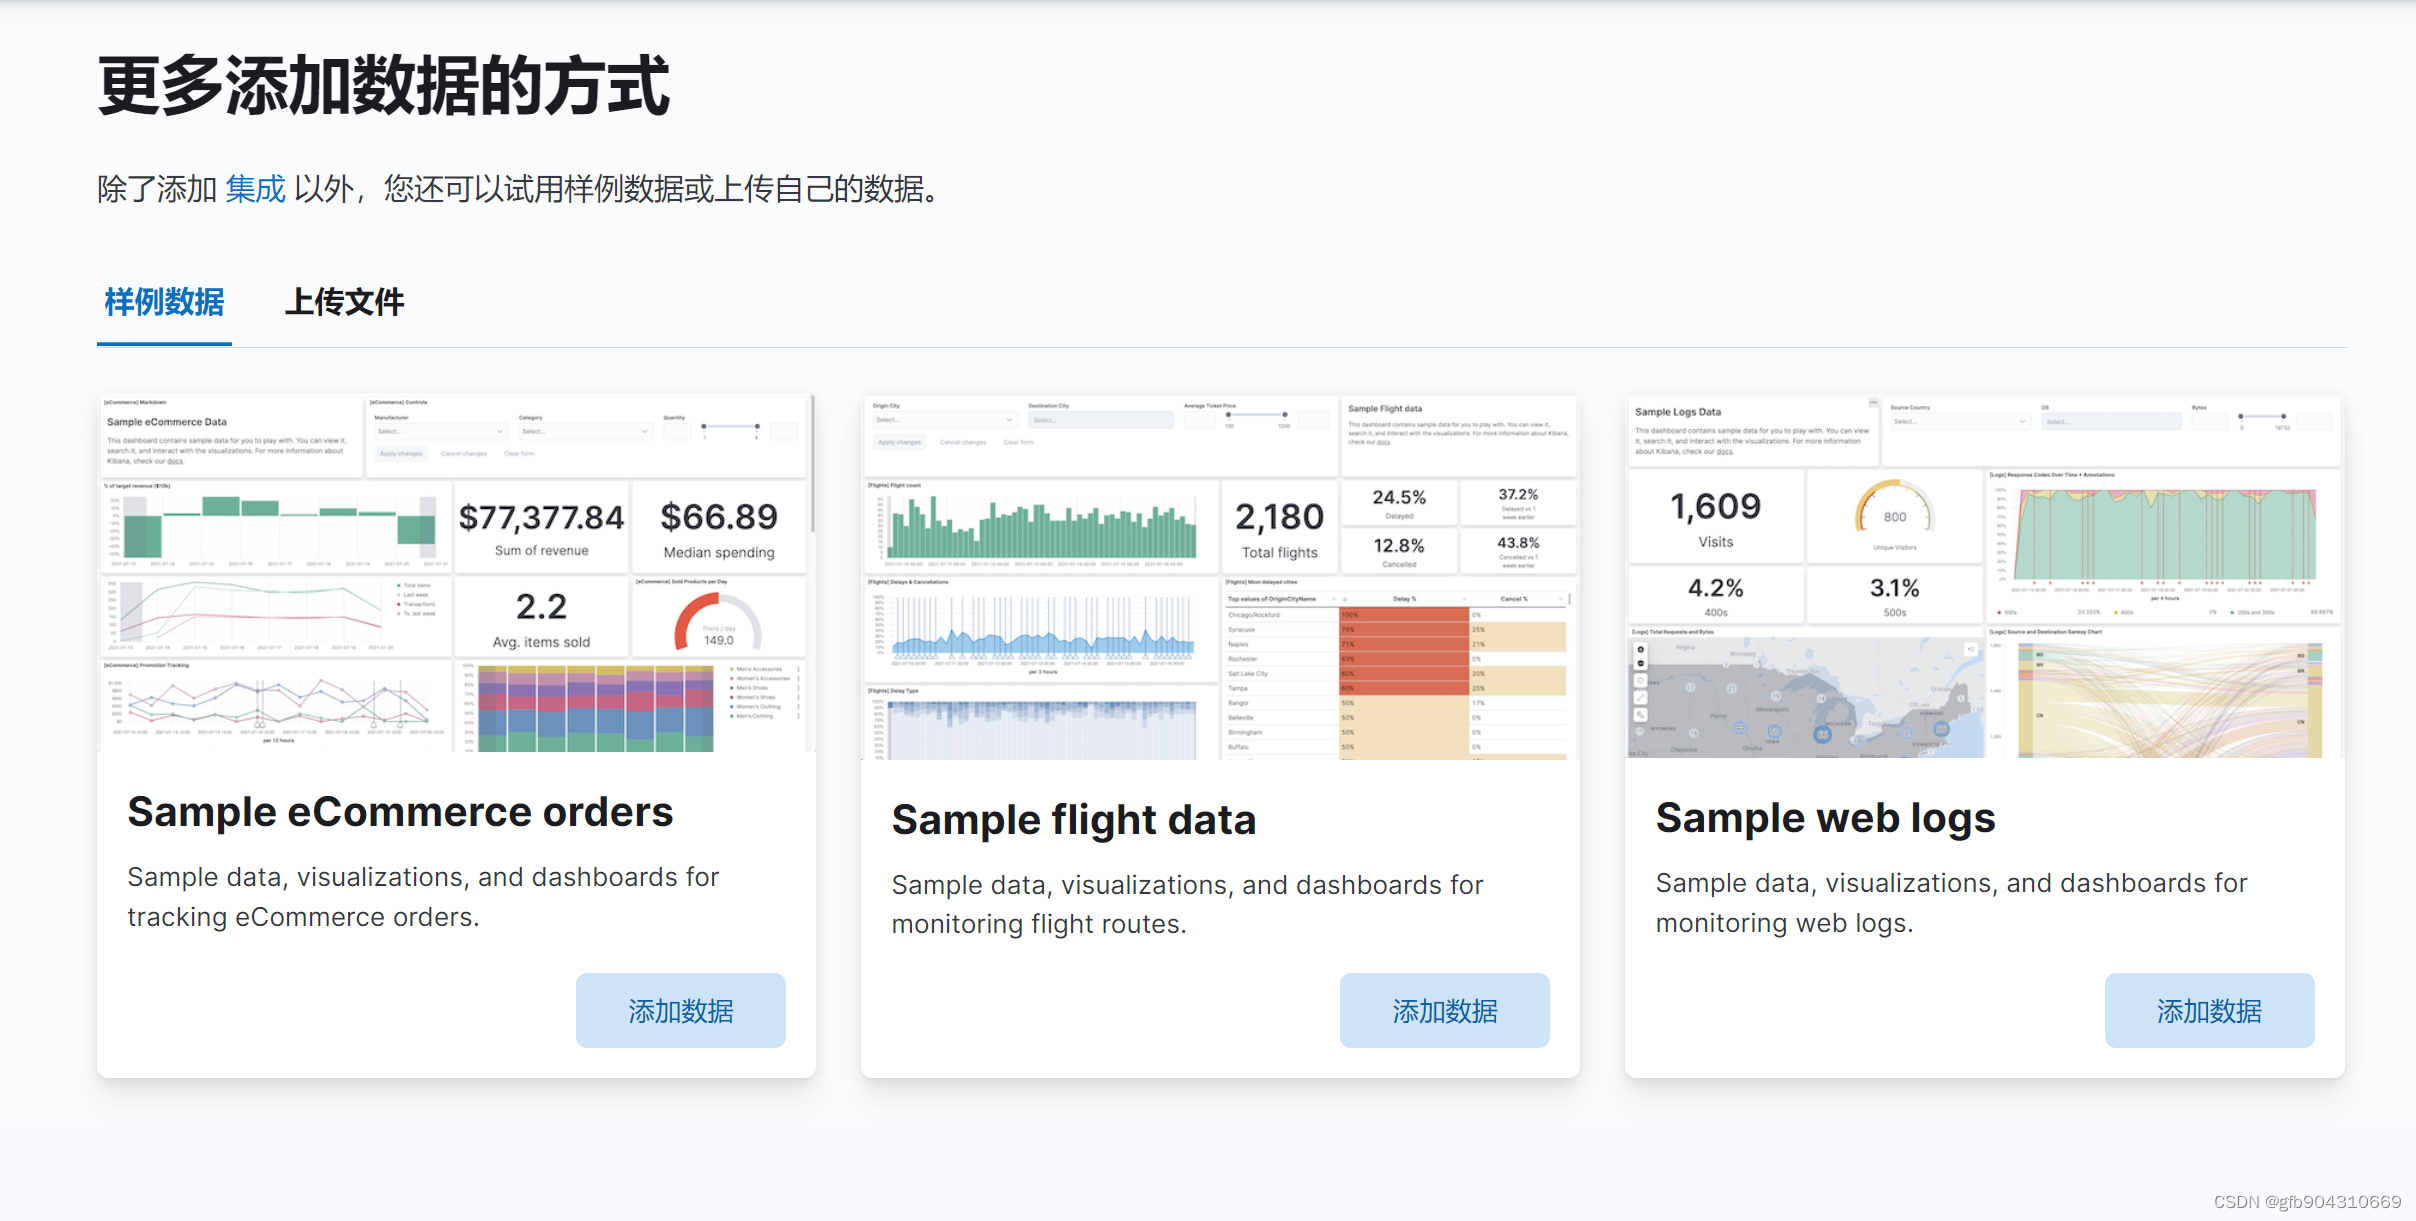
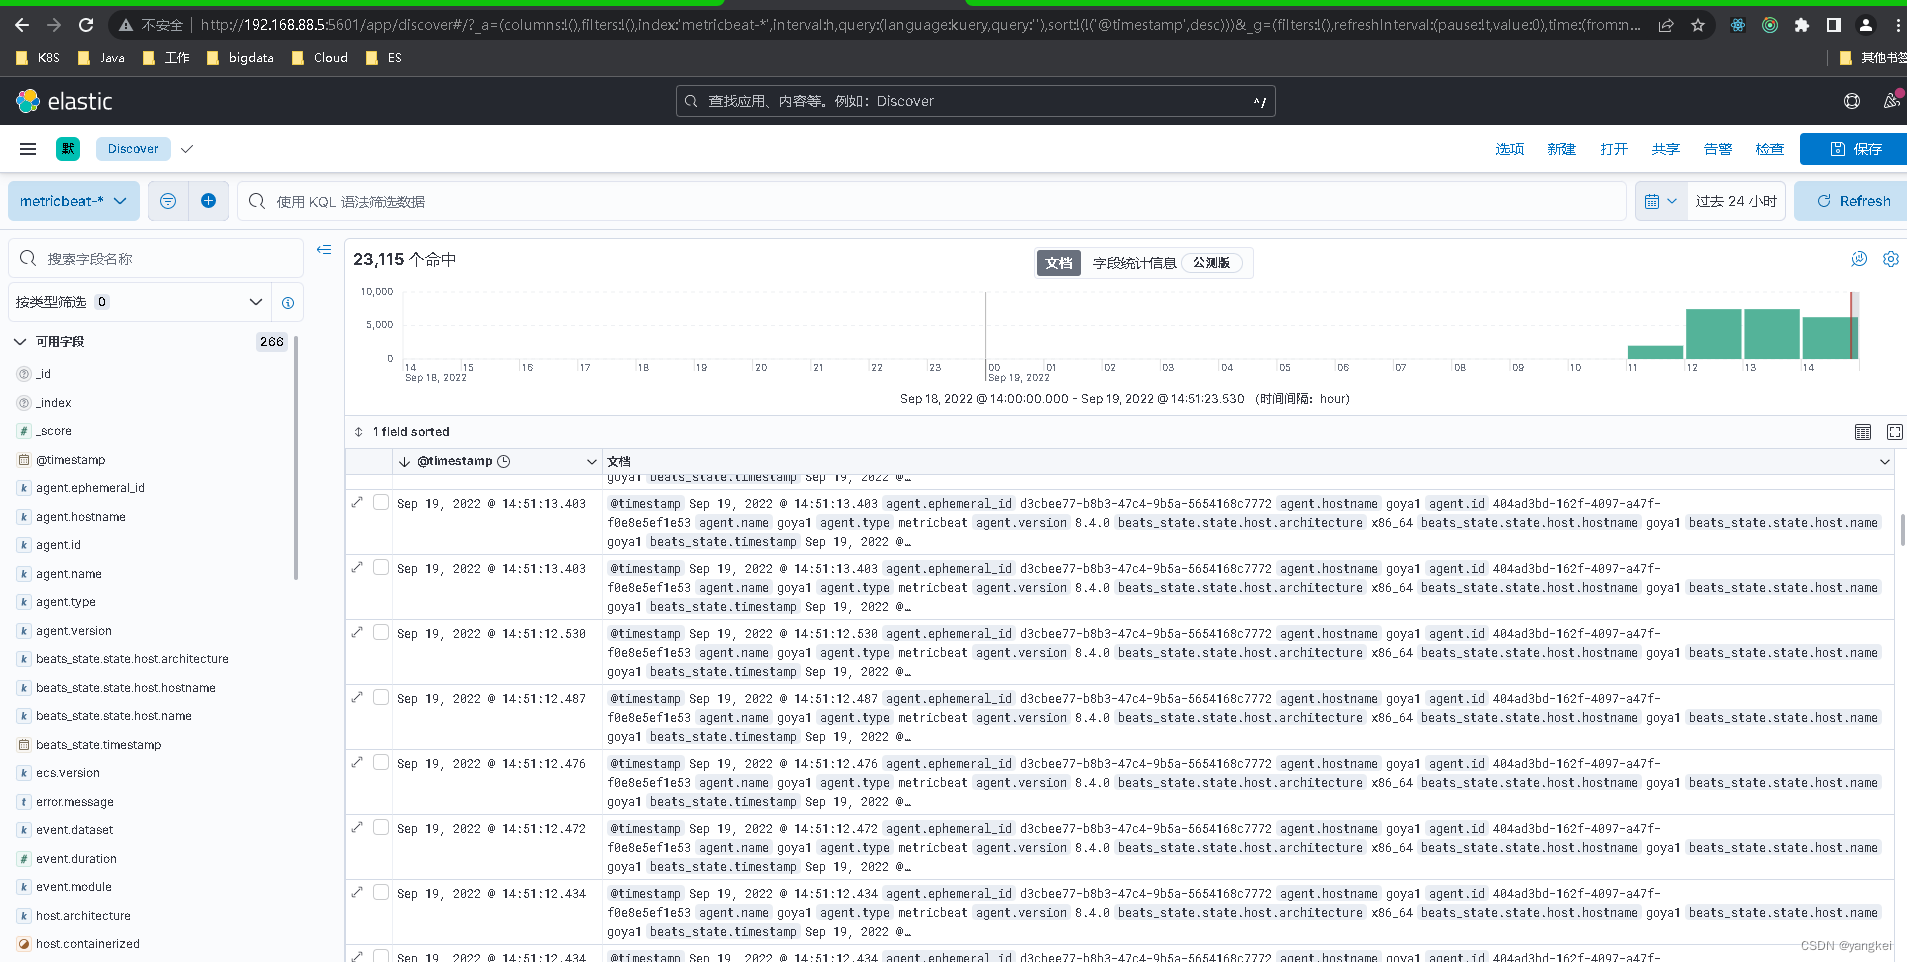
点击左侧的Discover和Dashboard就可以查看了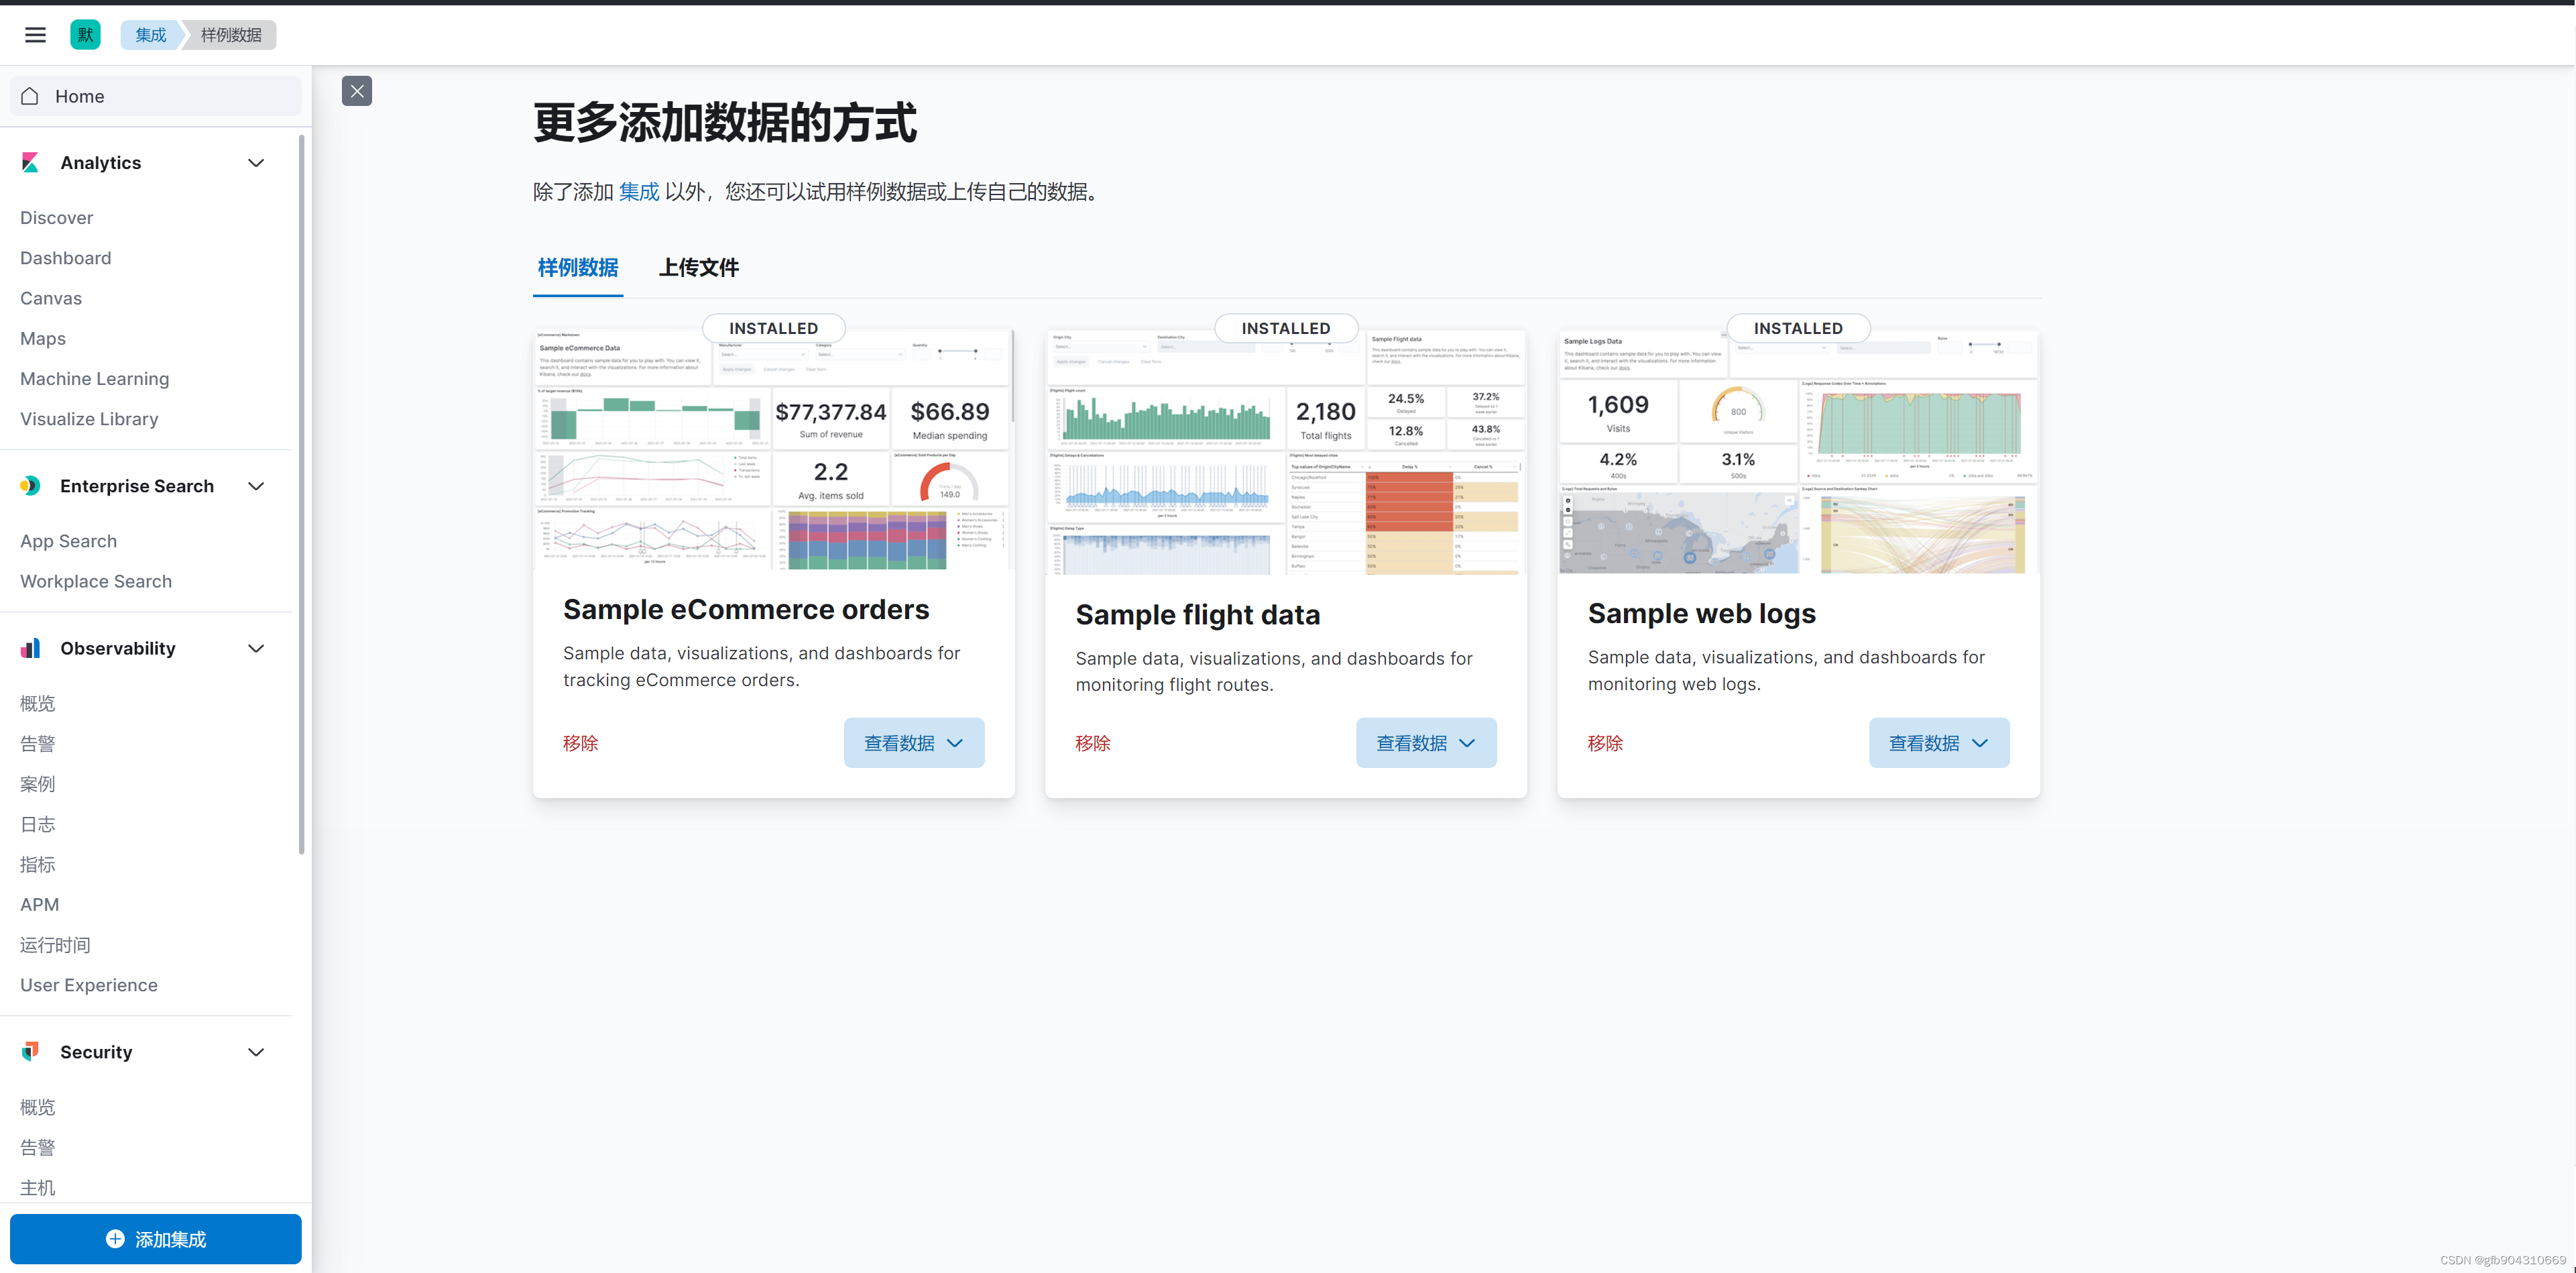
四、安装MetricBeat
1.官方流程
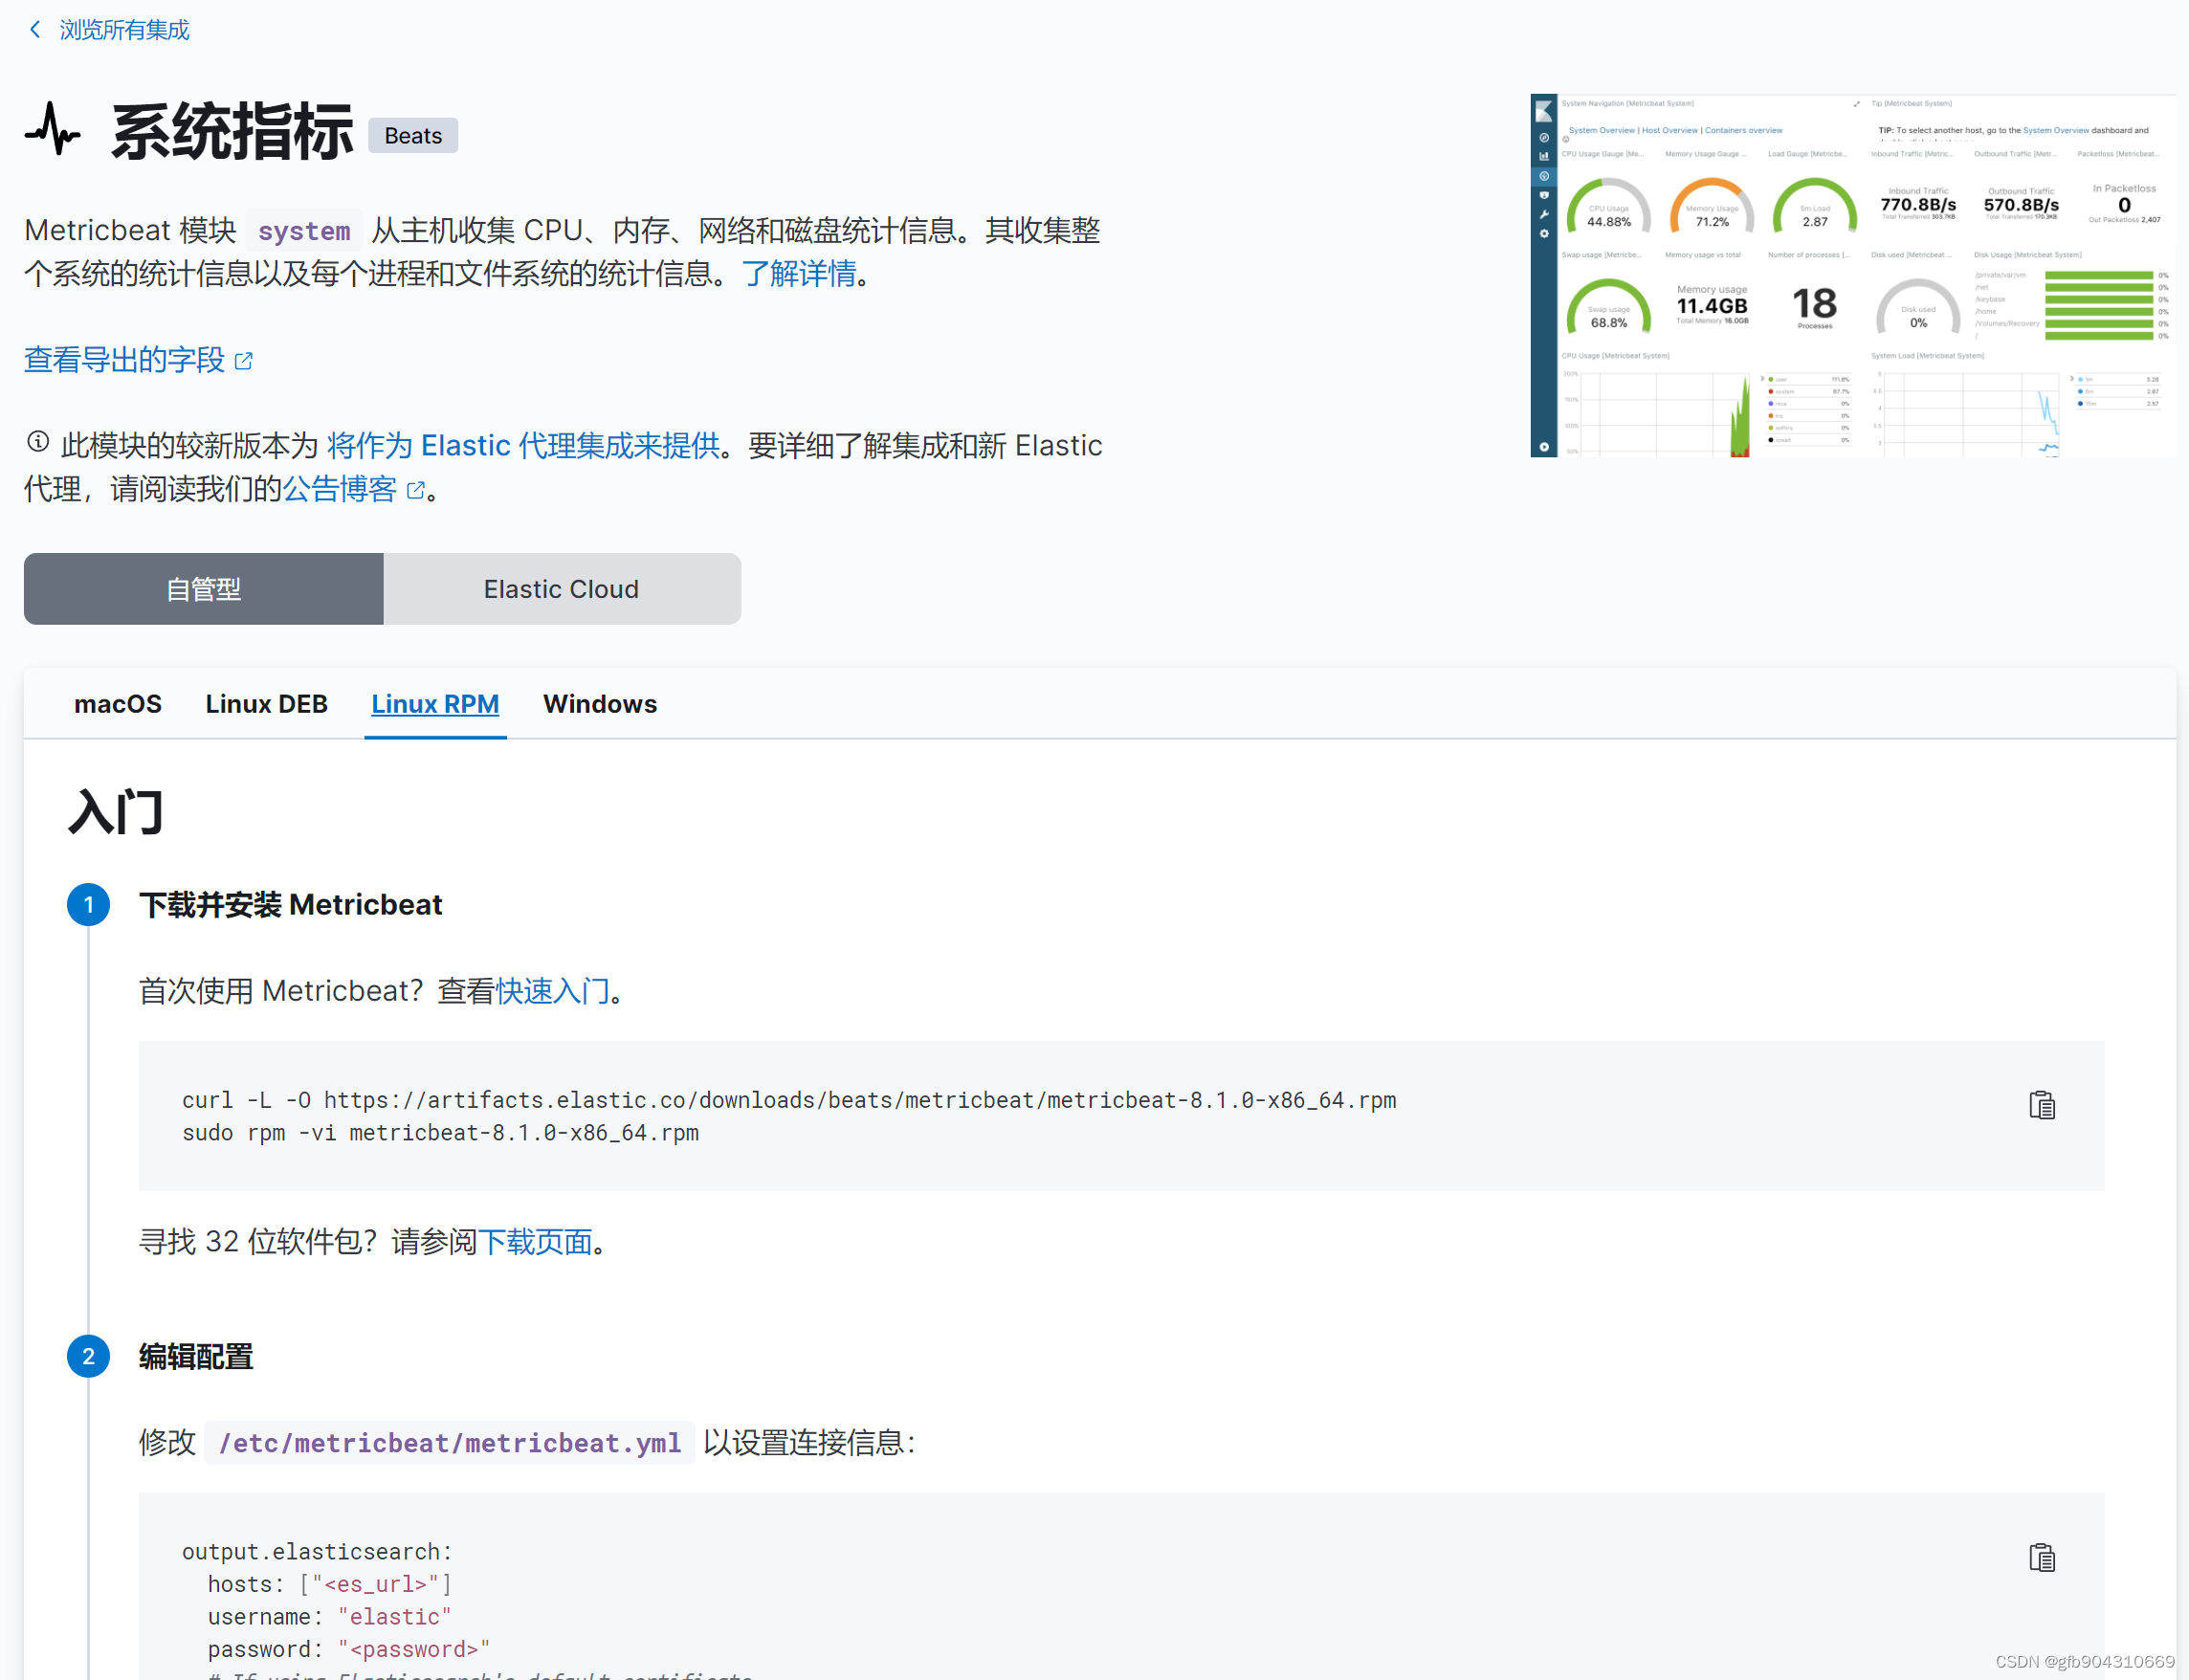
先在集成搜索System
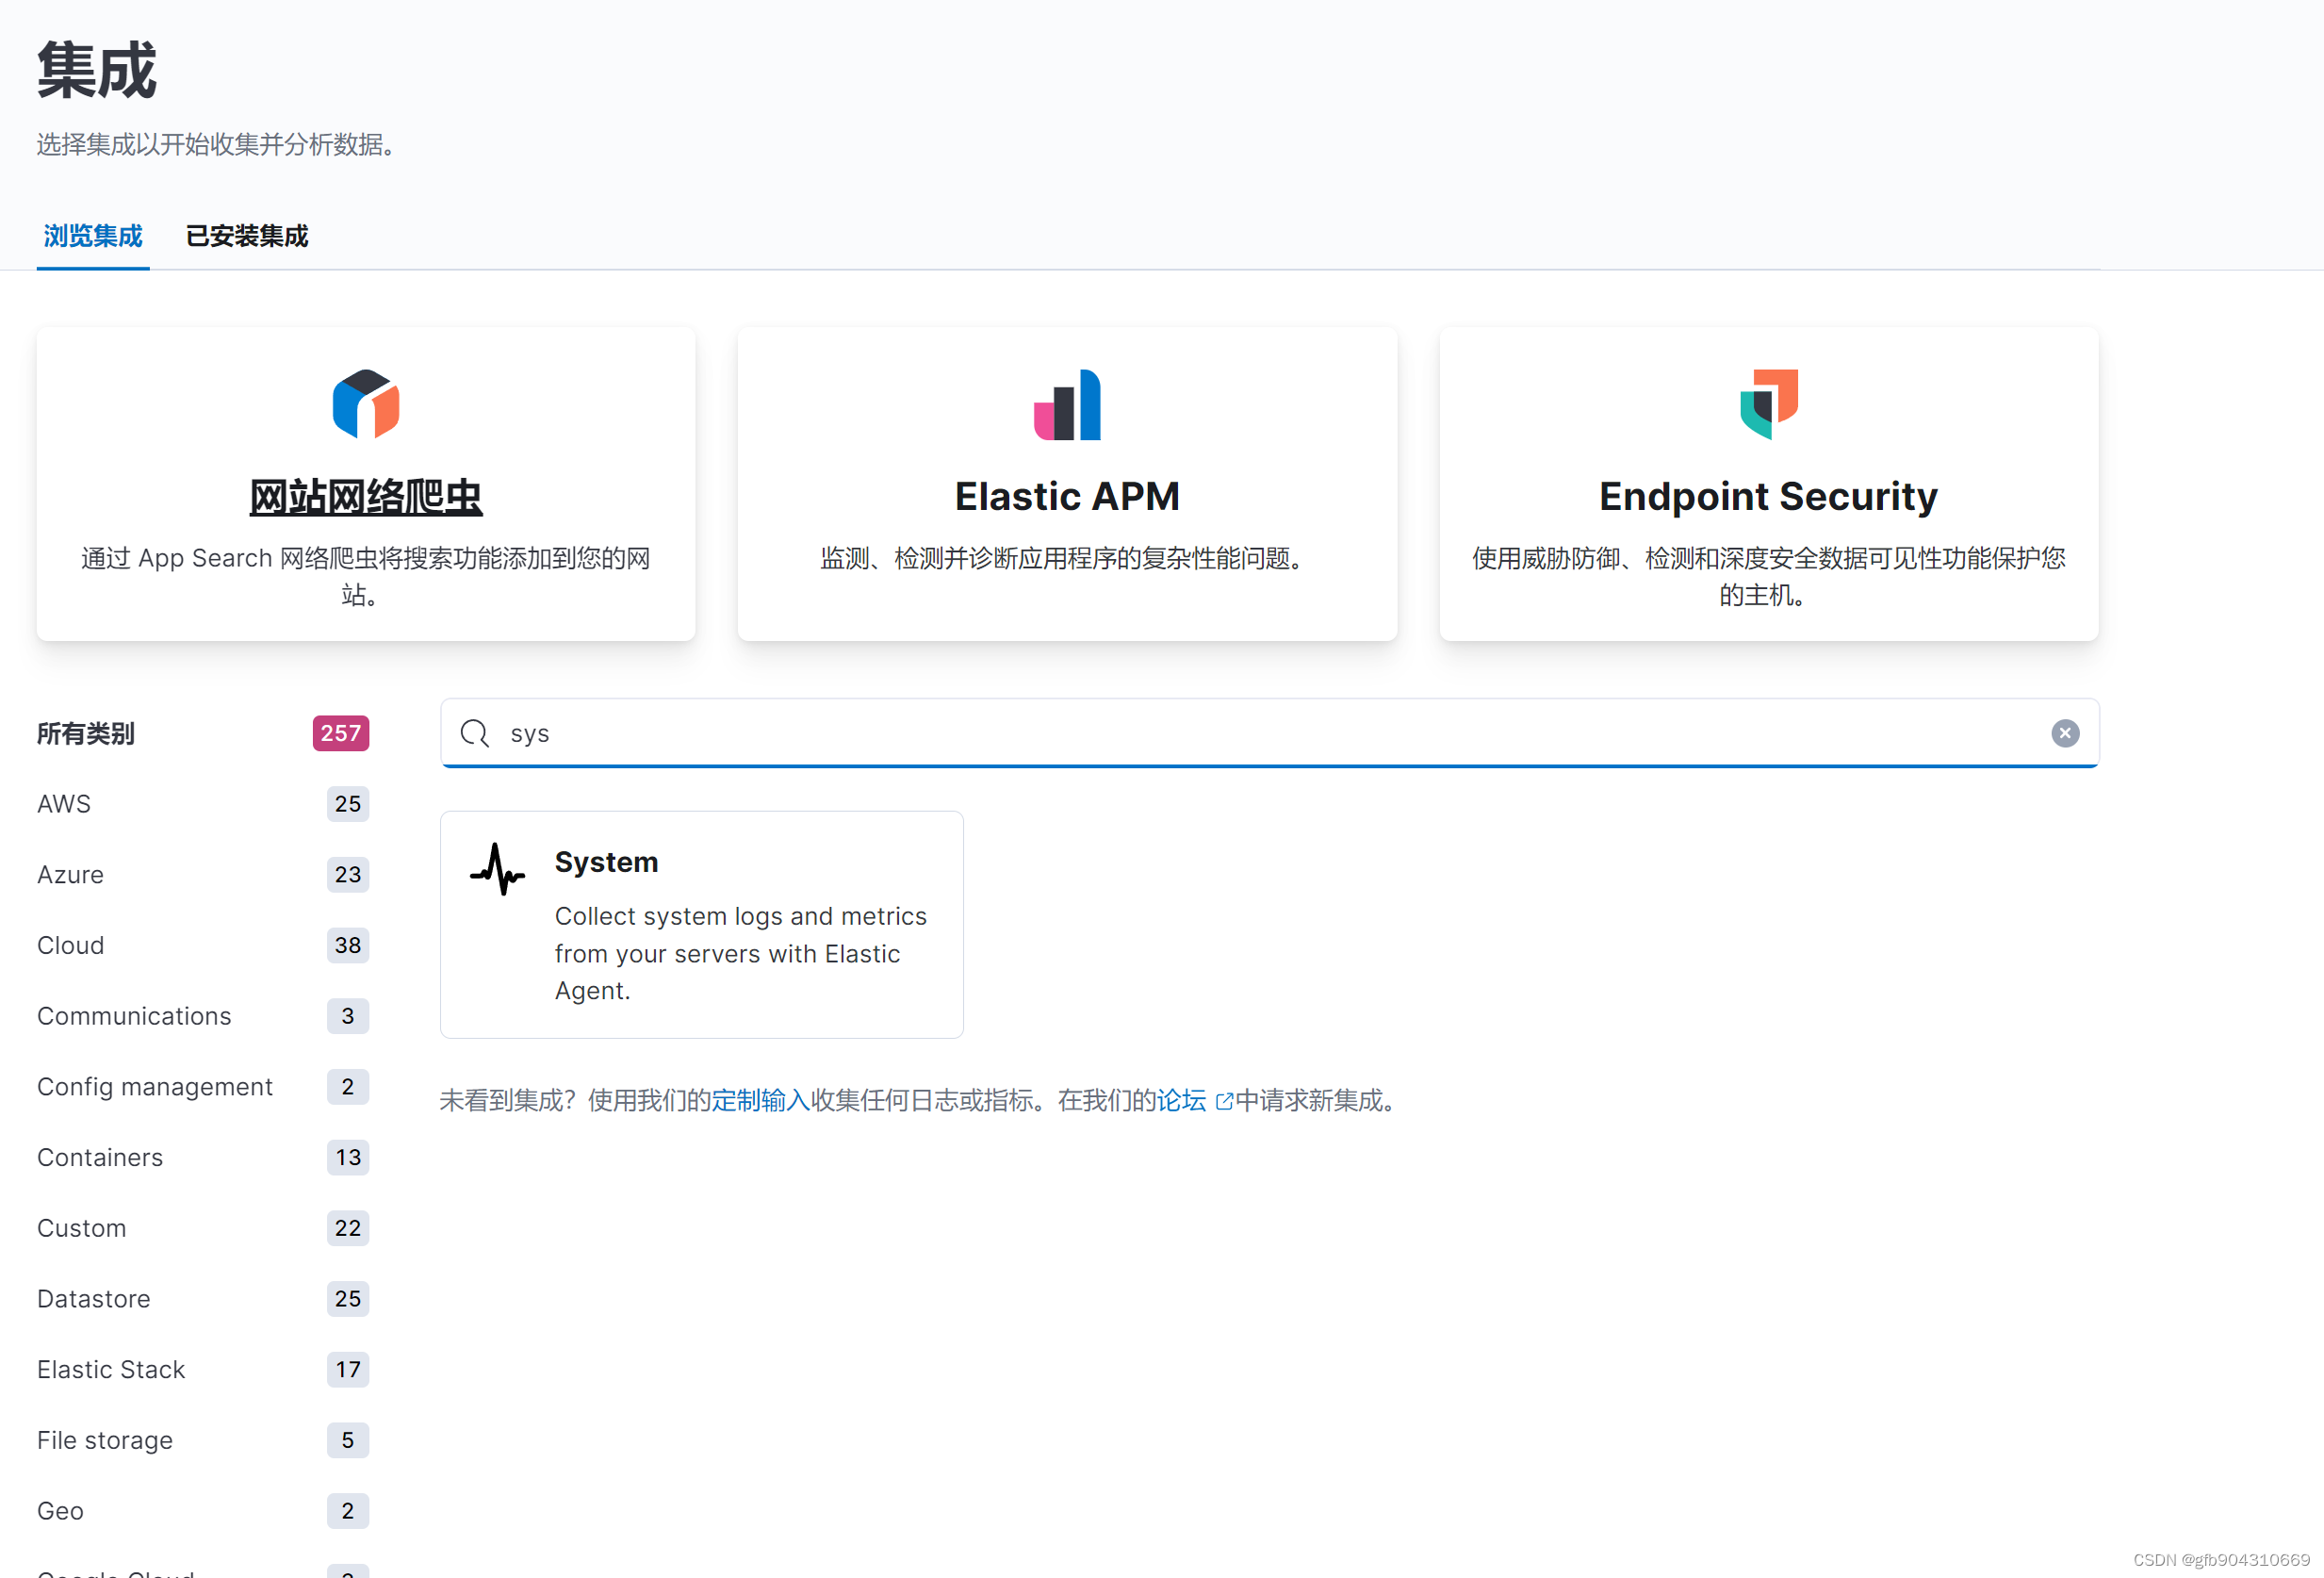
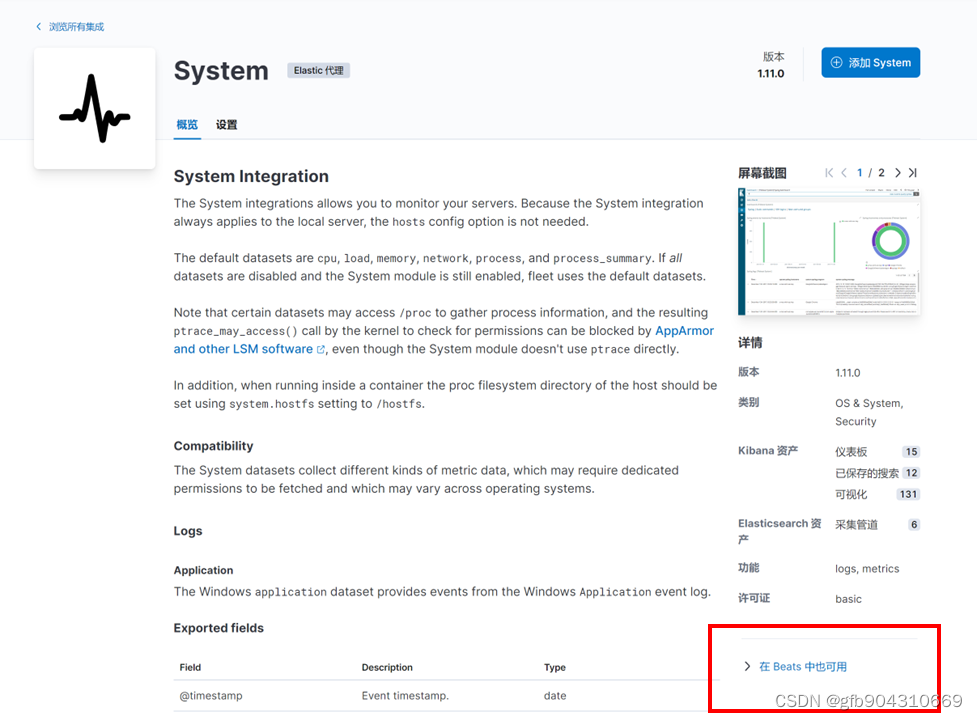
点系统指标

这时候其实网页就会给一个设置流程,选RPM就可以,接下来可以参考官方的和我的流程
2.安装RPM
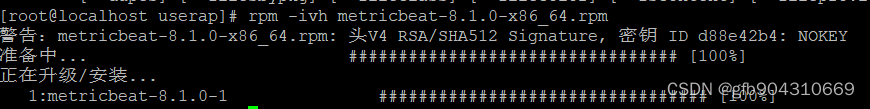
rpm -ivh metricbeat-8.1.0-x86_64.rpm
效果
设置开机启动
systemctl enable metricbeat.service3.配置
修改配置档
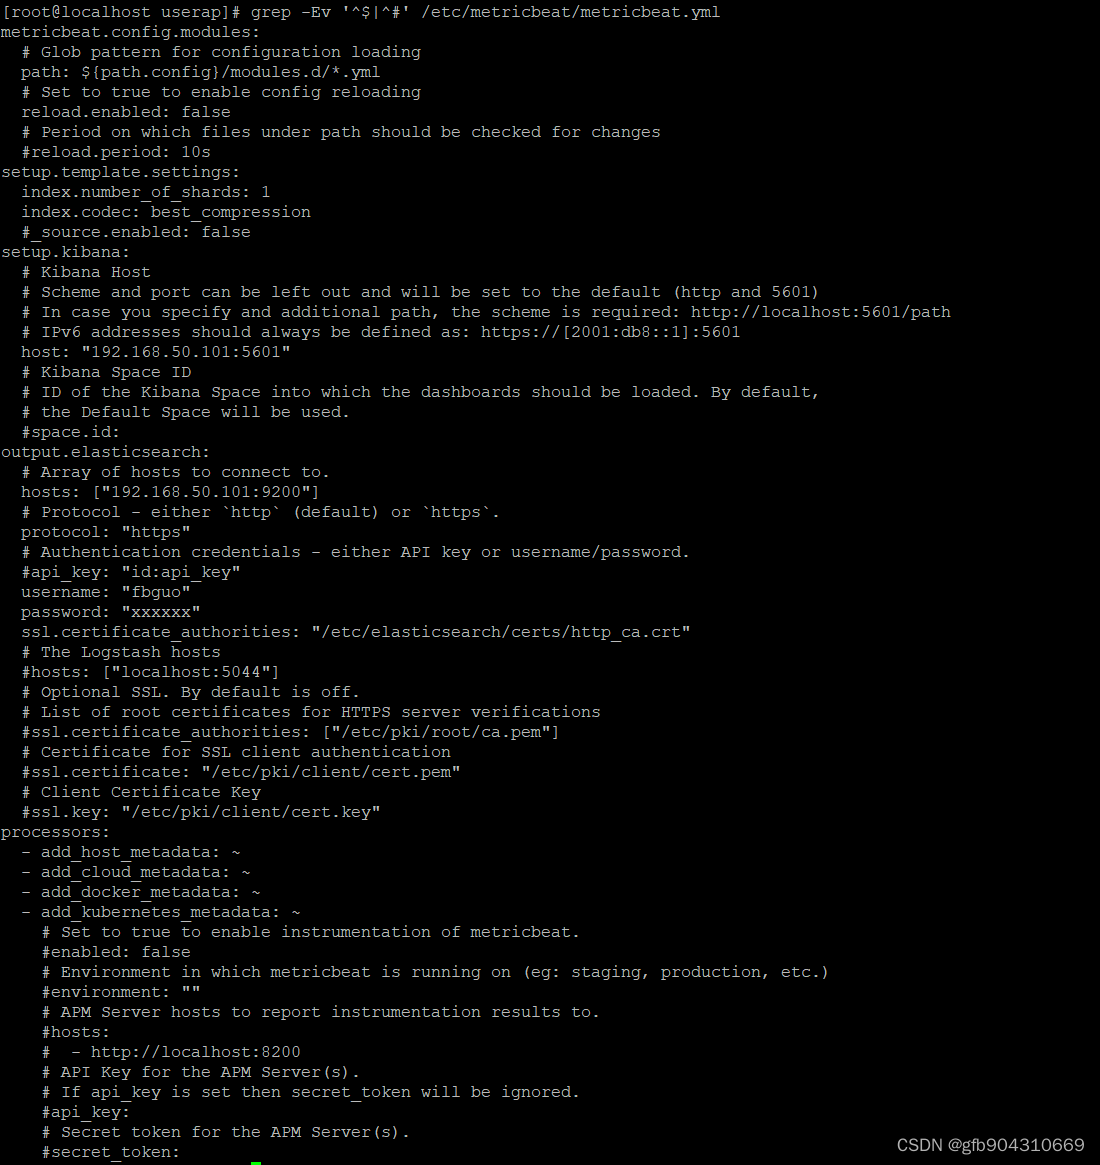
vi /etc/metricbeat/metricbeat.yml修改内容
setup.kibana:host: "192.168.50.101:5601"
output.elasticsearch:hosts: ["192.168.50.101:9200"]  protocol: "https"username: "fbguo"password: "xxxxxx"ssl.certificate_authorities: "/etc/elasticsearch/certs/http_ca.crt"
效果
PS:这里username官方提示使用elastic,但是那个密码是自动生成的记不住,我就用自己申请的账号了,官方用的是ssl.ca_trusted_fingerprint,这个我也试过,但是总是报错,我会放到最下面供大家看一下,我这里用的是ssl.certificate_authorities,如果别的机器要用metricbeat,请将这个certs一起复制过去
Update:后续解决了ssl.ca_trusted_fingerprint的问题
获取fingerprint
openssl x509 -fingerprint -sha256 -in /etc/elasticsearch/certs/http_ca.crt效果
上面的Fingerprintj就是我们需要的东西,记得一定要把“:”去掉
我的就是:C7CB98E26461C79530D9E2E3E6BD4C64347550F45CB51C9F0B06BB8CC87F15CD
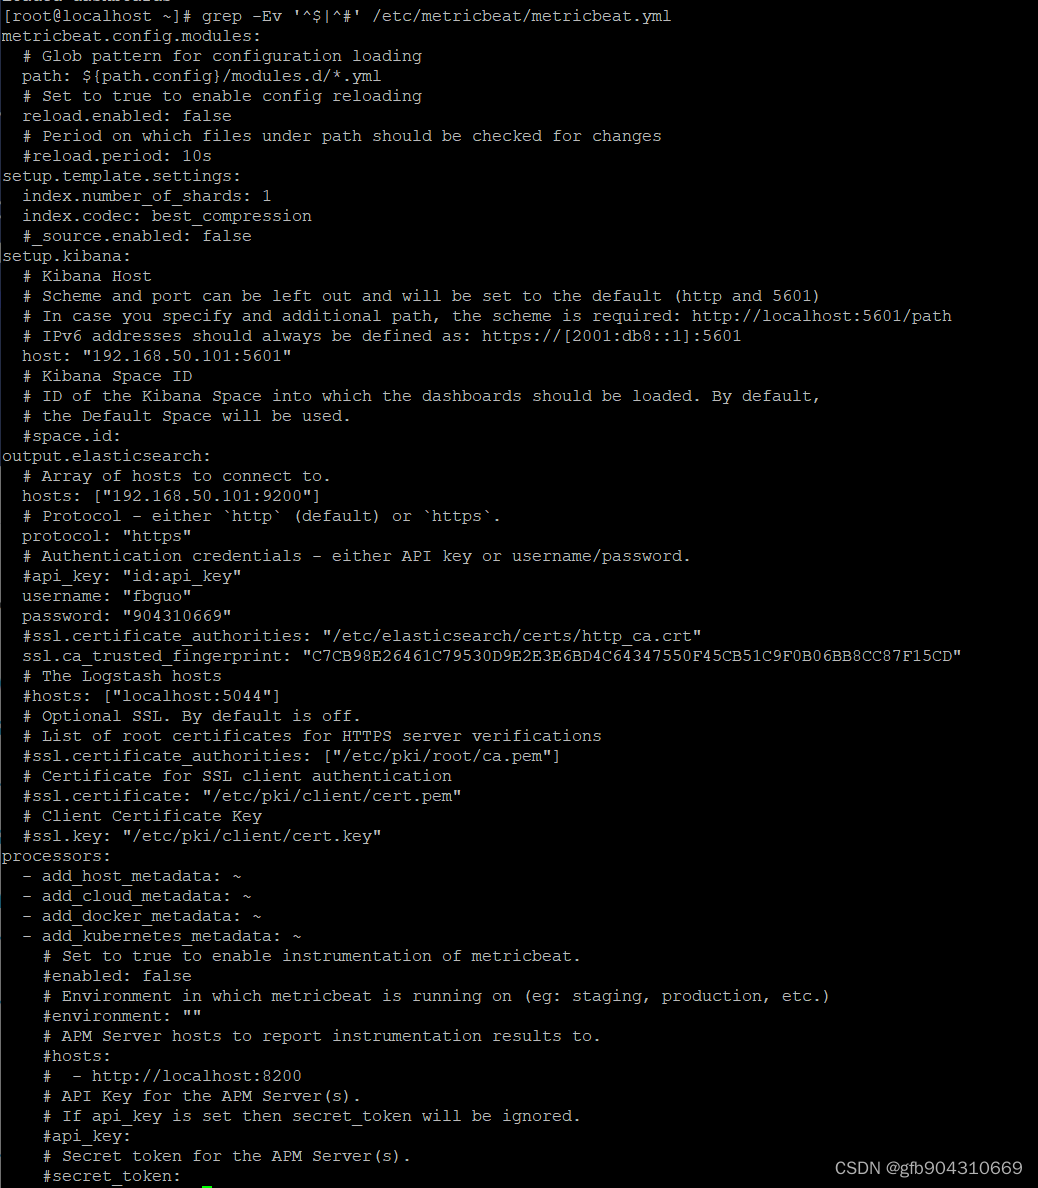
填到metricbeat.yml里
vi /etc/metricbeat/metricbeat.ymlsetup.kibana:host: "192.168.50.101:5601" output.elasticsearch:hosts: ["192.168.50.101:9200"] protocol: "https"username: "fbguo"password: "xxxxxx"ssl.ca_trusted_fingerprint: "C7CB98E26461C79530D9E2E3E6BD4C64347550F45CB51C9F0B06BB8CC87F15CD"效果图:

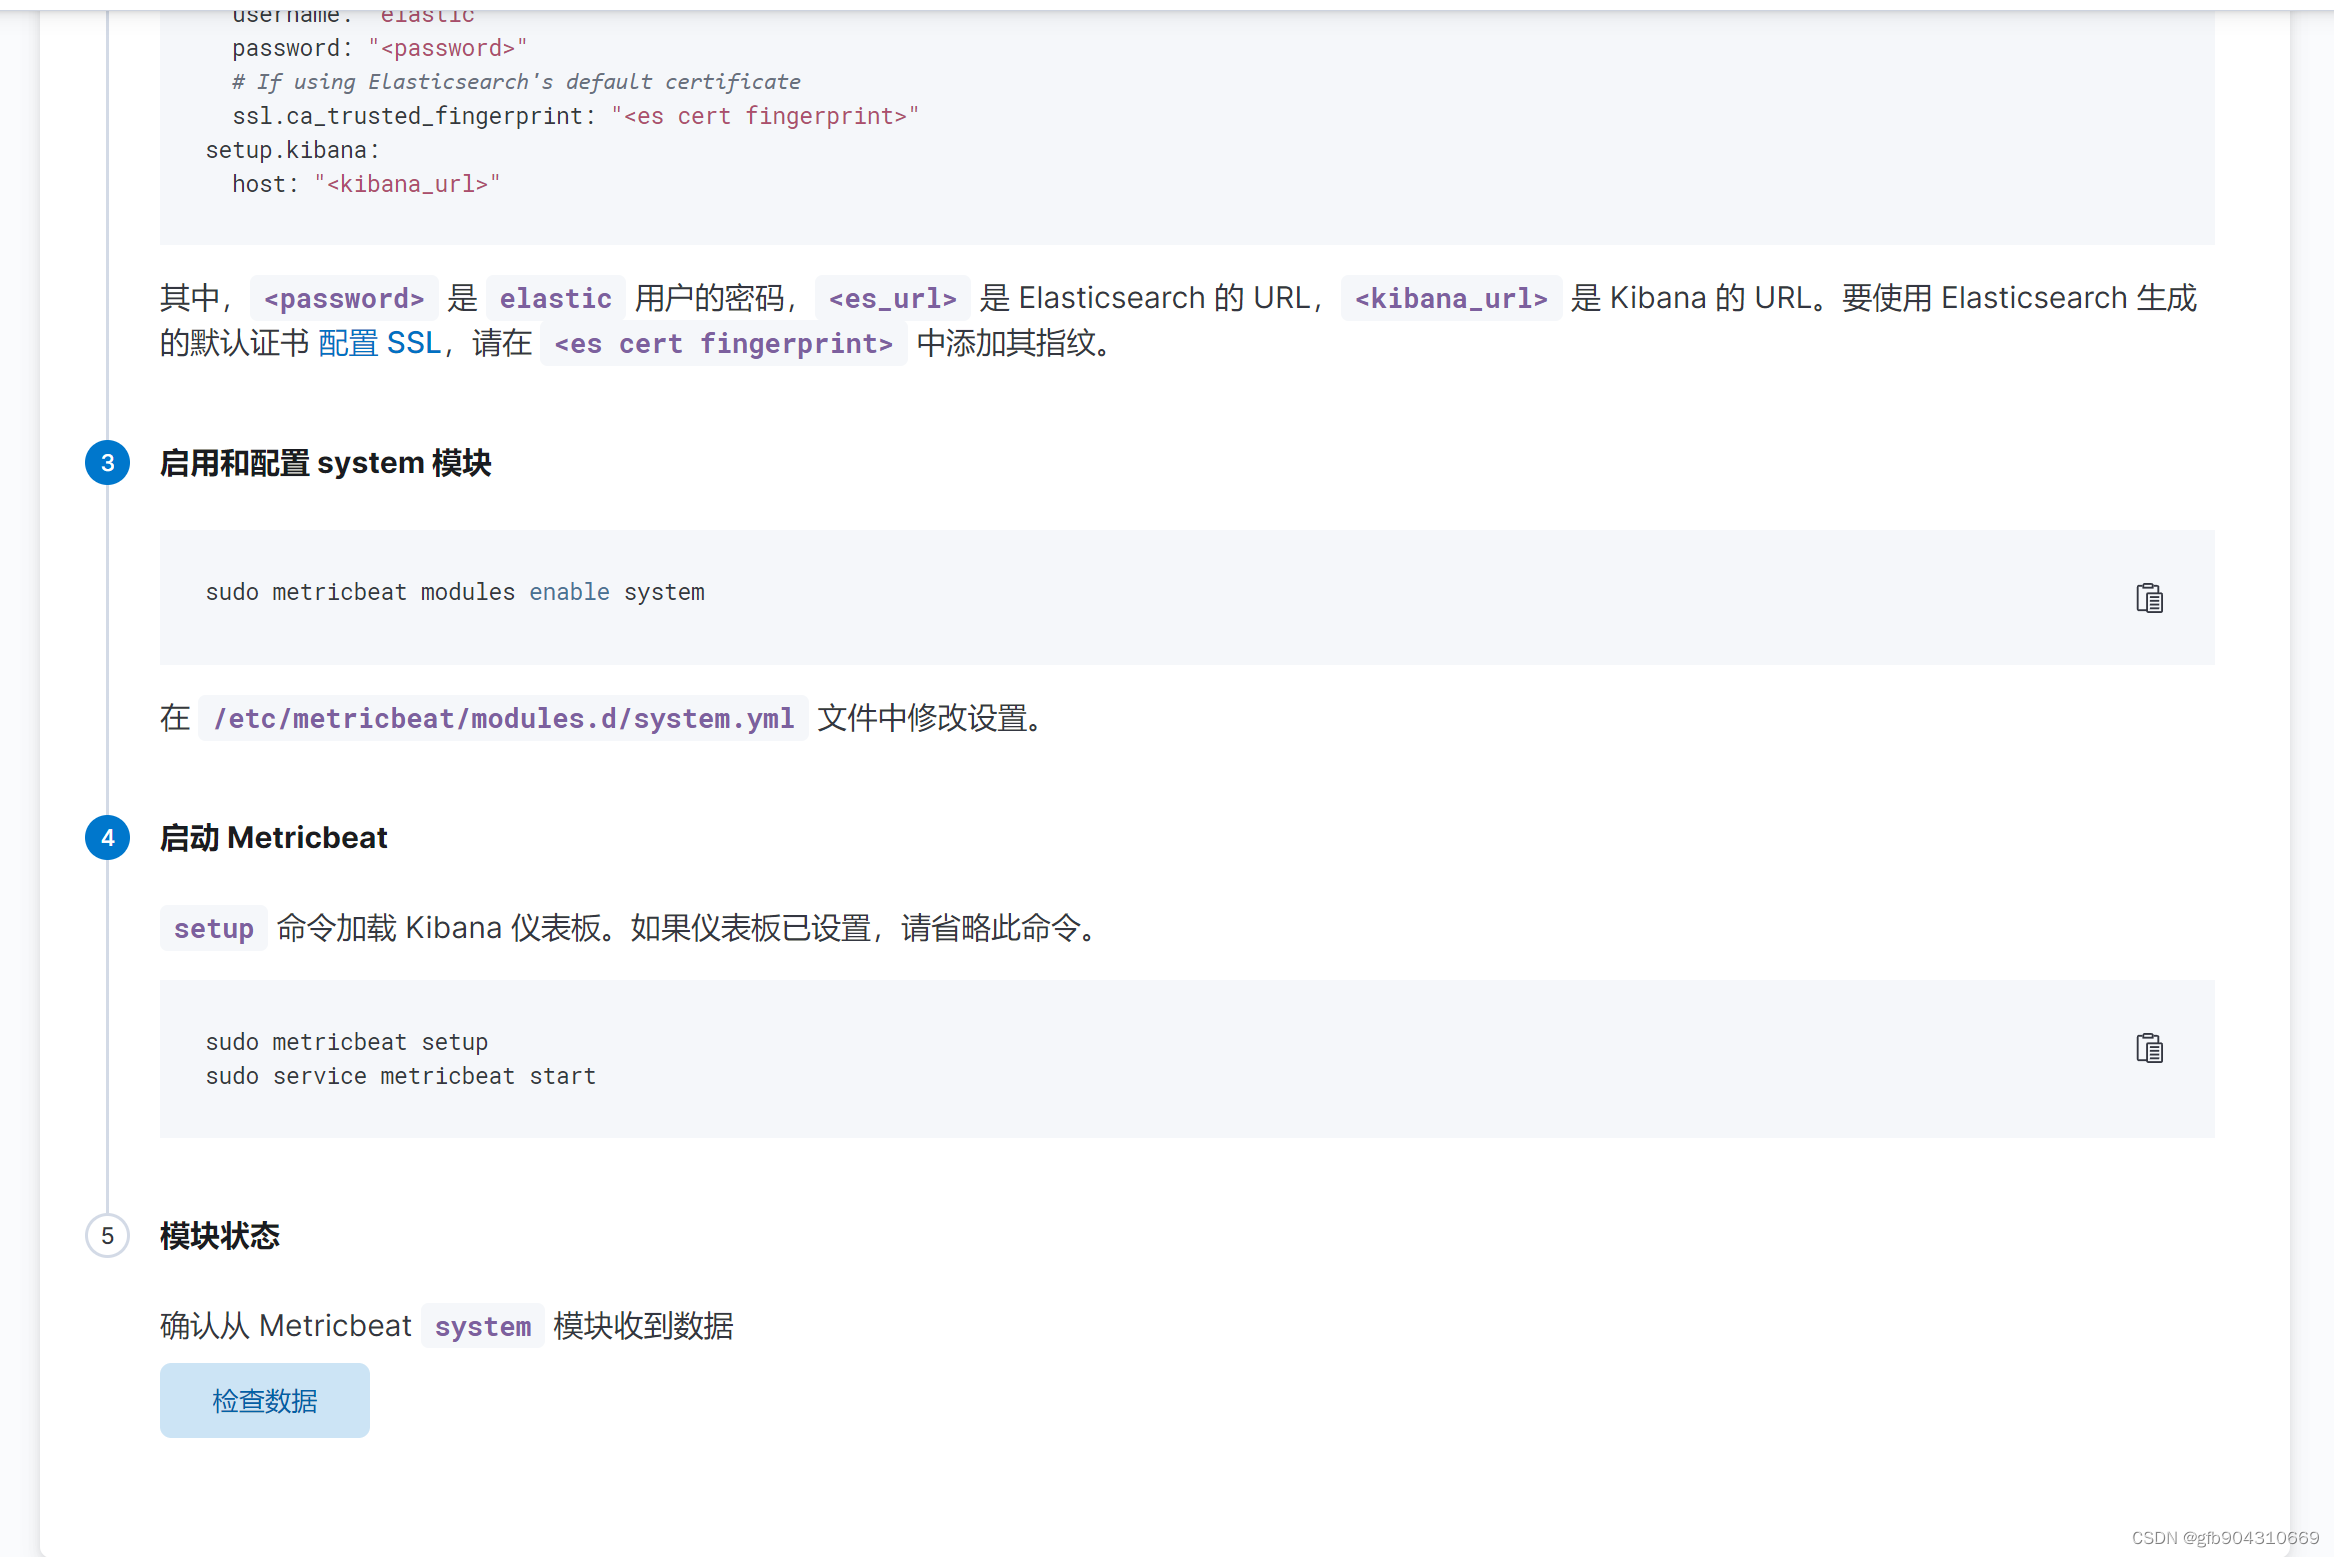
启用SYSTEM模块
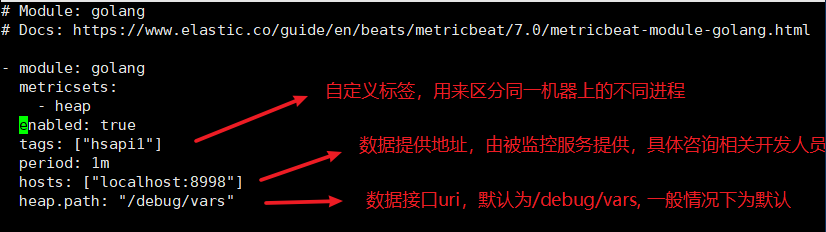
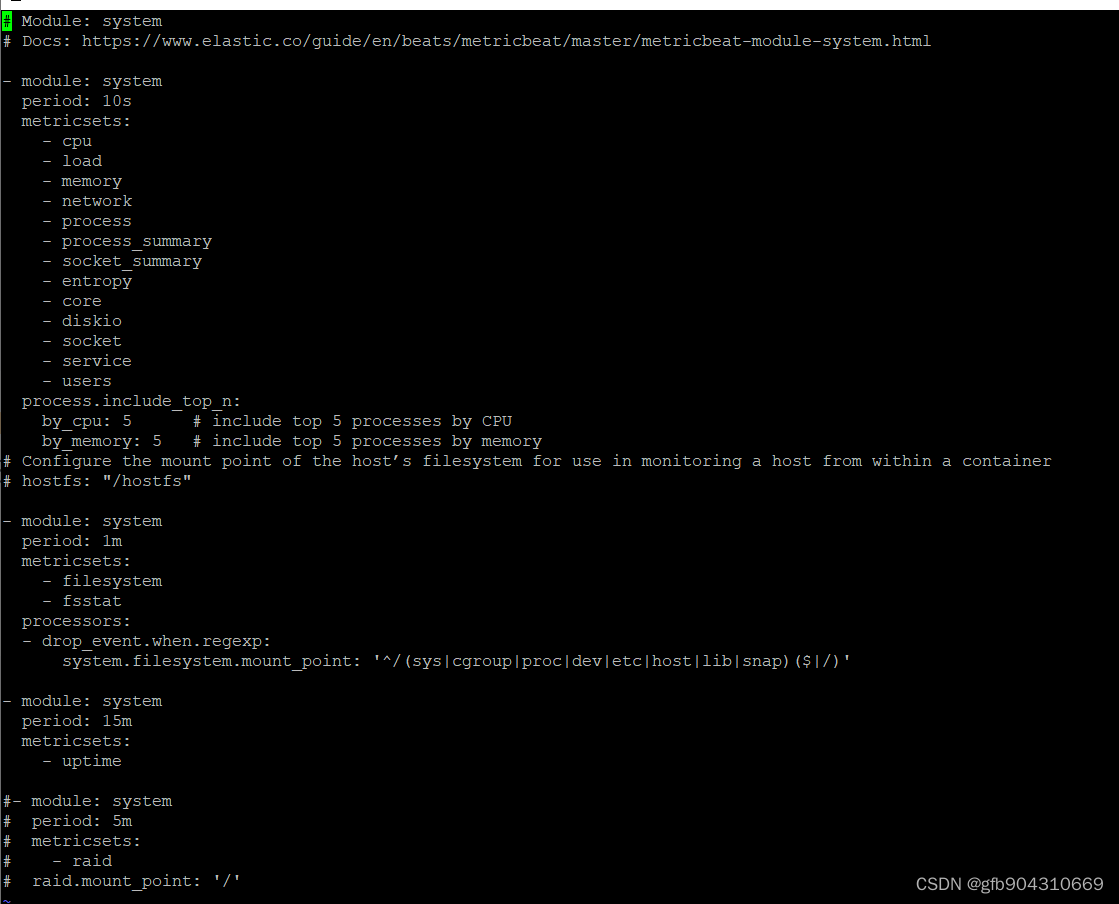
metricbeat modules enable system也可以修改一下SYSTEM抓取的内容
vi /etc/metricbeat/modules.d/system.yml我的效果:
4.启动MetricBeat
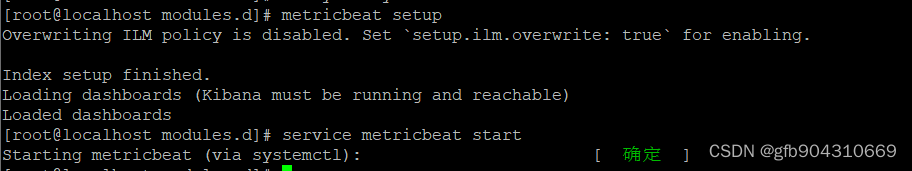
metricbeat setup #初次添加这个Metricbeat模块需要使用这个命令,后面加新机器就不需要了
service metricbeat start #启动
效果
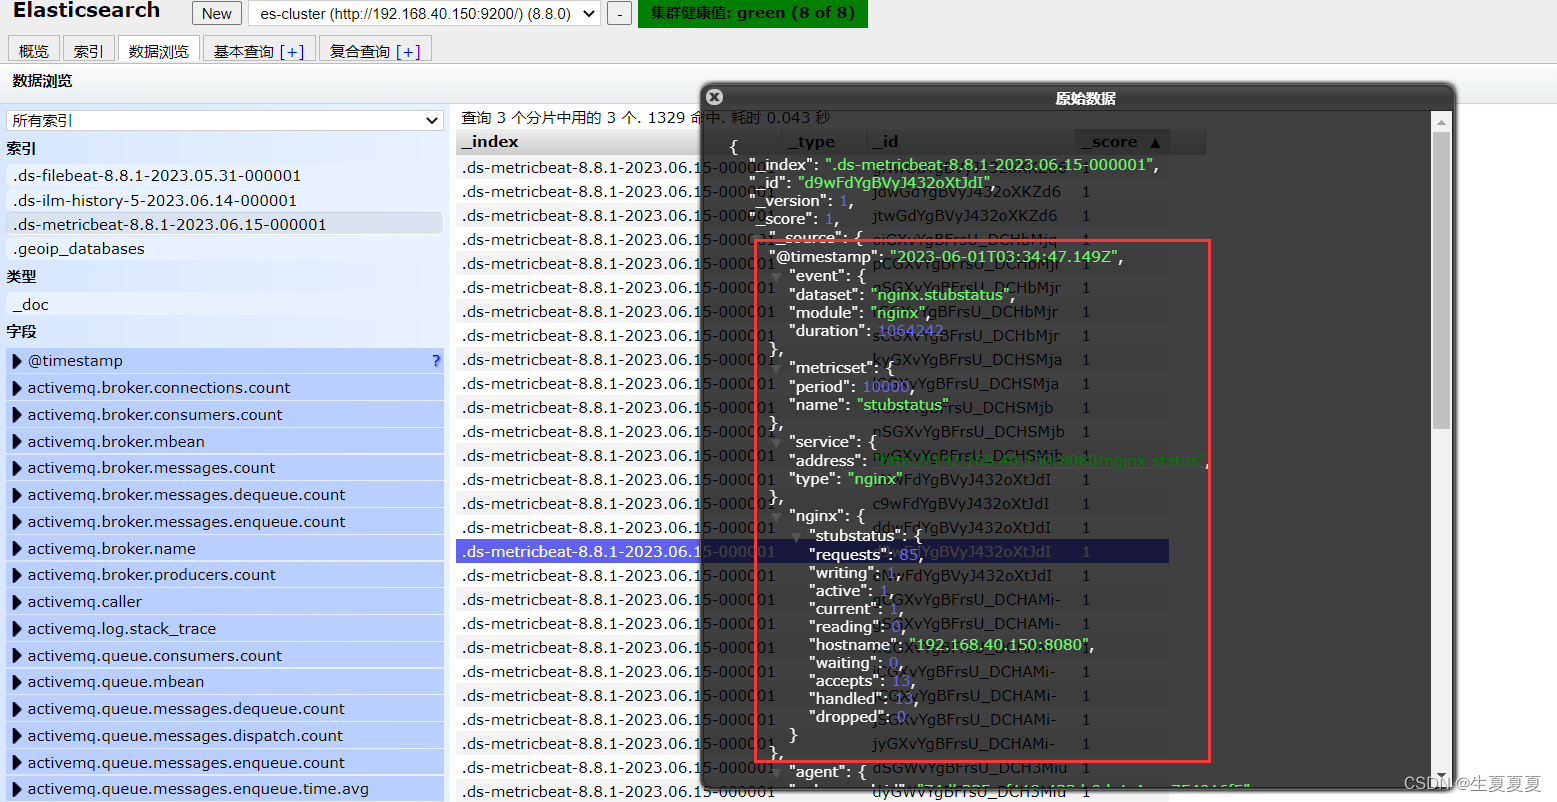
点击浏览器的检查数据
成功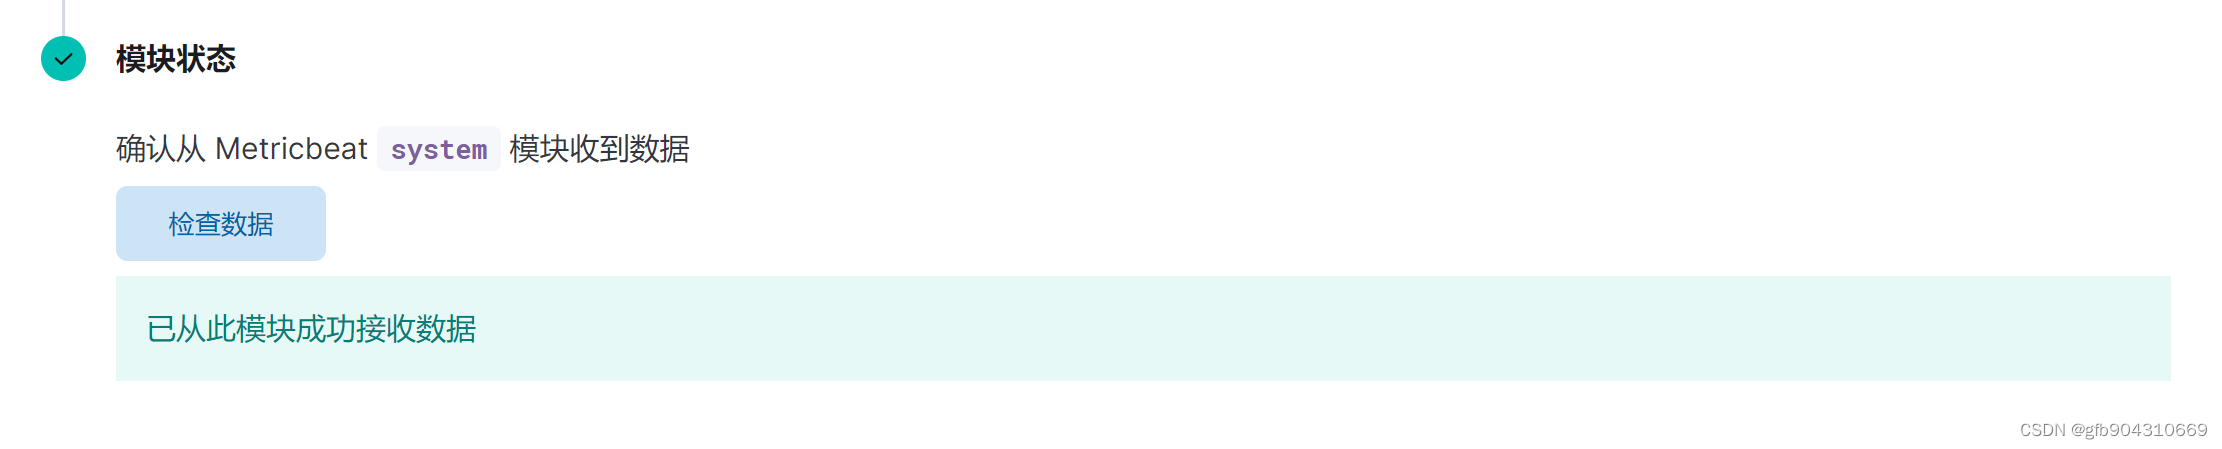
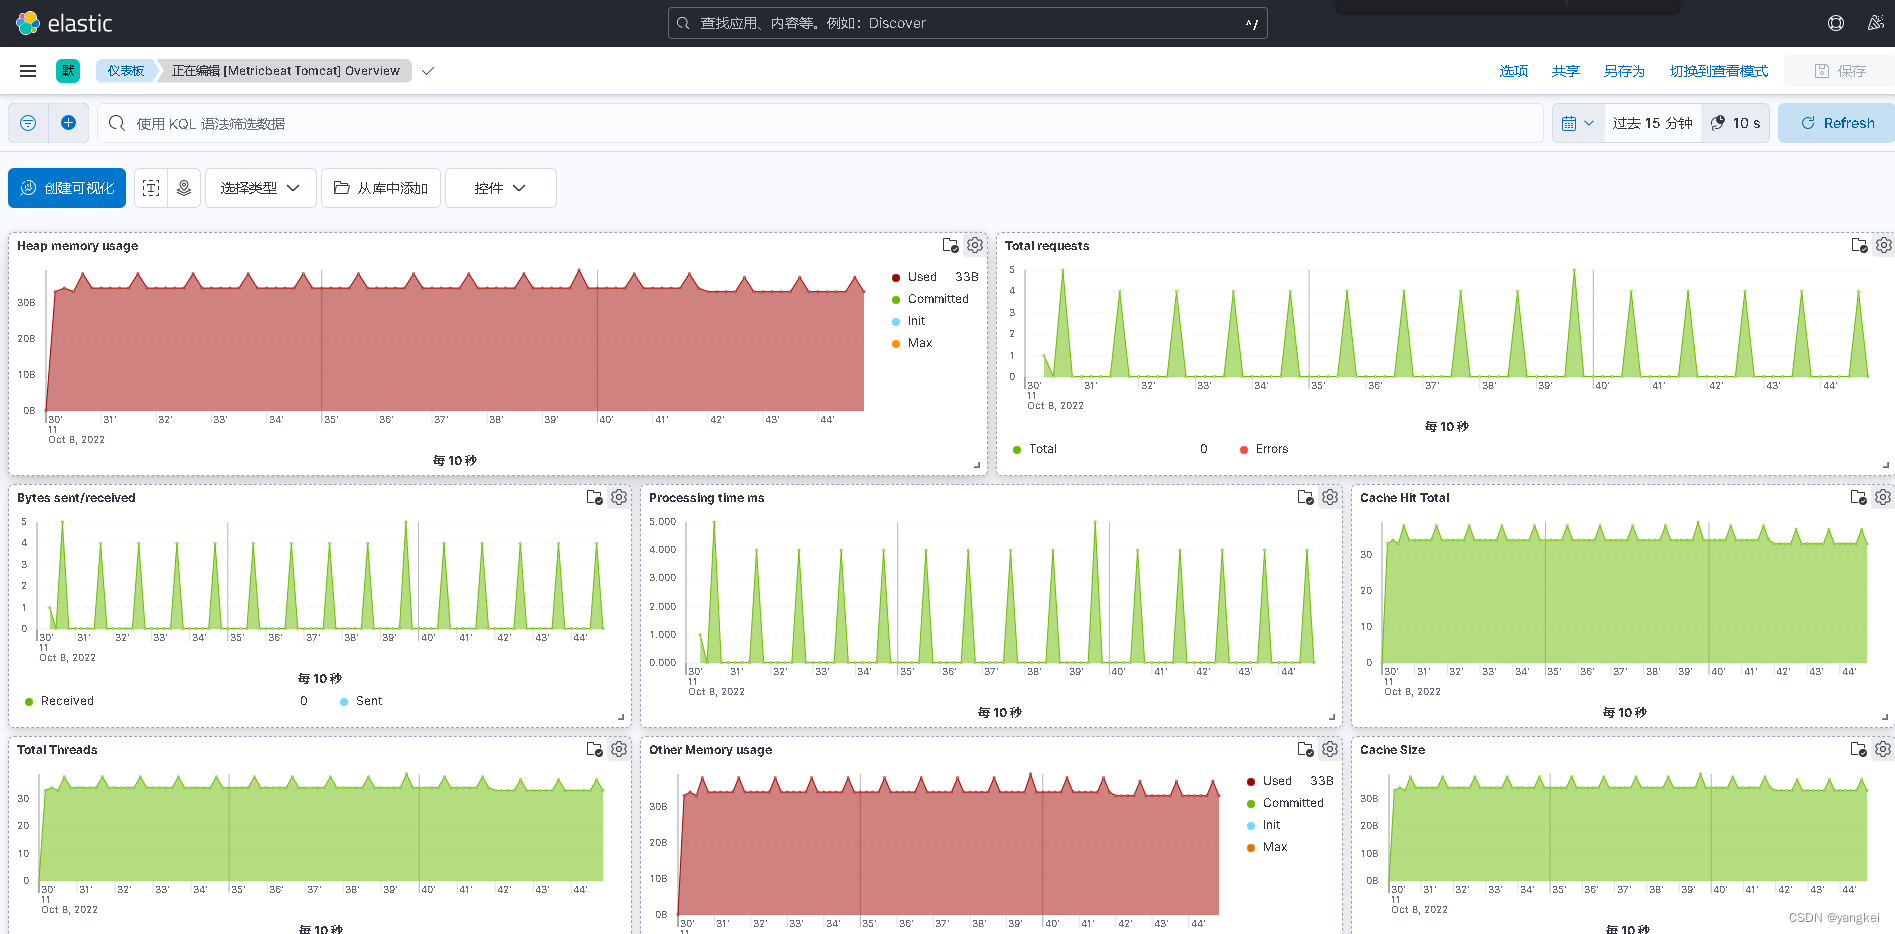
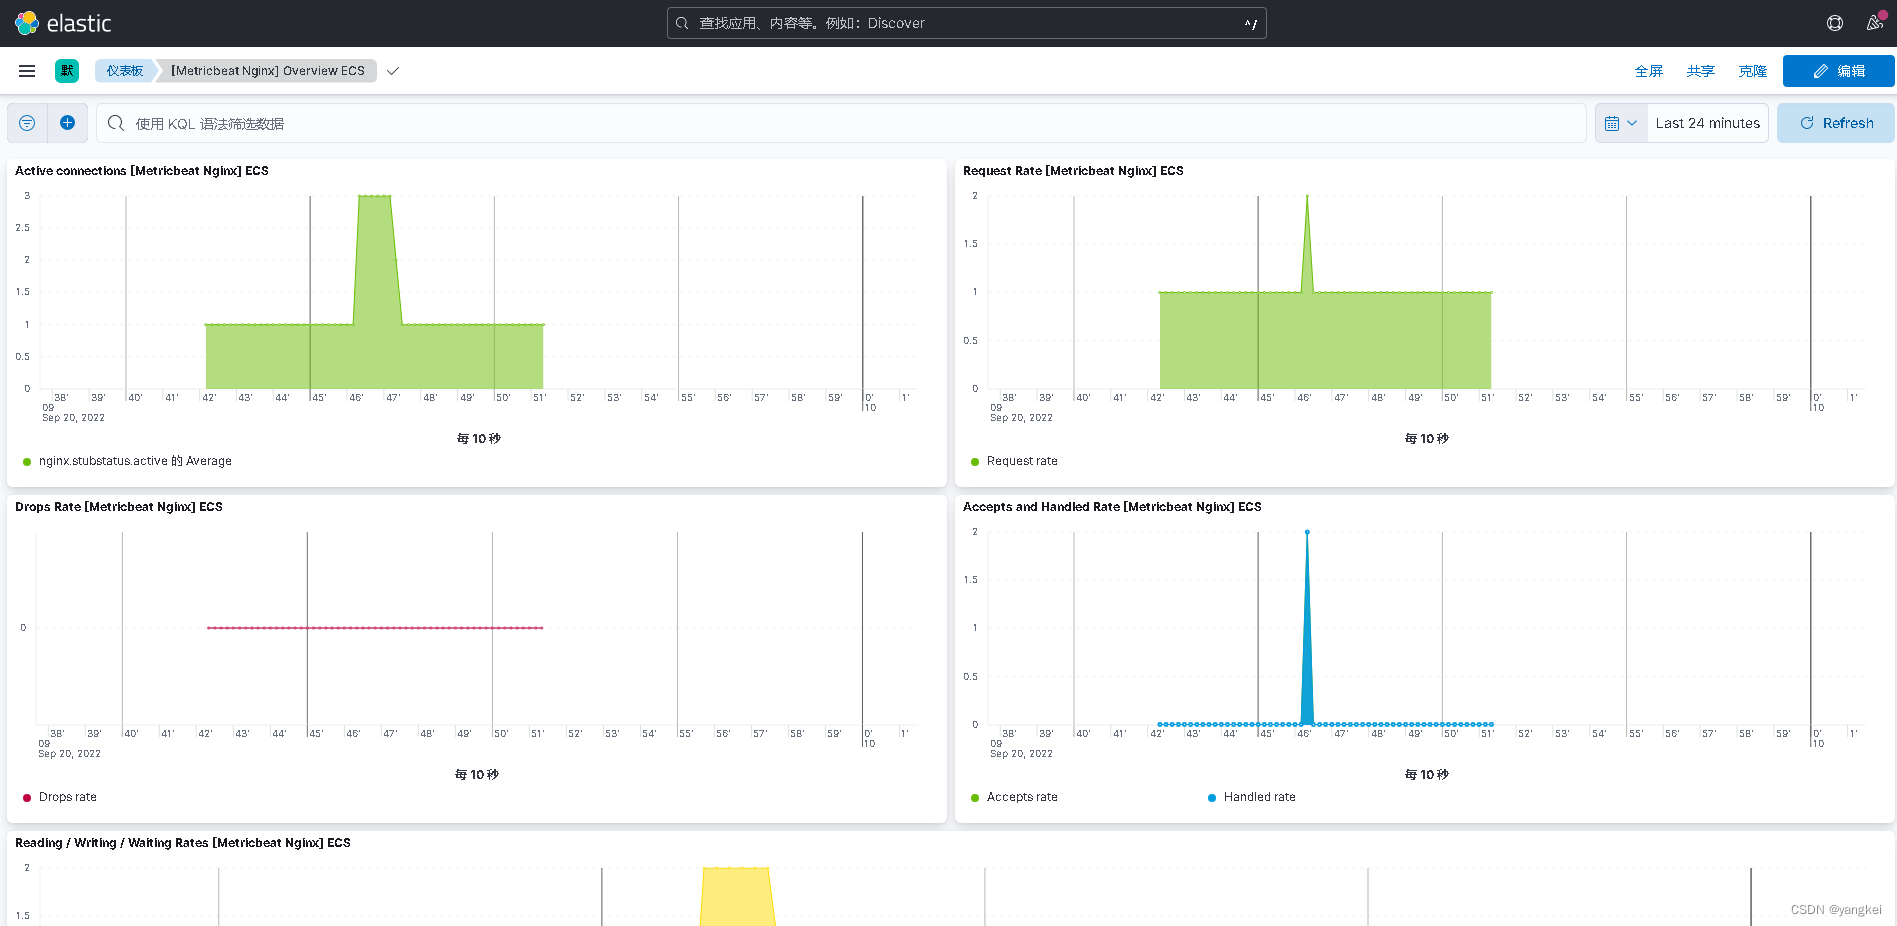
点击系统指标仪表盘

大盘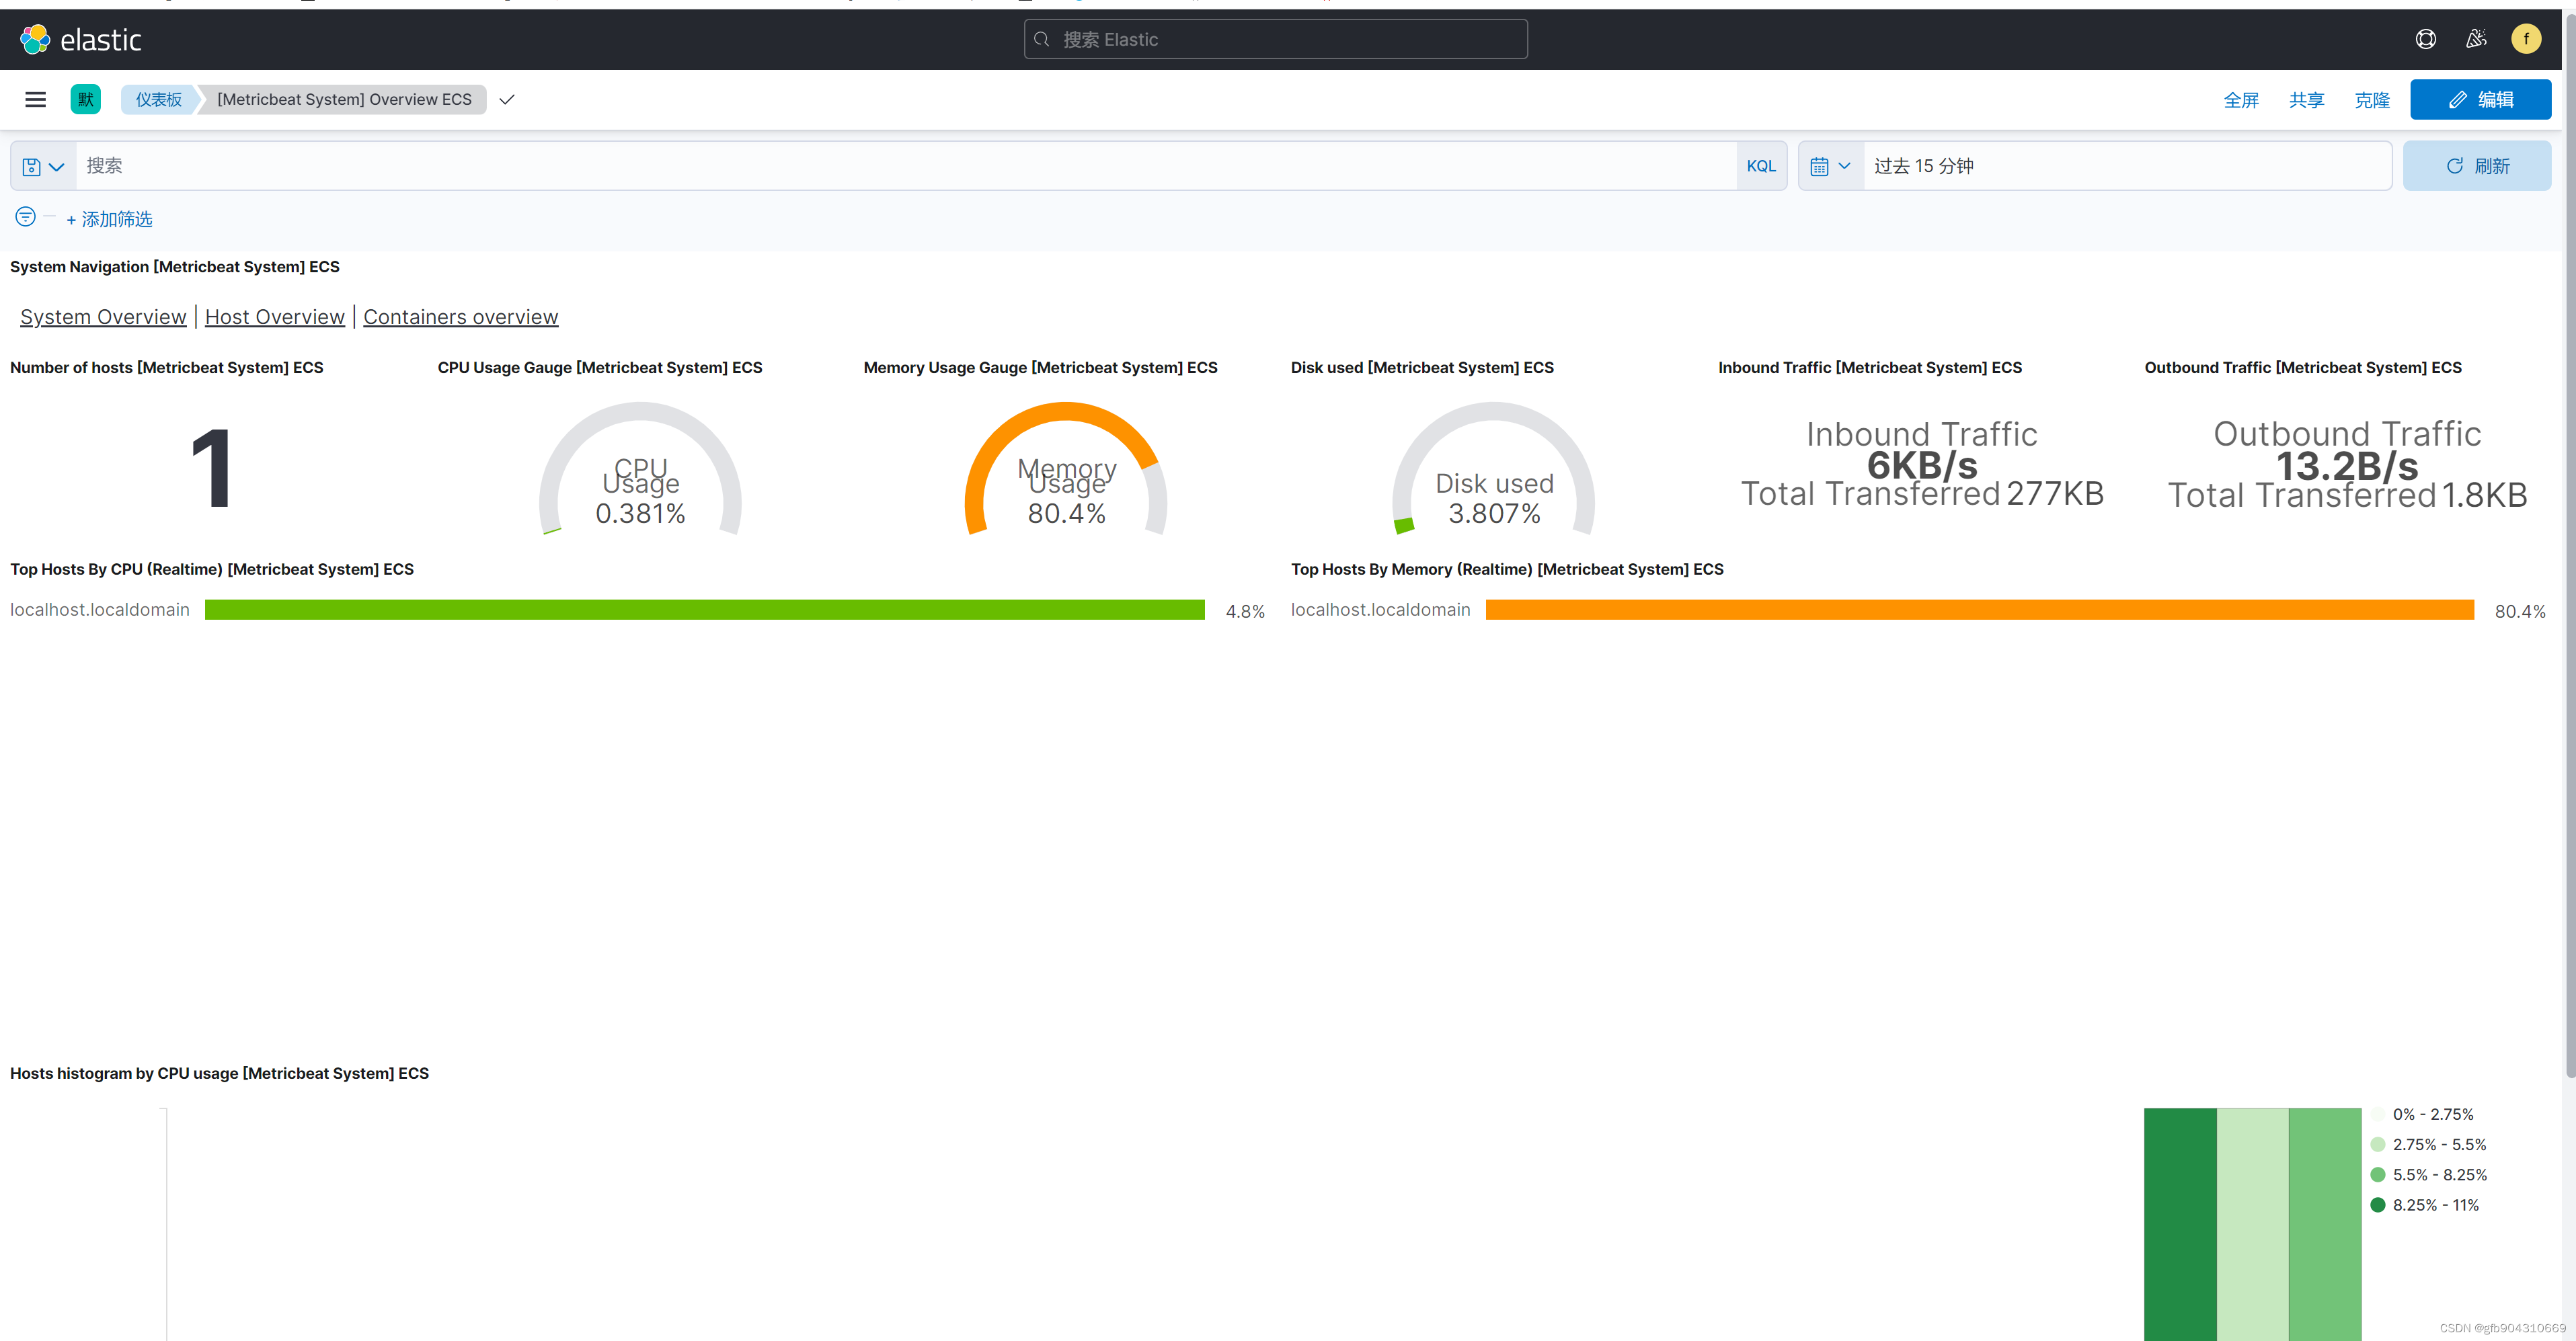
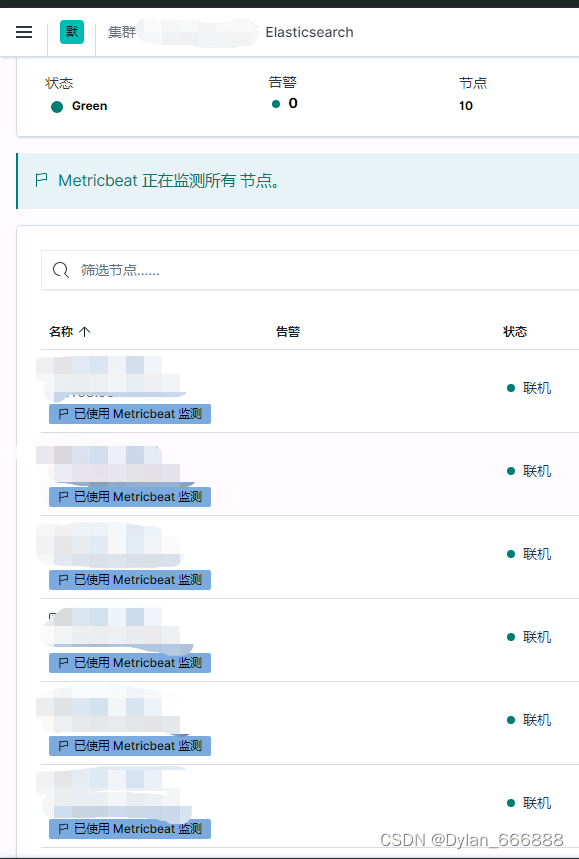
点击单台机
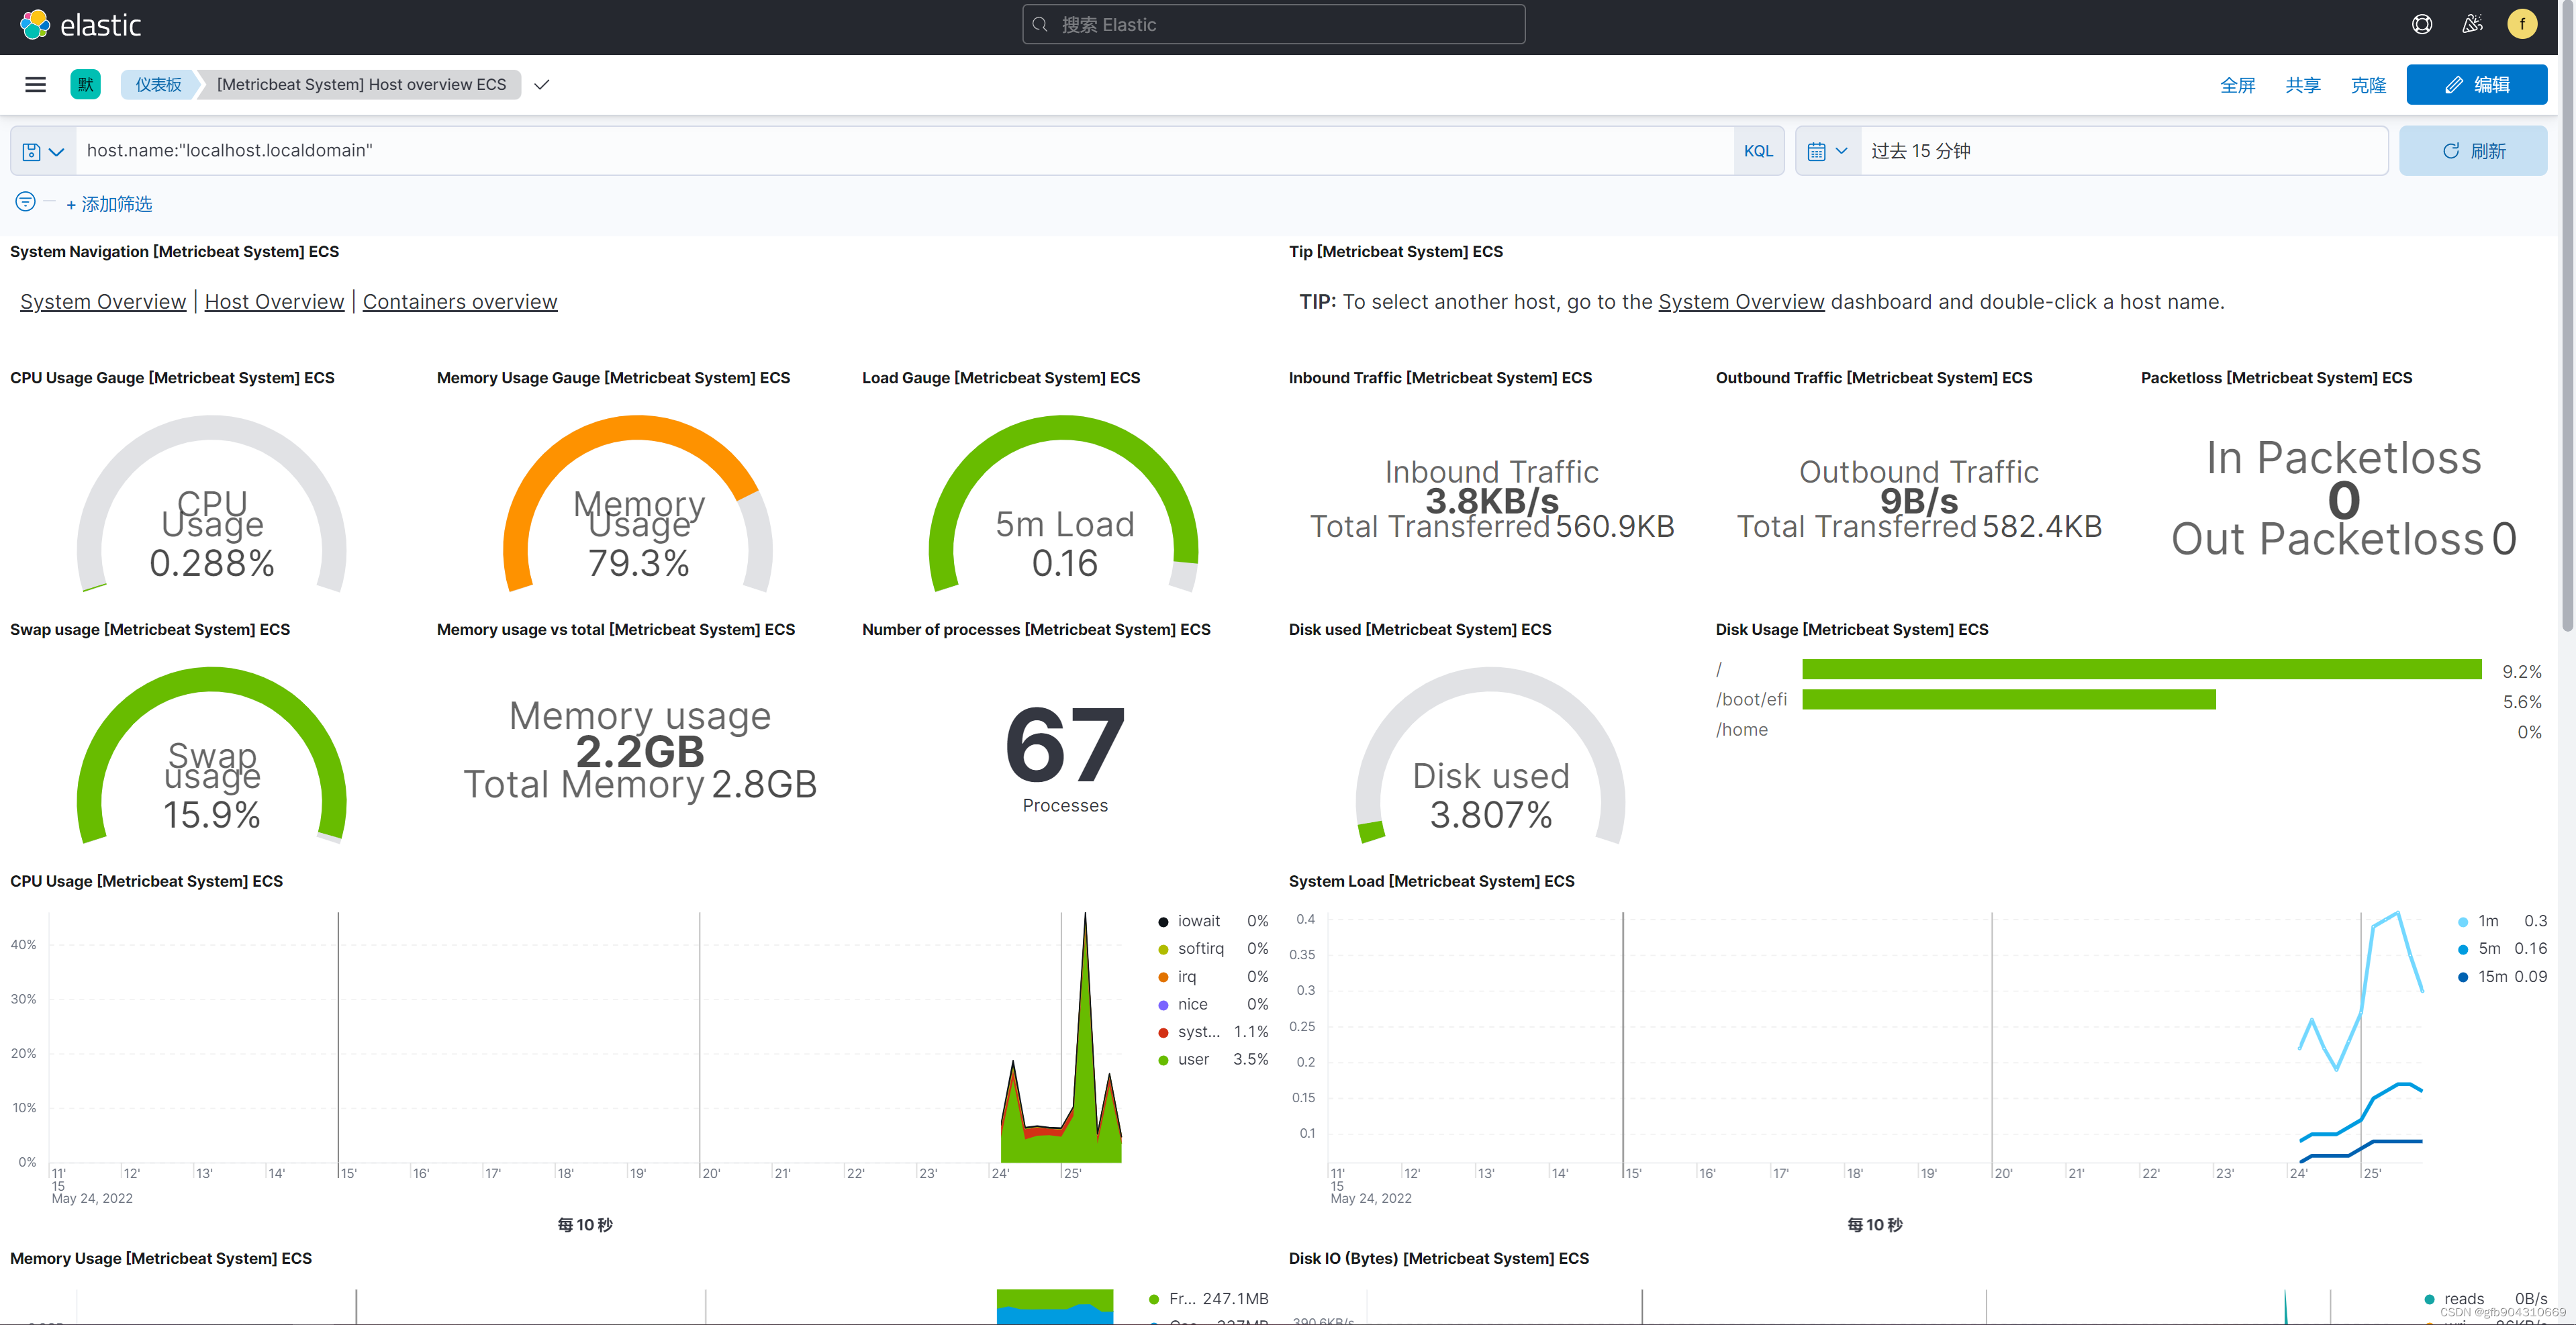
扩展到其他机器只需要安装MetricBeat,复制本机的elasticsearch/certs,编写metricbeat.yml即可
五、遇到过的问题
1.Kibana
取token报错
ERROR: Failed to determine the health of the cluster. Unexpected http status [503]

根源:我是因为配置kibana.yml时候没配置server.name才出现的
解法:配置kibana.yml 的server.name
网上也有说把elasticsearch.yml添加discovery.type: single-node,这个没试过
Kibana Server is not ready yet and Unable to retrieve version information from Elasticsearch nodes. self signed certificate in certificate chain
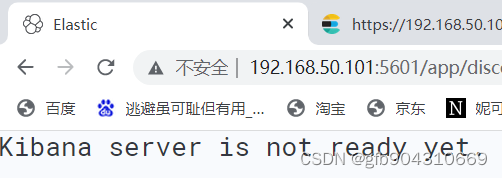
这个要分情况,systemctl status kibana -l 先看一下
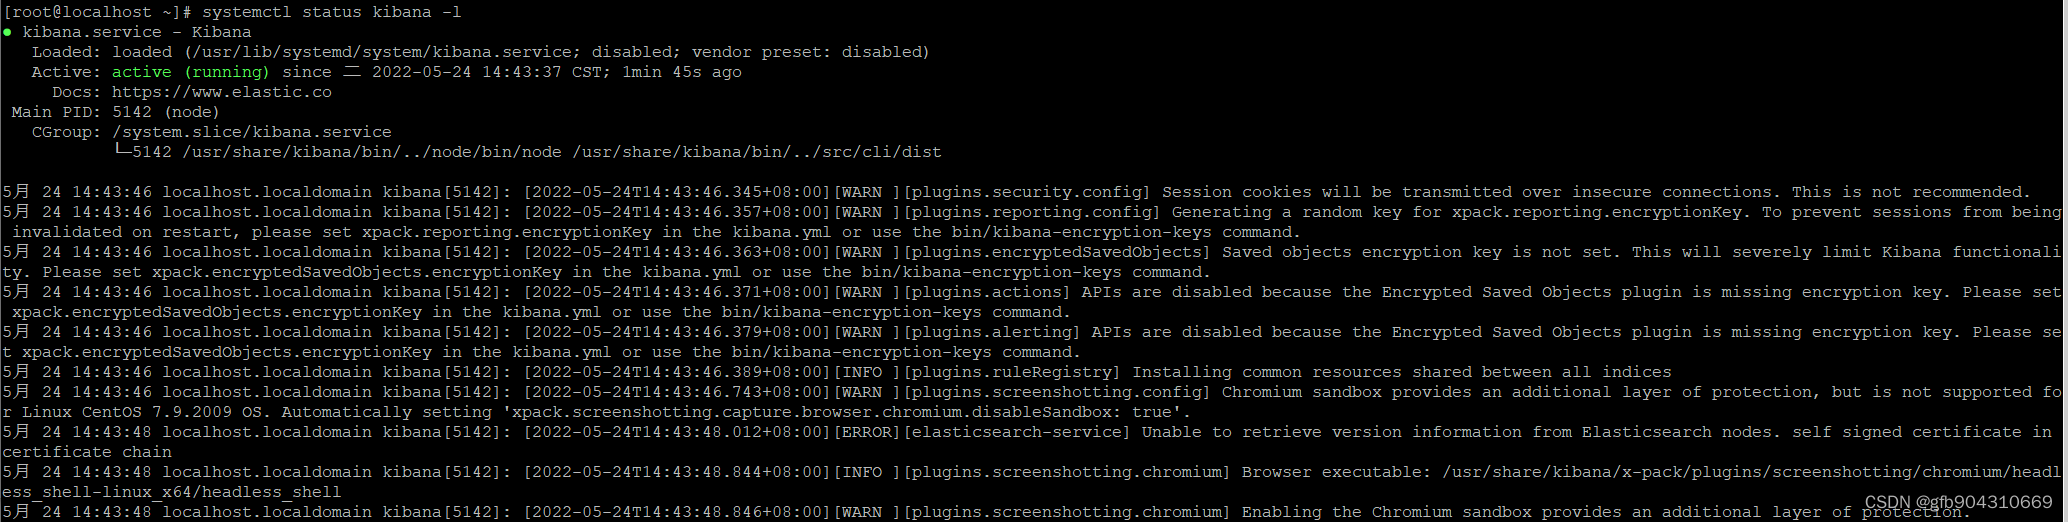
可以看到有个ERROR:
5月 24 14:43:48 localhost.localdomain kibana[5142]: [2022-05-24T14:43:48.012+08:00][ERROR][elasticsearch-service] Unable to retrieve version information from Elasticsearch nodes. self signed certificate in certificate chain
根源:我这边遇到这个问题是因为kibana.yml配多, 只需要配置server.port,server.host,server.name和中文就好,多配了别的就会有这个问题,ELK8.x应该是希望到网页端去配置,比如这个就是多配了elasticsearch.hosts: ["https://192.168.50.101:9200"]
解法:按我的这个配置server.port,server.host,server.name和中文即可,别多配
2.MetricBeat
Exiting: couldn't connect to any of the configured Elasticsearch hosts. Errors: [error connecting to Elasticsearch at https://192.168.50.101:9200: Get "https://192.168.50.101:9200": x509: certificate signed by unknown authority]
根源:我的情况是metricbeat.yml 关于ssl的安全验证什么都没配(ssl.ca_trusted_fingerprint和ssl.certificate_authorities)
解法:我是配ssl.certificate_authorities解决的
配置ssl.ca_trusted_fingerprint问题 Exiting: couldn't connect to any of the configured Elasticsearch hosts. Errors: [error connecting to Elasticsearch at https://192.168.50.101:9200: Get "https://192.168.50.101:9200": decode 'ca_trusted_fingerprint': encoding/hex: invalid byte: U+003A ':']
这个是通过下行命令配的
openssl x509 -fingerprint -sha256 -in /etc/elasticsearch/certs/http_ca.crt效果: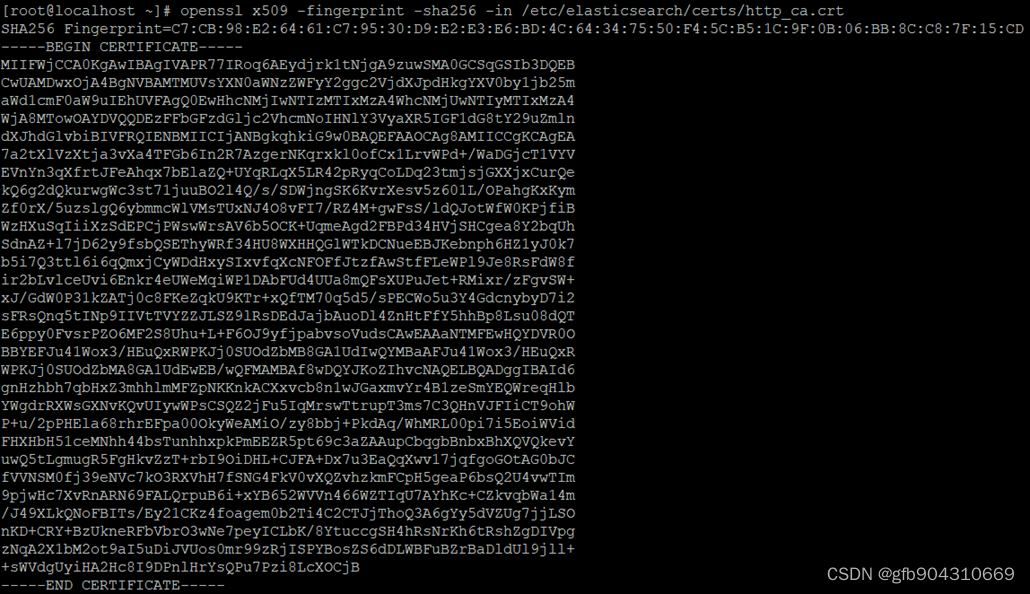
然后我将fingerprint配到metricbeat.yml里
![]()
就会报错
Exiting: couldn't connect to any of the configured Elasticsearch hosts. Errors: [error connecting to Elasticsearch at https://192.168.50.101:9200: Get "https://192.168.50.101:9200": decode 'ca_trusted_fingerprint': encoding/hex: invalid byte: U+003A ':']
解法:我就改成配ssl.certificate_authorities
Update:我发现fingerprint的问题了要把“:”去掉:我这台就应该是C7CB98E26461C79530D9E2E3E6BD4C64347550F45CB51C9F0B06BB8CC87F15CD
总结
后续会在另一台机器上装Logstash和FileBeat