在我做之前的教程 “Observability:Elastic Metrics 应用介绍”,我发现当我尝试启动 MySQL 模块中的 query metricset 会出现错误。之后我发现官方文档也缺少相应的资料。在今天的文章中,我将介绍如上启动这个 metricset。在使用这个 metricset 时需要做相应的配置。在开始之前,如果你对 Beats 模块的启动还不是很清楚的话,请参阅我之前的文章:
- Beats:Beats 入门教程 (一)
- Beats:Beats 入门教程 (二)
简单地说,我们需要使用如下的步骤来进行启动 MySQL 模块:
./metricbeat modules enable mysql我们可以使用如下的命令来检查这个模块是否被启动:
./metricbeat modules modules list
在本次测试中,为了方便,我们只启动 MySQL 模块。我们可以尝试使用如下的命令来检查我们的 MySQL 模块是否配置成功:
./metricbeat test modules mysql
上面显示我们的模块配置是不成功的。我们需要配置 modules.d/mysql.yml
modules.d/mysql.yml
# Module: mysql
# Docs: https://www.elastic.co/guide/en/beats/metricbeat/7.x/metricbeat-module-mysql.html- module: mysqlmetricsets:- status#  - galera_status#  - performance#  - queryperiod: 10s# Host DSN should be defined as "user:pass@tcp(127.0.0.1:3306)/"# or "unix(/var/lib/mysql/mysql.sock)/",# or another DSN format supported by <https://github.com/Go-SQL-Driver/MySQL/>.# The username and password can either be set in the DSN or using the username# and password config options. Those specified in the DSN take precedence.hosts: ["root:1234@tcp(127.0.0.1:3306)/"]# Username of hosts. Empty by default.#username: root# Password of hosts. Empty by default.#password: secret
请注意上面的 1234 是我的 mysql root 用户的密码。我们重新进行测试:
$ ./metricbeat test modules mysql | grep OKstatus...OK上面表示我们的测试是成功的。我们接下来启动 query metricset:
modules.d/mysql.yml

如果我们重新测试的话,我们就会发现有这样的错误:
./metricbeat test modules mysql 
从上面的输出中,我们可以看出来,有一个错误信息。我们需要做更多的配置:
modules.d/mysql.yml
# Module: mysql
# Docs: https://www.elastic.co/guide/en/beats/metricbeat/7.x/metricbeat-module-mysql.html- module: mysqlmetricsets:#  - status#  - galera_status#  - performance- queryperiod: 10snamespace: "my_namespace"# Host DSN should be defined as "user:pass@tcp(127.0.0.1:3306)/"# or "unix(/var/lib/mysql/mysql.sock)/",# or another DSN format supported by <https://github.com/Go-SQL-Driver/MySQL/>.# The username and password can either be set in the DSN or using the username# and password config options. Those specified in the DSN take precedence.hosts: ["root:1234@tcp(127.0.0.1:3306)/"]queries:- query: "SELECT * FROM data.sensors"response_format: "table"query_namespace: "my_first_query_namespace"- query: "SELECT * FROM data.SalesJan2009"response_format: "table"query_namespace: "my_second_query_namespace"# Username of hosts. Empty by default.#username: root# Password of hosts. Empty by default.#password: secret
在上面 data 是我们在 MySQL 中的数据库。sensors 以及 SalesJan2009 是 data 数据库中的表格:

经过上面的配置后,我们重新来进行测试:
$ ./metricbeat test modules mysql
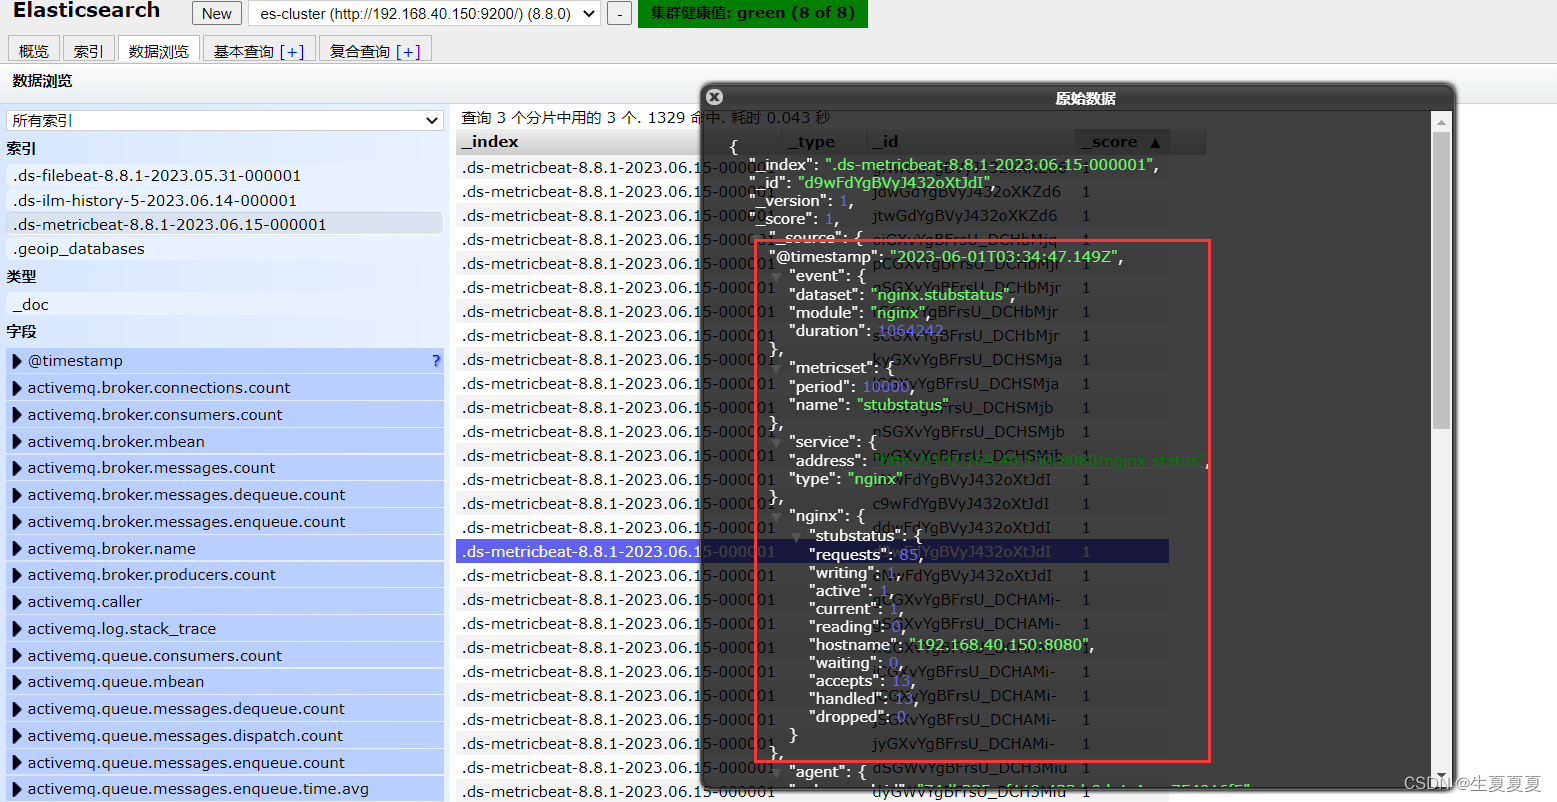
mysql...query...OKresult: {"@timestamp": "2021-03-29T05:24:57.477Z","event": {"dataset": "mysql.query","duration": 8743859,"module": "mysql"},"metricset": {"name": "query","period": 10000},"mysql": {"my_namespace": {"my_first_query_namespace": {"buildingname": "222 Broadway","customer": "Elastic","department": "Engineering","floor": "Floor 1","id": 1,"latitude": 41,"locationonfloor": "Desk 102","longitude": -74,"room": 101,"sensortype": "Temperature"}}},"service": {"address": "tcp(127.0.0.1:3306)/?readTimeout=10s\u0026timeout=10s\u0026writeTimeout=10s","type": "mysql"}}从上面的输出中,我们可以看出来我们的测试是成功的。
接下来我们使用如下的配置 Metricbeat:
./metricbeat setup$ ./metricbeat setup
Overwriting ILM policy is disabled. Set `setup.ilm.overwrite: true` for enabling.Index setup finished.
Loading dashboards (Kibana must be running and reachable)
Loaded dashboards我们使用如下的命令来启动 Metricbeat:
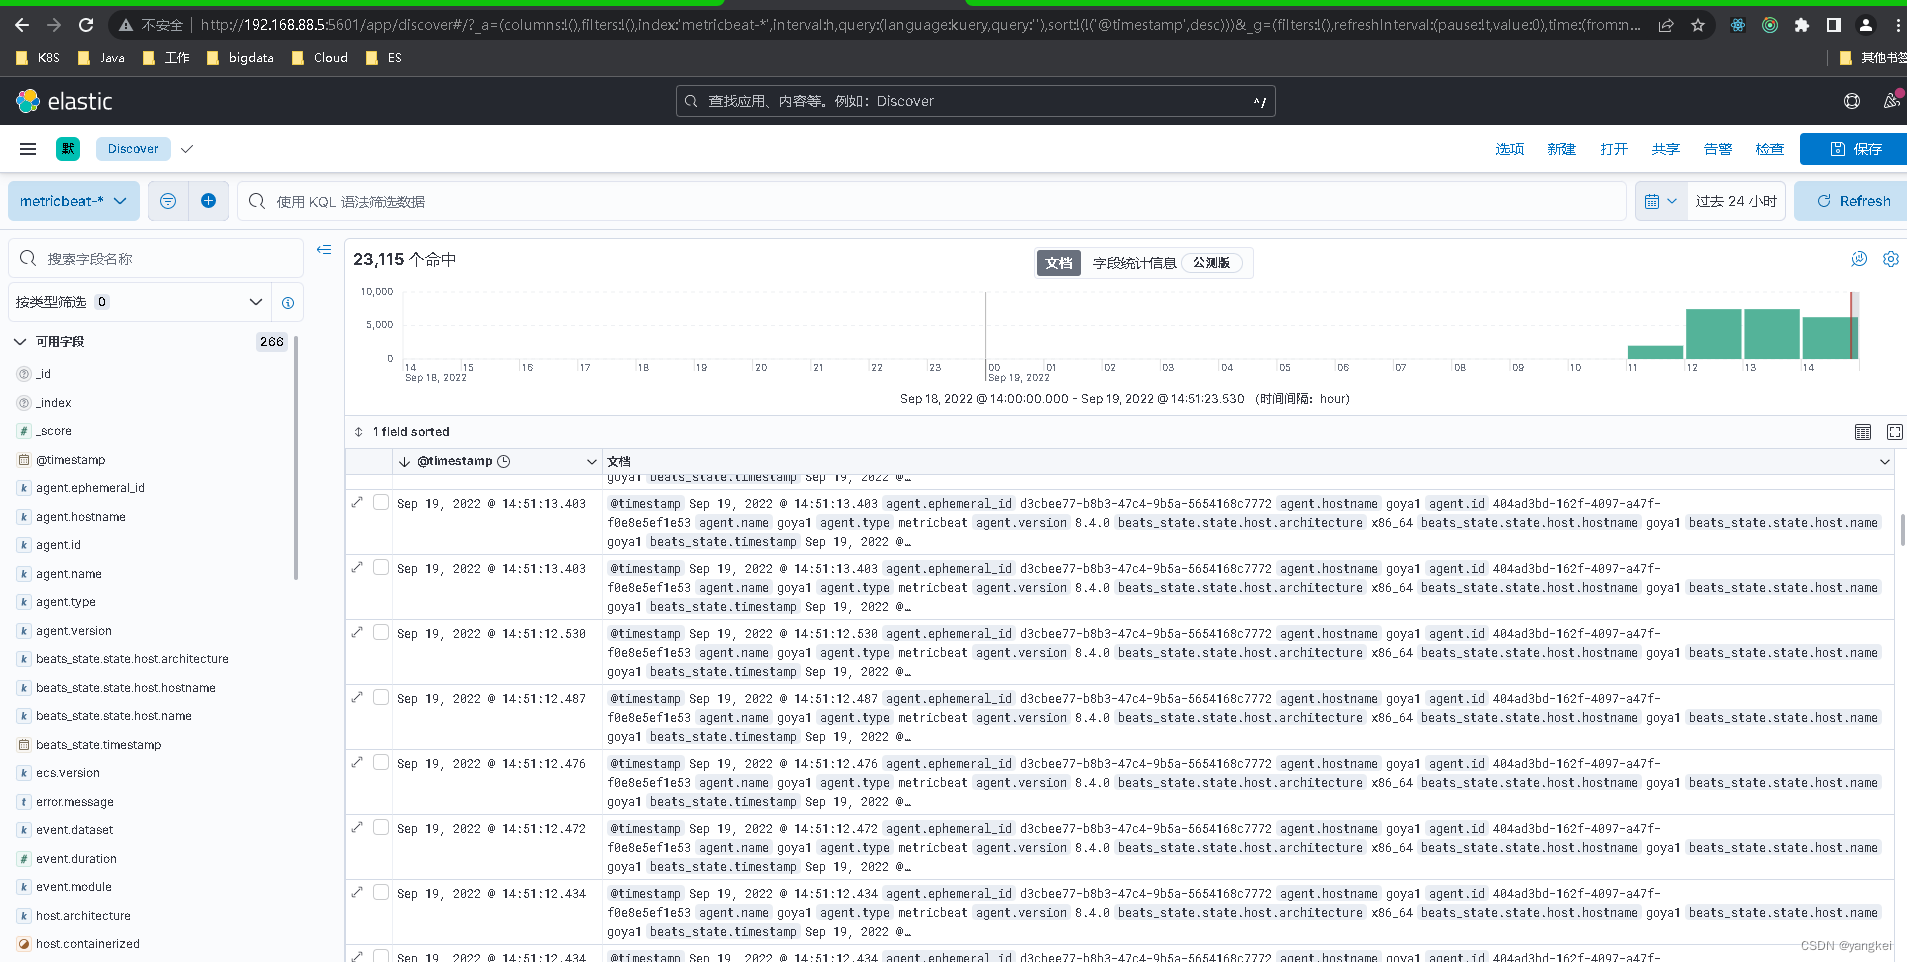
./metricbeat -e我们在 Discover 中可以看到如下的数据:


从上面我们可以看出来。event.dataset 来自 mysql.query 还是有蛮多的数据的。