一、kibana
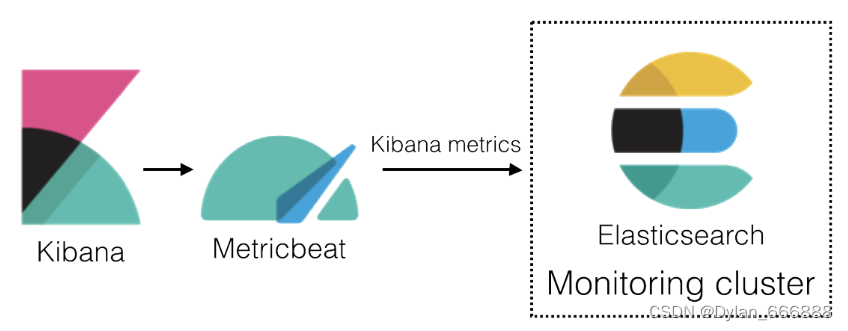
1、下载metricbeat并部署到kibana所在的服务器
2、禁用 Kibana 监控指标的默认集合,在kibana.yml文件中增加如下配置:
monitoring.kibana.collection.enabled: false
3、从控制台或命令行,在生产集群上设置xpack.monitoring.collection.enabled 为true(这里以kibana控制台为例)
PUT _cluster/settings
{"persistent": {"xpack.monitoring.collection.enabled": true}
}
4、Metricbeat 中启用 Kibana X-Pack 模块,在metricbeat目录下执行
./metricbeat modules enable kibana-xpack
5、修改modules.d/kibana-xpack.yml文件(这里启用了elastic安全功能,所以添加了账号密码)
- module: kibanametricsets:- statsperiod: 10shosts: ["kibana_ip:5601"]#basepath: ""username: "user"password: "secret"xpack.enabled: true
6、这里参考官网,禁用Metricbeat 中的系统模块。
metricbeat modules disable system
7、配置将监控数据发送到何处
Metricbeat 配置文件 ( metricbeat.yml) 中指定 Elasticsearch 输出信息(配了一个主节点也行)
output.elasticsearch:# Array of hosts to connect to.hosts: ["ip:9200", "ip:9200"] # Optional protocol and basic auth credentials.#protocol: "https"#username: "elastic"#password: "changeme"
8、重启kibana
启动metricbeat
nohup ./metricbeat -e -c metricbeat.yml -d "publish" & > nohup.out
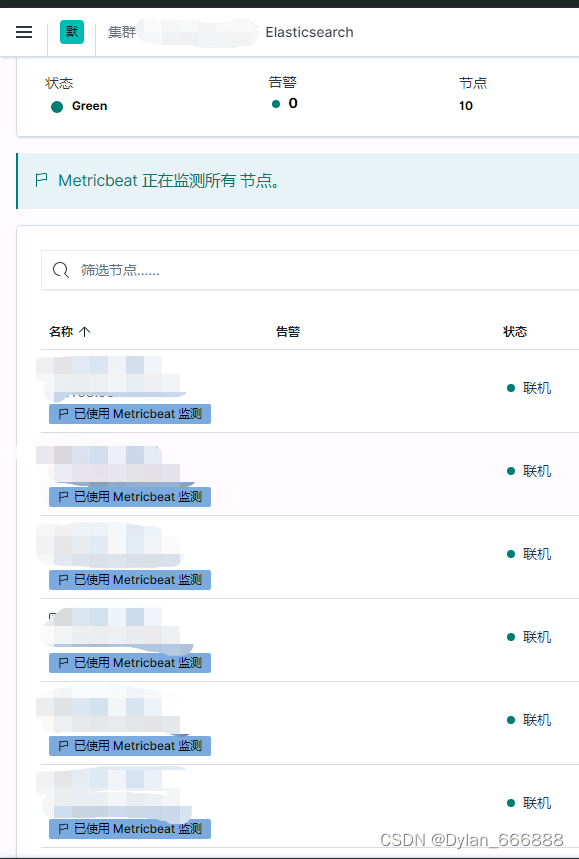
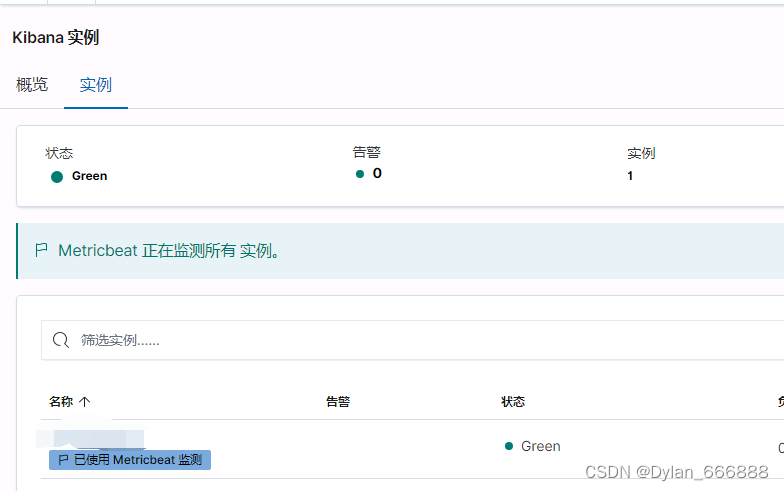
结果
二、elasticsearch节点(一台机器如果部署多个es节点只需要部署一个metricbeat收集多个es节点监控数据)
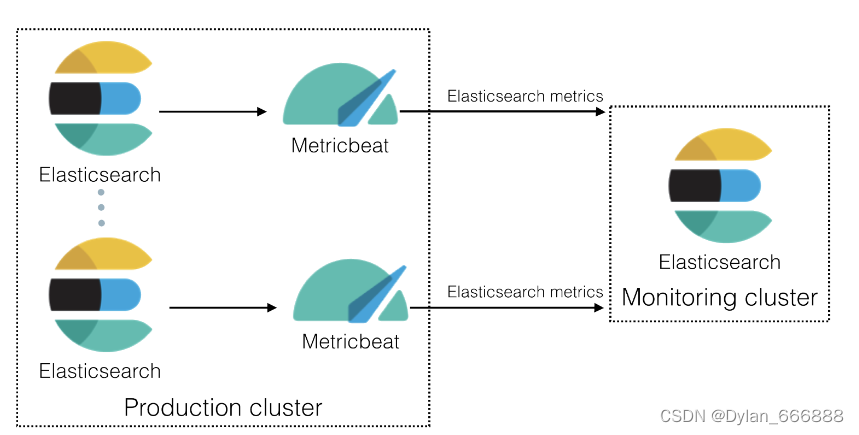
1、下载并部署metricbeat到每个elasticsearch节点
2、在 Metricbeat 中启用并配置 Elasticsearch x-pack 模块
./metricbeat modules enable elasticsearch-xpack
3、修改metricbeat.yml(开启了elastic安全认证的需要配置账号密码)
output.elasticsearch:hosts: ["http://localhost:9200"] ## Monitoring cluster# Optional protocol and basic auth credentials.#protocol: "https"username: "elastic"password: "changeme"
4、修改modules.d/elasticsearch-xpack.yml(如果有多个节点在这里配置多个节点的ip)
# Module: elasticsearch
# Docs: https://www.elastic.co/guide/en/beats/metricbeat/7.13/metricbeat-module-elasticsearch.html- module: elasticsearchxpack.enabled: trueperiod: 10shosts: ["http://ip:9200"]username: "username"password: "passwd"
5、启动
nohup ./metricbeat -e -c metricbeat.yml -d "publish" & > nohup.out
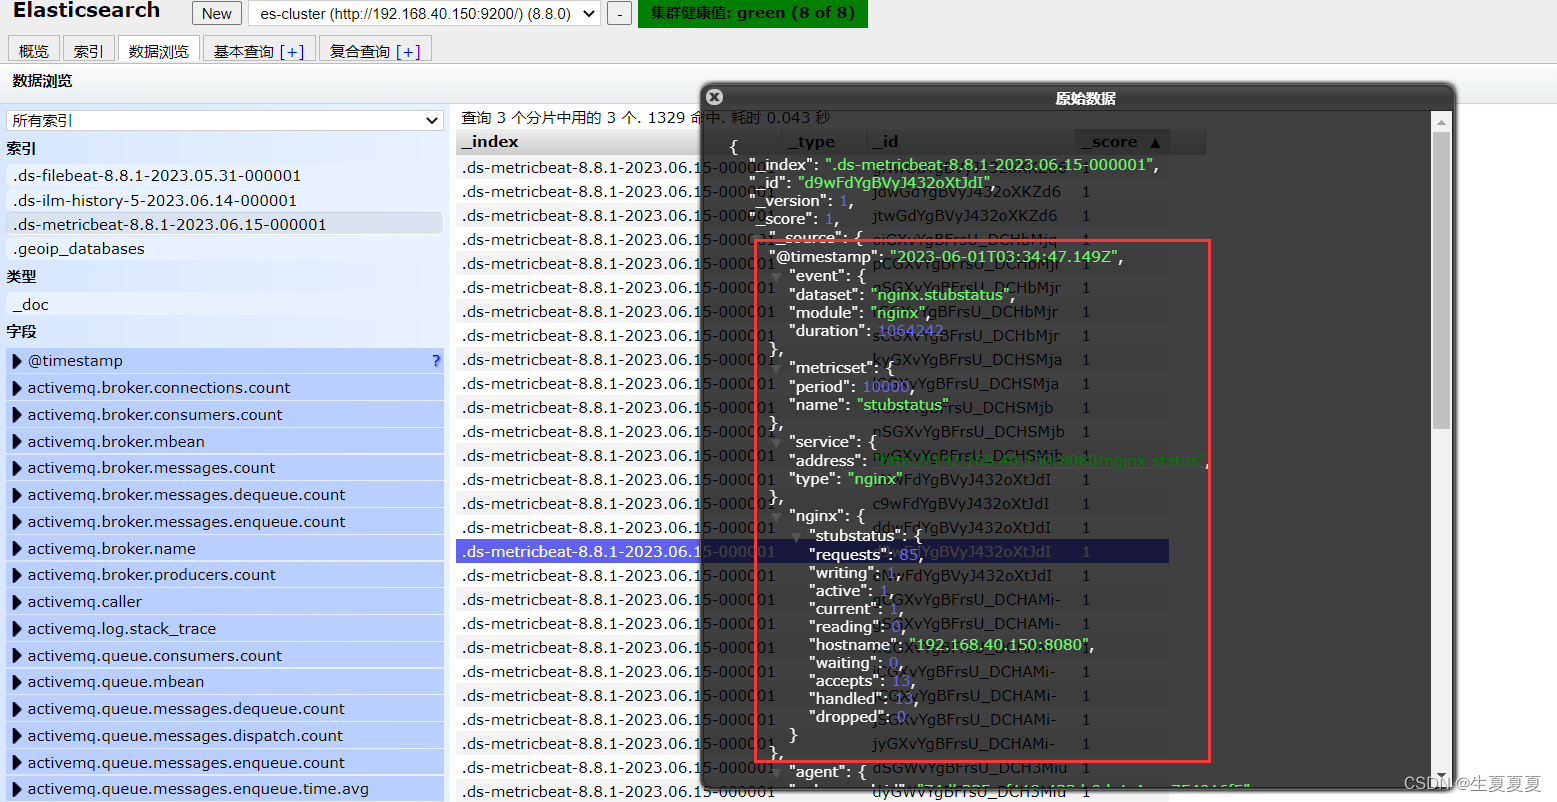
结果