1 情况说明:
Metricbeat的基本安装部分可以参考:
Metricbeat 8.4.0 linux 安装(Metricbeat-part1)_yangkei的博客-CSDN博客
下面来聊聊如何通过elk+metricbeat来监控Nginx日志。
借用网上以为大师的图就是这样子
Metricbeat 采集 Nginx 指标_叶康铭的博客-CSDN博客

在 Nginx 中相关的状态页面需要通过打开 http_stub_status_module 这个模块获取,在编译 Nginx 时,通过加上--with-http_stub_status_module 进行打开,对应的访问/nginx_status页面就可以获取的 Nginx 的服务状态了。
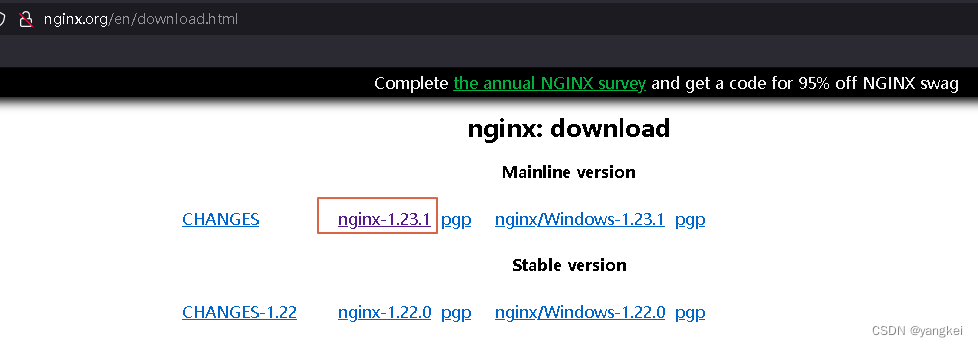
2 Nginx安装:
参考Nginx安装步骤:
【Web】Nginx下载与安装 - H__D - 博客园
下载当前最新版本1.23.1,上传安装包。
安装相应的4个依赖包:
yum -y install gcc zlib zlib-devel pcre-devel openssl openssl-devel
创建安装目录:
mkdir -p /app/nginx
解压,安装
cd /app/install/
tar -xzvf nginx-1.23.1.tar.gz
cd /app/install/nginx-1.23.1
./configure --prefix=/app/nginx --with-http_stub_status_module
make
make install
检查版本:(用root用户启动,避免权限问题)
[root@goya1 sbin]# pwd
/app/nginx/sbin
[root@goya1 sbin]# ./nginx -v
nginx version: nginx/1.23.1
[root@goya1 sbin]# ./nginx
[root@goya1 sbin]# ps -ef |grep nginx
root 58789 1 0 15:58 ? 00:00:00 nginx: master process ./nginx
nobody 58790 58789 0 15:58 ? 00:00:00 nginx: worker process
root 58793 9323 0 15:59 pts/2 00:00:00 grep --color=auto nginx
修改属组权限:
chown -R es.es nginx/
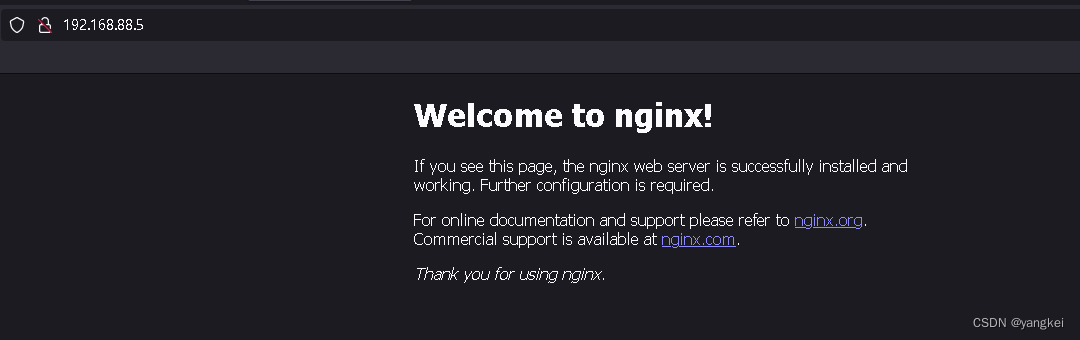
查看Nginx访问:http://192.168.88.5:80
Nginx常用操作:
重新加载配置命令:./sbin/nginx -s reload
查看命令:ps -ef | grep nginx
关闭命令:./sbin/nginx -s reload -s stop 或者:kill -9 进程号
3, 修改Nginx配置文件:
cd /app/nginx/conf
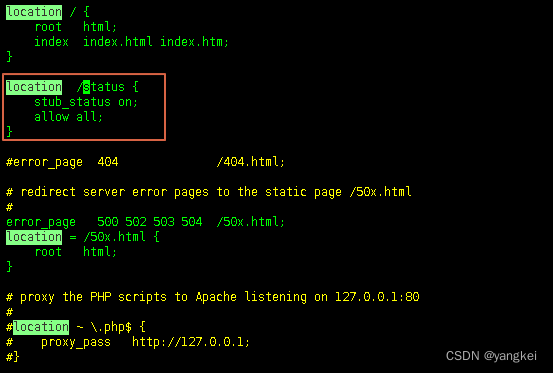
vi nginx.conf(添加如下内容)
location /status {
stub_status on;
allow all;
}
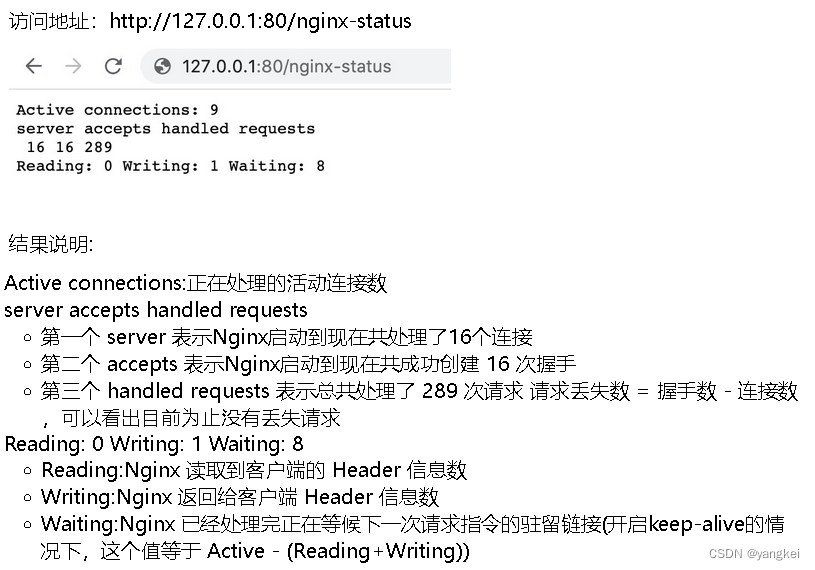
验证:
[root@goya1 ~]# curl http:/192.168.88.5/status
Active connections: 1
server accepts handled requests
1 1 1
Reading: 0 Writing: 1 Waiting: 0
参数说明参考:
4, 配置Nginx Module
启用nginx module
[es@goya1 metricbeat]$ metricbeat modules enable nginx
Enabled nginx
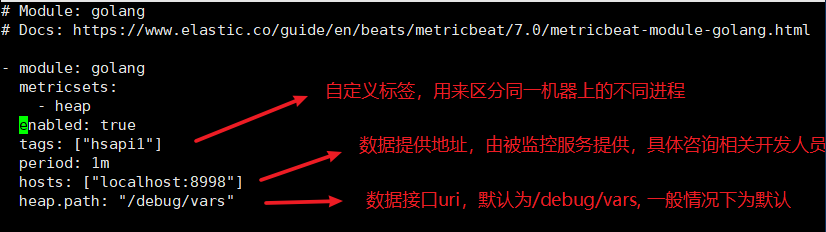
修改nginx module配置
vim modules.d/nginx.yml
# Module: nginx
# Docs: https://www.elastic.co/guide/en/beats/metricbeat/main/metricbeat-module-nginx.html
- module: nginx
metricsets:
- stubstatus
period: 10s
# Nginx hosts
hosts: ["http://192.168.88.5:80/"]
# Path to server status. Default nginx_status
server_status_path: "status"
#username: "user"
#password: "secret"
检查metricbeat.yml文件配置:
[es@goya1 metricbeat]$ cat metricbeat.yml |grep -v "#" |grep -v "^$"
metricbeat.config.modules:
path: ${path.config}/modules.d/*.yml
reload.enabled: false
setup.template.settings:
index.number_of_shards: 1
index.codec: best_compression
setup.kibana:
host: "192.168.88.5:5601"
output.elasticsearch:
hosts: ["192.168.88.5:9200","192.168.88.7:9200","192.168.88.9:9200"]
processors:
- add_host_metadata: ~
- add_cloud_metadata: ~
- add_docker_metadata: ~
- add_kubernetes_metadata: ~
设置 Metricbeat 创建 Kibana上的 Index Pattern 和 Dashboard
[es@goya1 metricbeat]$ metricbeat setup
Overwriting ILM policy is disabled. Set `setup.ilm.overwrite: true` for enabling.
Index setup finished.
Loading dashboards (Kibana must be running and reachable)
Loaded dashboards
重启metricbeat
./metricbeat -e
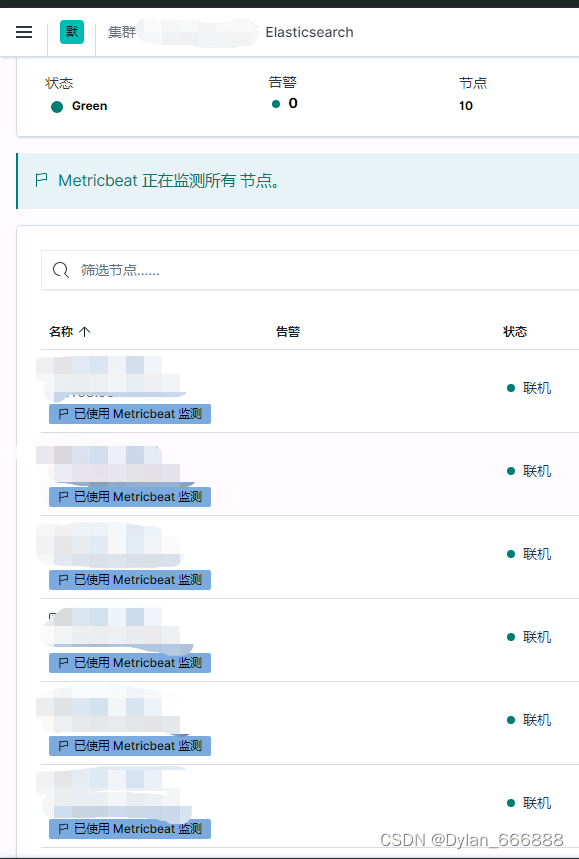
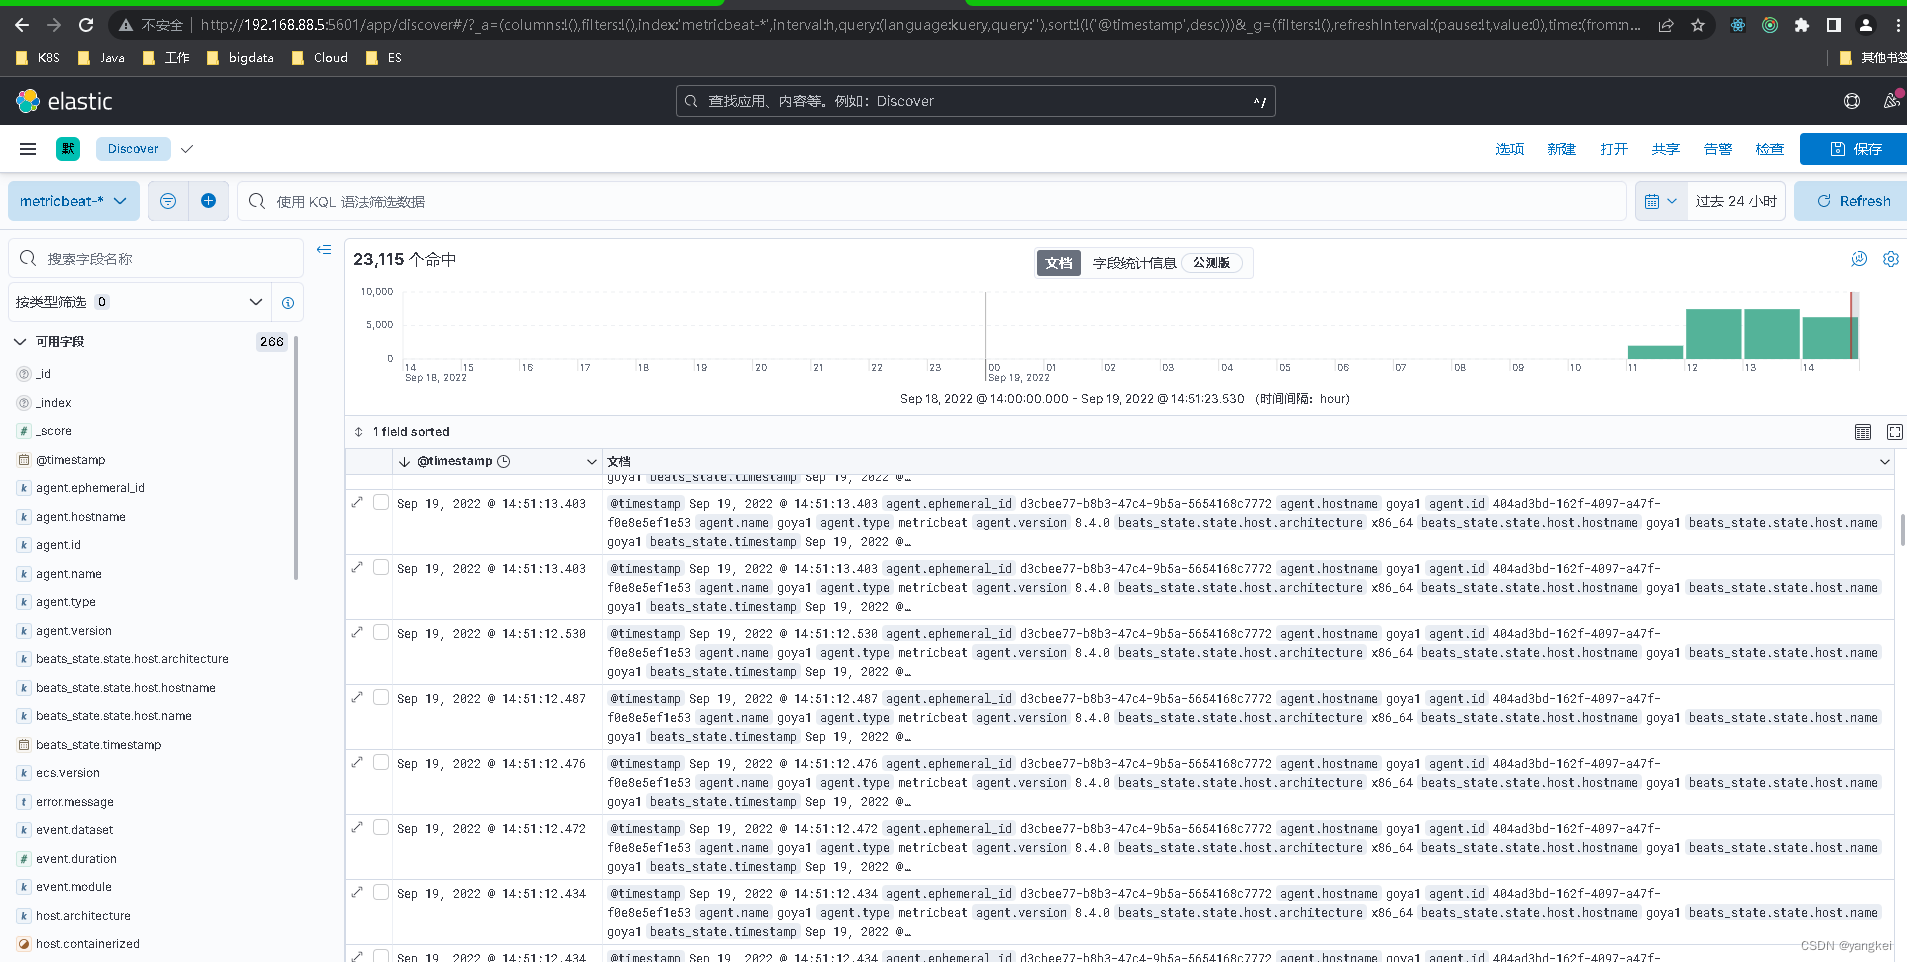
5, Kibana配置及查看
登录Kibana控制台http://192.168.88.5:5601/app/home#/
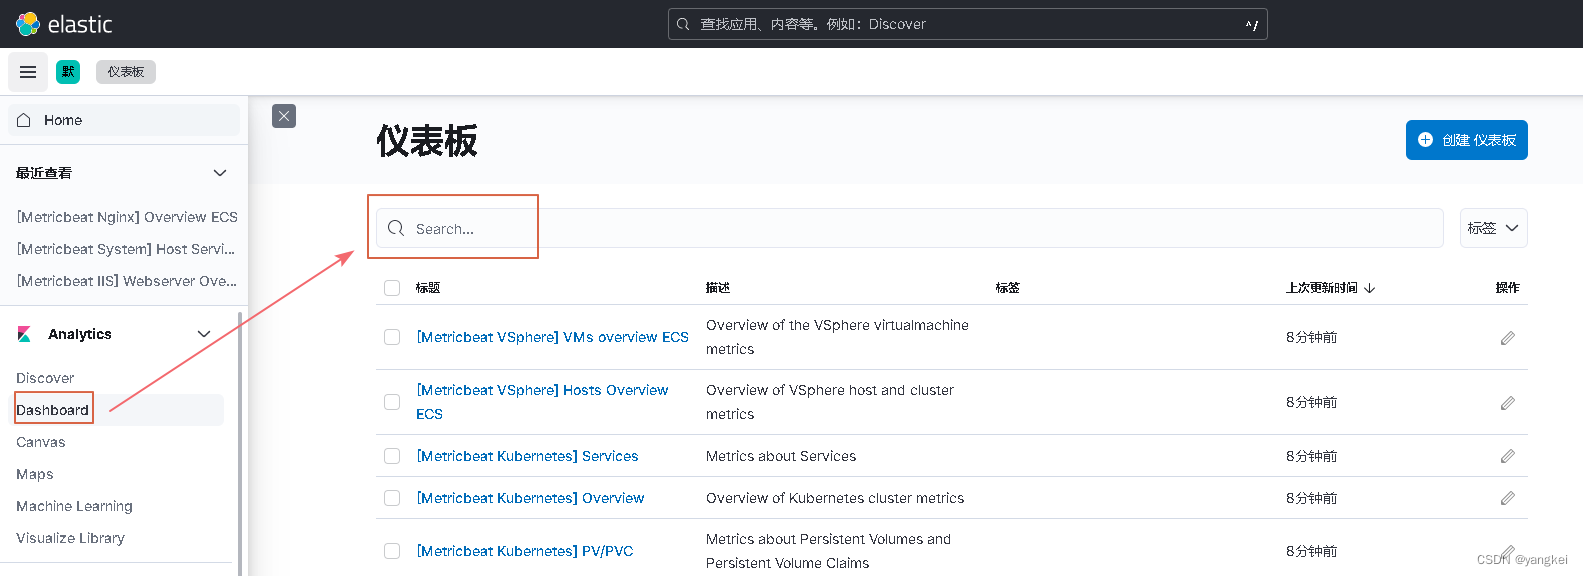
搜索关键字"nginx"会有相应的模板结果。
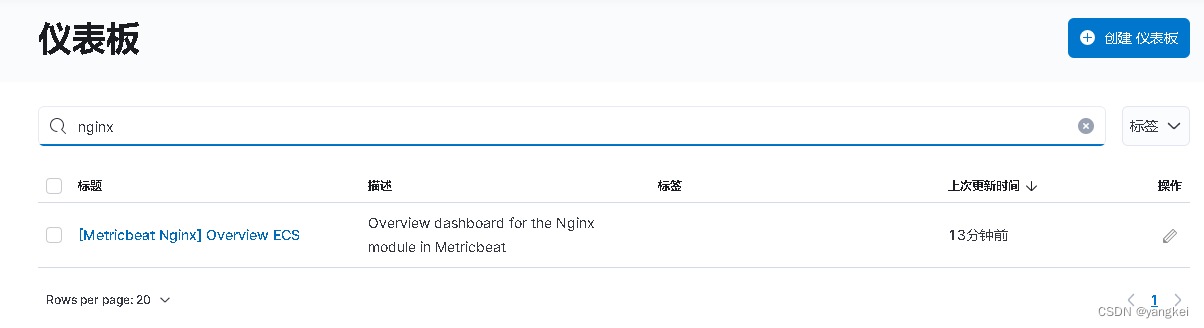
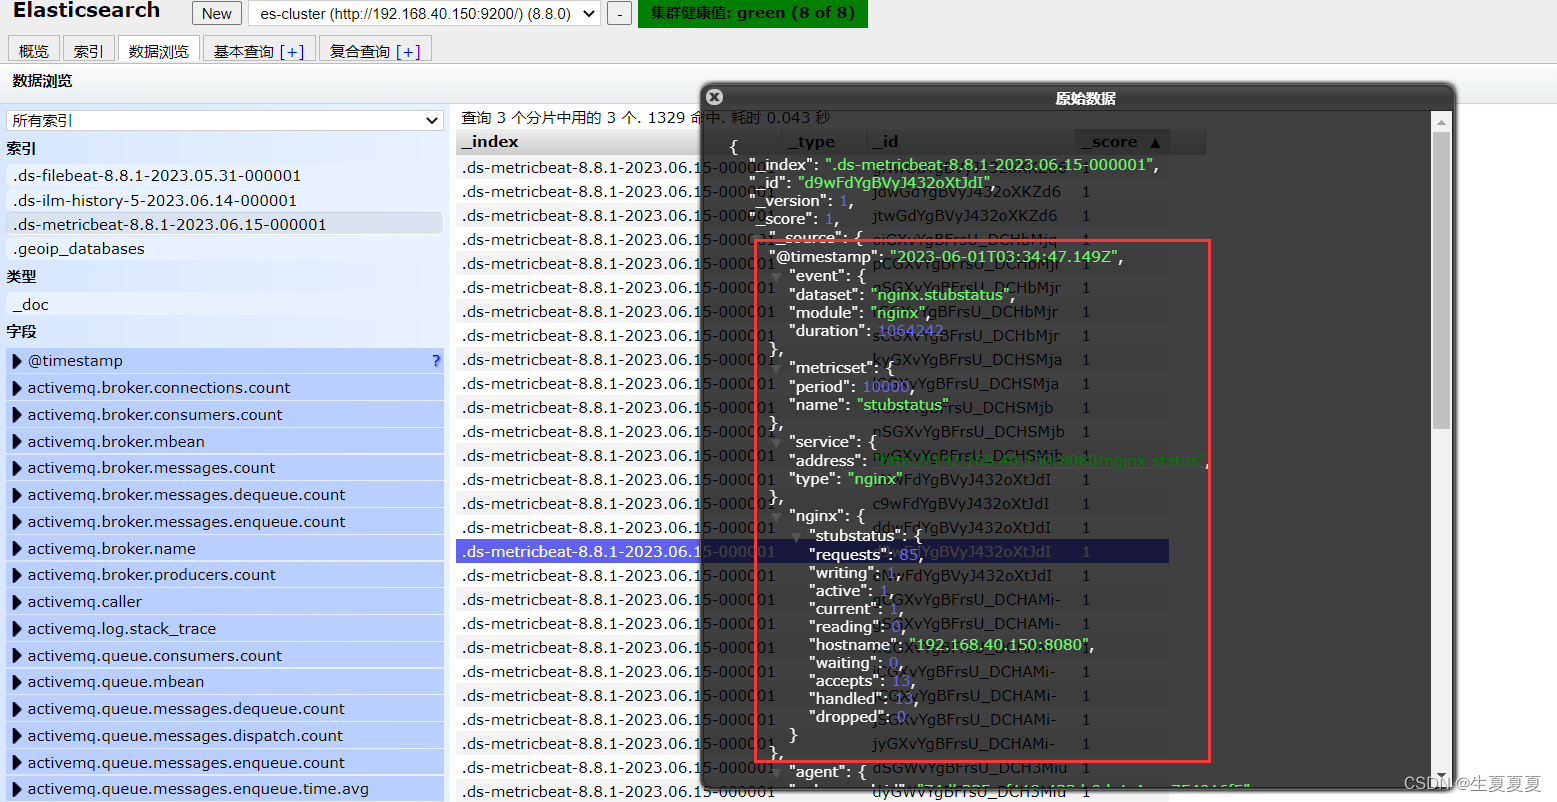
选中就会展示监控信息:
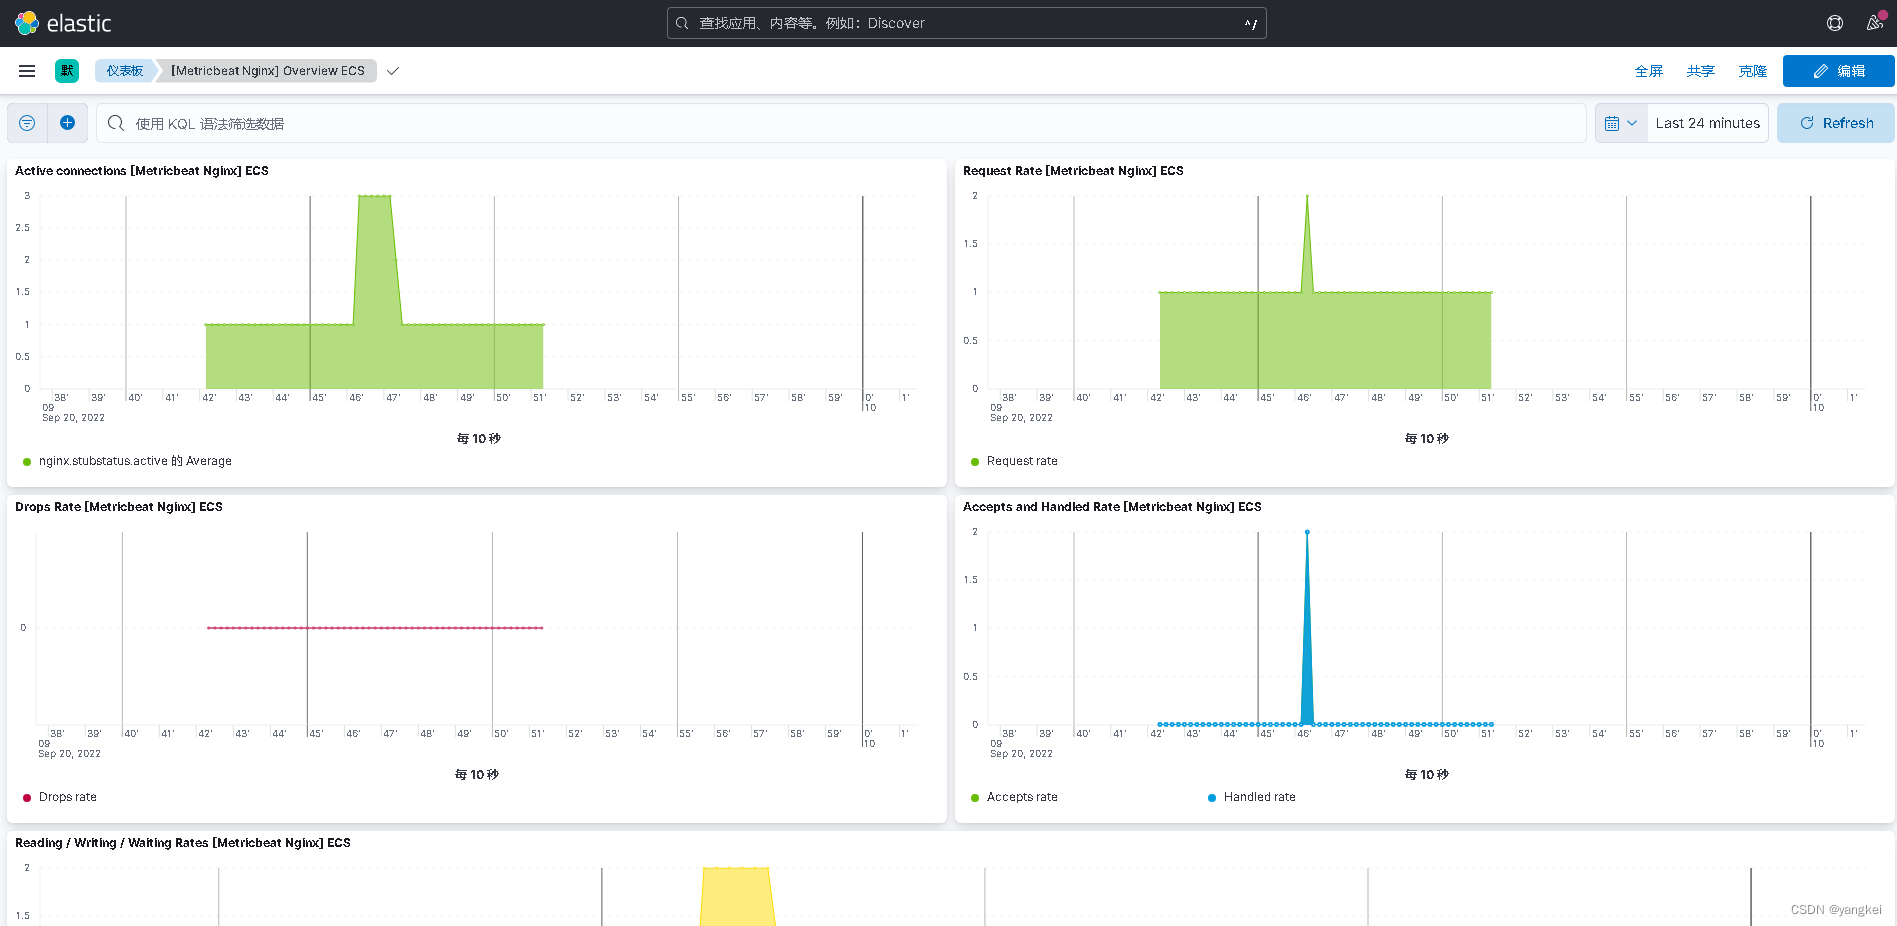
至此,Kibana+Metricsbeat+Nginx监控就配置完毕。