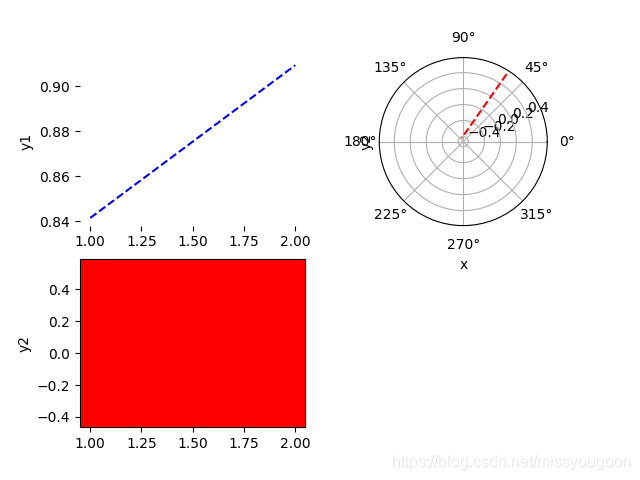
subplot概述
一个figure对象可以包含了多个子图,可以使用subplot()函数来绘制子图。
subplot(numRow , numCol ,plotNum )
subplot(numRow numCol plotNum)
可以不用逗号分开直接写在一起。
例子
import matplotlib.pyplot as plt
names = ['group_a', 'group_b', 'group_c']
values = [1, 10, 100]plt.figure(figsize=(9,5))plt.subplot(131)
plt.bar(names, values)
plt.title('first')
plt.xlabel('name')
plt.ylabel('value')
plt.subplot(132)
plt.scatter(names, values, marker='x', s=30, c='#aaaaaa')
plt.subplot(133)
plt.plot(names, values, ls='--', marker='o', linewidth=2, color='red')
plt.suptitle('Categorical Plotting')
plt.show()
显示的效果:

说明
plt.subplot(131)
其中131表示我们整个图是由一行三列的子图构成的,下面要画的是第一个图。
plt.scatter(names, values, marker='x', s=30, c='#aaaaaa')
点图,market是指标记可以中'x','o'等,s是指标记的大小,c是指标记的颜色.
plt.plot(names, values, ls='--', marker='o', linewidth=2, color='red')
线图,ls是指线的样式,可以是'solid'等


![[Matlab] subplot函数用法](https://img-blog.csdnimg.cn/a37a6652795349498119a41f82da9490.jpg?x-oss-process=image/watermark,type_d3F5LXplbmhlaQ,shadow_50,text_Q1NETiBAQWxjaGVtaXN0Lkw=,size_20,color_FFFFFF,t_70,g_se,x_16#pic_center)


