plt.subplot()使用方法以及参数介绍

article/2025/8/29 10:04:59

plt.subplot()

plt.subplot(nrows, ncols, index, **kwargs)

  1. 第一个参数:*args (官网文档描述)
    Either a 3-digit integer or three separate integers describing the position of the subplot. If the three integers are nrows, ncols, and index in order, the subplot will take the index position on a grid with nrows rows and ncols columns. index starts at 1 in the upper left corner and increases to the right.
    可以使用三个整数,或者三个独立的整数来描述子图的位置信息。如果三个整数是行数、列数和索引值,子图将分布在行列的索引位置上。索引从1开始,从右上角增加到右下角。
    pos is a three digit integer, where the first digit is the number of rows, the second the number of columns, and the third the index of the subplot. i.e. fig.add_subplot(235) is the same as fig.add_subplot(2, 3, 5). Note that all integers must be less than 10 for this form to work.
    位置是由三个整型数值构成,第一个代表行数,第二个代表列数,第三个代表索引位置。举个列子:plt.subplot(2, 3, 5) 和 plt.subplot(235) 是一样一样的。需要注意的是所有的数字不能超过10。

  2. 第二个参数:projection : {None, ‘aitoff’, ‘hammer’, ‘lambert’, ‘mollweide’, ‘polar’, ‘rectilinear’, str}, optional
    The projection type of the subplot (Axes). str is the name of a costum projection, see projections. The default None results in a ‘rectilinear’ projection.
    可选参数:可以选择子图的类型,比如选择polar,就是一个极点图。默认是none就是一个线形图。

  3. 第三个参数:polar : boolean, optional
    If True, equivalent to projection=‘polar’. 如果选择true,就是一个极点图,上一个参数也能实现该功能。
    官方文档传送门:plt.subplot()

import matplotlib.pyplot as plt
import numpy as npx = np.linspace(1, 2, 2)
y1 = np.sin(x)y2 = np.cos(x)ax1 = plt.subplot(2, 2, 1, frameon = False) # 两行一列,位置是1的子图
plt.plot(x, y1, 'b--')
plt.ylabel('y1')
ax2 = plt.subplot(2, 2, 2, projection = 'polar')
plt.plot(x, y2, 'r--')
plt.ylabel('y2')
plt.xlabel('x')
plt.subplot(2, 2, 3, sharex = ax1, facecolor = 'red')
plt.plot(x, y2, 'r--')
plt.ylabel('y2')plt.show()

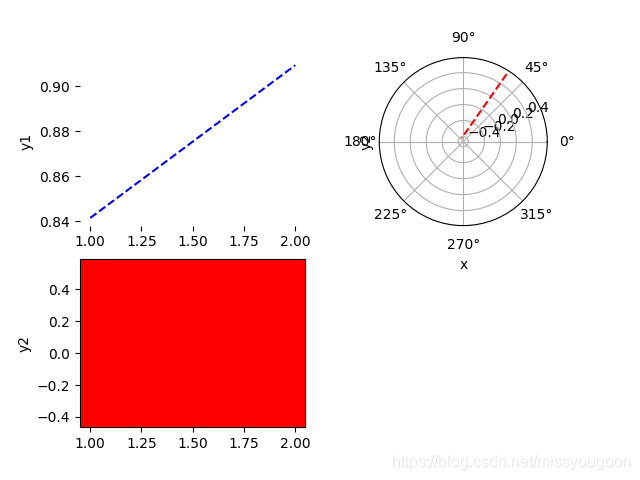
以上代码画图如下:
在这里插入图片描述
可以看到plt.subplot()可以依次画出这些子图,优点是简单明了,缺点是略显麻烦。


http://chatgpt.dhexx.cn/article/E3OOGeyf.shtml

相关文章

add_subplot 和 subplot的区别

参考了几篇博客,在这里做下总结: add_subplot 需要创建实例fig,并且在fig实例的基础上添加子画布: x np.arange(5)fig plt.figure() axes fig.add_subplot(121) axes.plot(x,x) axes fig.add_subplot(122) axes.plot(x,-x) 而subplot无…

plt.subplot()函数解析(最清晰的解释)

欢迎关注WX公众号:【程序员管小亮】 plt.subplot()函数用于直接指定划分方式和位置进行绘图。 M A T L A B MATLAB MATLAB和 p y p l o t pyplot pyplot有当前的图形( f i g u r e figure figure)和当前的轴( a x e s axes axes&…

matlab画图函数用法,subplot,plot

转载:http://blog.163.com/my_it_dream_pwj/blog/static/17841430520112294342649/ subplot 功能 分割figure,创建子坐标系 语法 h subplot(m,n,p) or subplot(mnp) subplot(m,n,p,replace) subplot(m,n,P) subplot(h) sub…

Matplotlib subplot()函数用法详解

Matplotlib subplot()函数用法详解 在使用 Matplotlib 绘图时,我们大多数情况下,需要将一张画布划分为若干个子区域,之后,我们就可以在这些区域上绘制不用的图形。在本节,我们将学习如何在同一画布上绘制多个子图。 …

Matplotlib中subplot以及subplots的用法

subplot 概述 matplotlib能够绘制精美的图表,但我们希望把一组图表放在一起进行比较,这时我们就需要用到subplot。 用法 plt.subplot()创建一个画像(figure)和一组子图(subplots),返回一个Figure实例fig和一个AcesSubplot实例ax,flg代表整…

[Matlab] subplot函数用法

subplot函数用法 subplot(a,b,c)顾名思义,sub的意思就是在一张图上画出子图出来 参数 a 表示子图有几行 参数 b 表示子图有几列 参数 c 表示当前子图的序号,也就是第几个图,这里从1开始的 subplot(2,3,1) plot([1, 0], [0, 1]) title({[sub…

python subplot

1. python 调用 matplotlib matploglib 能够绘制出精美的图表, 有些时候, 我们希望把一组图放在一起进行比较, 有没有什么好的方法呢? matplotlib 中提供的 subplot 可以很好的解决这个问题 2. subplot 函数中的属性 matplotlib下, 一个 Figure 对象可以包含多个子图(Axes…

plt.subplot()用法

subplot(nrows, ncols, plot_number) 或者写成subplot(nrows ncols plot_number)也行 这个很随意 哈哈 这个函数用来表示把figure分成nrows*ncols的子图表示, nrows:子图的行数 ncols:子图的列数 plot_number 索引值,表示把图画在…

subplot函数用法(MATLAB)

MATLAB中的函数----subplot(创建子图) 使用方法:subplot(m,n,p)或者subplot(m n p)。 subplot是将多个图画到一个平面上的工具。其中,m表示是图排成m行,n表示图排成…

matlab——subplot函数用法

MATLAB中的函数----subplot(创建子图) 使用方法:subplot(m,n,p)或者subplot(m n p)。 subplot是将多个图画到一个平面上的工具。参数m,n表示就像矩阵的m行n列一样,第三个参数控制…

subplot 的用法

plt.sublot(a,b,c)顾名思义,sub的意思就是在一张图上画出子图出来 参数 a 表示子图有几行 参数 b 表示子图有几列 参数 c 表示当前子图的序号,也就是第几个图,这里从1开始的 直接上代码配合画出的图能直观感受理解 先画一个2*2的图 imp…

代码雨

复制下面代码,并以.bat文件格式保存 echo off&mode con cols42 lines20&color 02 setlocal enabledelayedexpansion set code123456789abcdef set m1&set v1 title 代码雨 :begin set /a a%random%%%2,b%random%%%3 if %b% neq 0 (set b%a%) else (set…

代码雨代码源复制_用你的名字生成动态“代码雨”,这个特效好惊艳!

拥有一个程序猿特制手机桌面是一种什么样的体验呢?今天技能君给大家带来了一款很有意思的手机动态壁纸软件,它可以将你的名字设置成代码雨特效,会在手机桌面呈现满屏的动态“下雨”效果,十分酷炫! 在「全是技能」公众号…

python代码雨

# -*- coding: utf-8 -*- # Time : 2020/2/15 16:47 # Author : leechoy # File : 代码雨.py # Software: PyCharm import randomimport pygamePANEL_width 1080 PANEL_hight 500 FONT_PX 15pygame.init()# 创建一个可是窗口 winSur pygame.display.set_mode((PANEL_width,…

项目: 代码雨

目录 一、项目描述和最终的效果展示二、静态的代码雨三、一场动态的代码雨四、实现代码雨动画 一、项目描述和最终的效果展示 项目: 让字符从上到下依次的下落&#xff0c;呈现出代码雨。最终效果图如下所示: 二、静态的代码雨 代码如下: #include<graphics.h> #i…

cmd简单代码雨实现方法

相信不少网友在看一些科技或间谍之类电影的时候&#xff0c;可能会看到里面电脑屏幕上的绿色代码雨非常的炫酷。其实我们电脑也是可以实现一些cmd简单代码雨&#xff0c;那么如何实现cmd简单代码雨&#xff1f;下面小编就教下大家实现cmd简单代码雨教程。 具体的步骤如下&…

HTML5代码雨程序

上次我们制作了cmd的数字雨程序&#xff08;点击这里查看&#xff09;&#xff0c;这一次我们使用HTML来制作。 先简单介绍一下HTML&#xff1a; HTML又叫超文本标记语言&#xff0c;标准通用标记语言下的一个应用。 “超文本”就是指页面内可以包含图片、链接&#xff0c;甚至…

代码雨的实现

炫酷的代码雨 实现过程&#xff1a;在Java IDE里新建一个名为Rain的java文件 //package chapterAWTandSwing;import javax.swing.*; import javax.tools.Tool; import java.awt.*; import java.awt.event.ActionEvent; import java.awt.event.ActionListener; import java.awt…

cmd里实现代码雨

参考来源&#xff1a; https://zhidao.baidu.com/question/182311261665020644.html https://www.jianshu.com/p/d8af4e7bfbae https://blog.csdn.net/weixin_42848594/article/details/81626967 操作&#xff1a; 新建txt文件 粘贴代码 将其保存为.bat格式&#xff0c;…

代码雨实现原理与代码分析

闲来无事&#xff0c;好奇代码雨是怎么实现的&#xff0c;早就听说是利用链表&#xff0c;但自己却想不出实现的思路&#xff0c;花了两个晚上把代码看完了&#xff0c;分析都在代码里&#xff0c;先看下效果吧。 在贴代码之前先简单说下代码&#xff0c;方便读者加深理解。 代…