上篇我们将redis安装好了,但是自己搭建的服务监控起来比较麻烦,我们每次都需要跑到redis-cli使用info命令查看redis的状态。
所以我们需要一个可视化的redis监控工具,这里我们为了方便使用docker进行安装,毕竟依赖这个东西是要搞死人的。。。
第一个登场的工具:reids-stat
效果图:

安装方式:https://hub.docker.com/r/richardhull/redis-stat/
docker run --name redis-stat -p 63790:63790 -d insready/redis-stat --server 192.168.20.42:6379 -a "password"
第二个登场的工具:redmon
相比于第一个工具此工具带有的功能多了一个命令台。


安装方式:https://hub.docker.com/r/vieux/redmon
docker run -p 63793:4567 -d vieux/redmon -r redis://:myredis123@192.168.20.42:6379
docker-compose
redmon:
image: vieux/redmon
ports:
- "4567:4567"
command:
--r redis://:myredis123@10.10.10.10:6379
--secure "account":"password"
第三个登场的工具:Grafana+Prometheus
docker pull oliver006/redis_exporter
docker run -d \
--name redis_exporter \
-p 9121:9121 \
oliver006/redis_exporter --redis.addr redis://192.168.1.105:6379 --redis.password "password"
docker pull grafana/grafana
docker run -d --name=grafana -p 3000:3000 grafana/grafana
安装prometheus
有个prometheus.yml需要自己创建位置是/usr/local/src/file/ 这个文件放哪里都可以 到时候指定下就行了
# my global config
global:scrape_interval:     15s # Set the scrape interval to every 15 seconds. Default is every 1 minute.evaluation_interval: 15s # Evaluate rules every 15 seconds. The default is every 1 minute.# scrape_timeout is set to the global default (10s).# Alertmanager configuration
alerting:alertmanagers:- static_configs:- targets:# - alertmanager:9093# Load rules once and periodically evaluate them according to the global 'evaluation_interval'.
rule_files:# - "first_rules.yml"# - "second_rules.yml"# A scrape configuration containing exactly one endpoint to scrape:
# Here it's Prometheus itself.
scrape_configs:# The job name is added as a label `job=<job_name>` to any timeseries scraped from this config.- job_name: 'prometheus'# metrics_path defaults to '/metrics'# scheme defaults to 'http'.static_configs:- targets: ['192.168.1.105:9090']- job_name: 'redis'static_configs:- targets: ['192.168.1.105:9121']labels:instance: redis- job_name: 'linux'static_configs:- targets: ['192.168.1.105:9100']labels:instance: node
docker操作
docker pull prom/prometheus
sudo docker run -d \-p 9090:9090 \-v /usr/local/src/file/prometheus.yml:/usr/local/src/file/prometheus.yml \quay.io/prometheus/prometheus \--config.file=/usr/local/src/file/prometheus.yml
打开192.168.1.105:9090

如果发现部署的服务可以正常访问 但是此处无法连接可能是防火墙的原因
之后添加data souree 导入展示json 下载地址https://grafana.com/grafana/dashboards/763


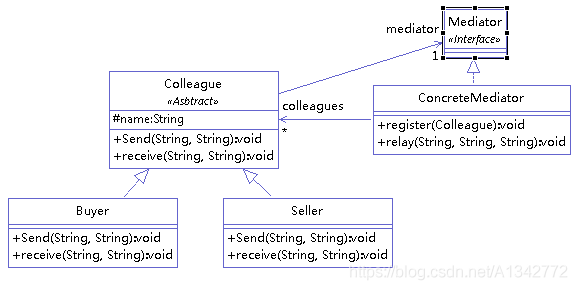
![Java之美[从菜鸟到高手演变]之设计模式](https://img-my.csdn.net/uploads/201211/29/1354159363_7245.PNG)


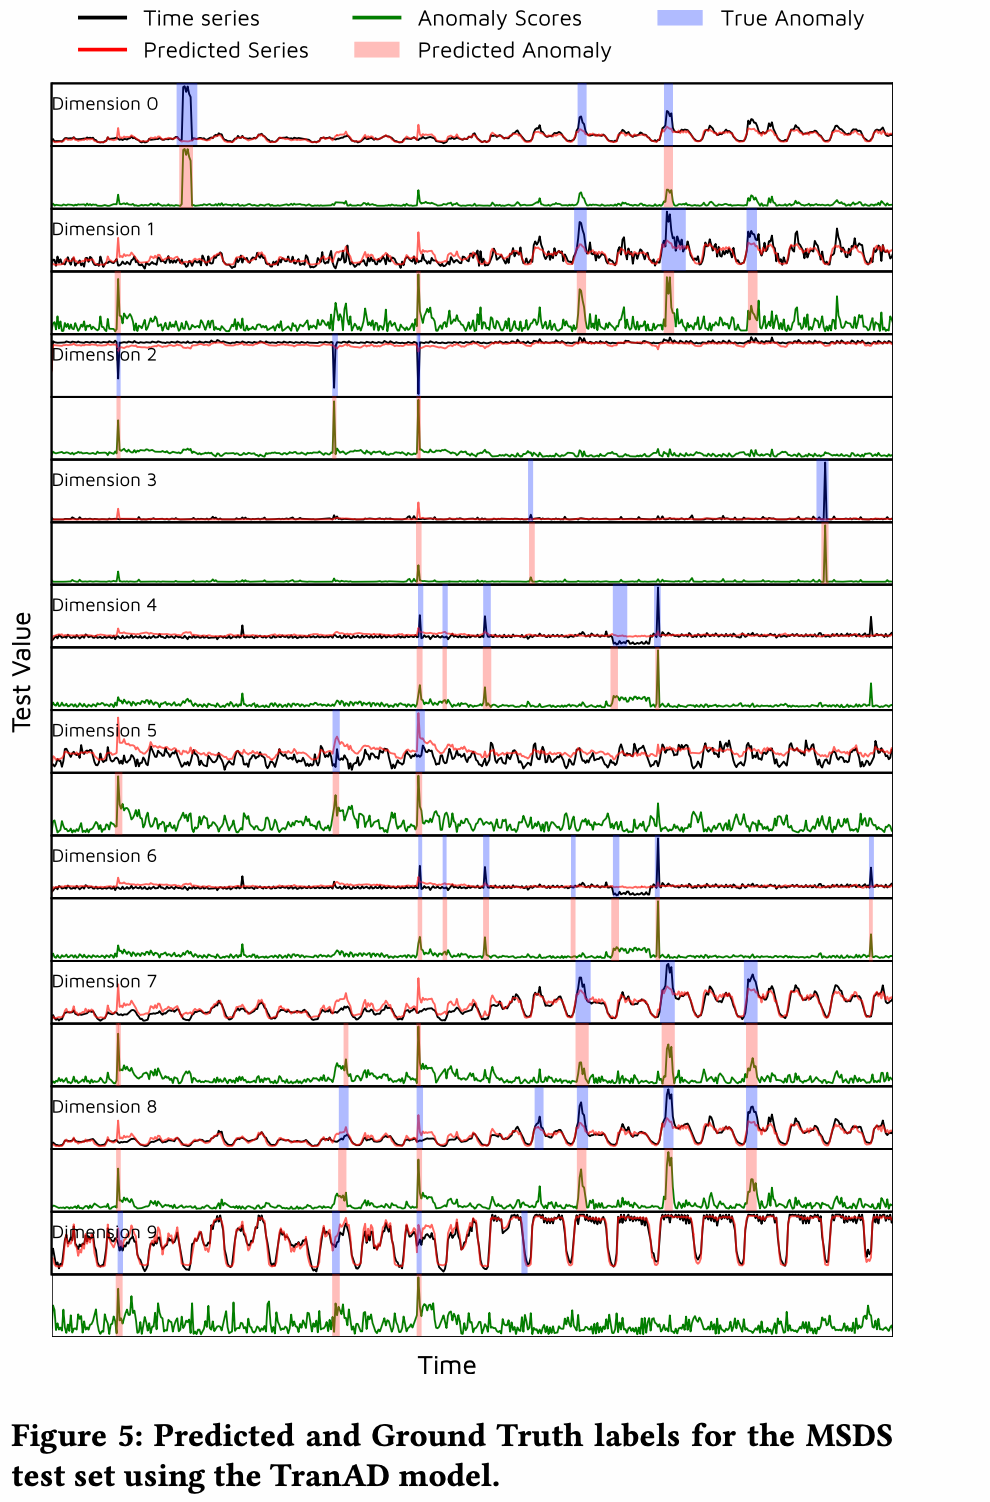
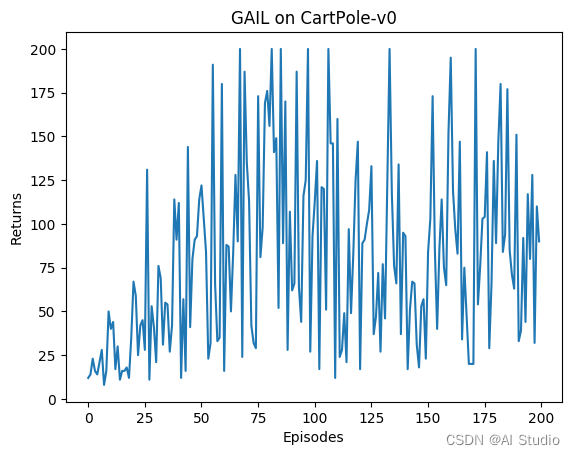
![[论文]鲁棒的对抗性强化学习](https://img-blog.csdnimg.cn/20210228212316993.png)