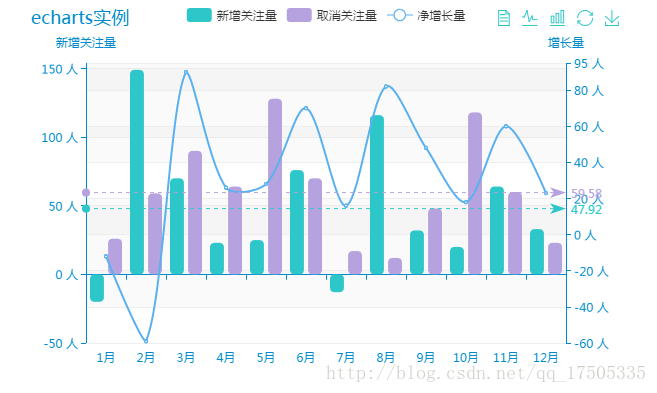
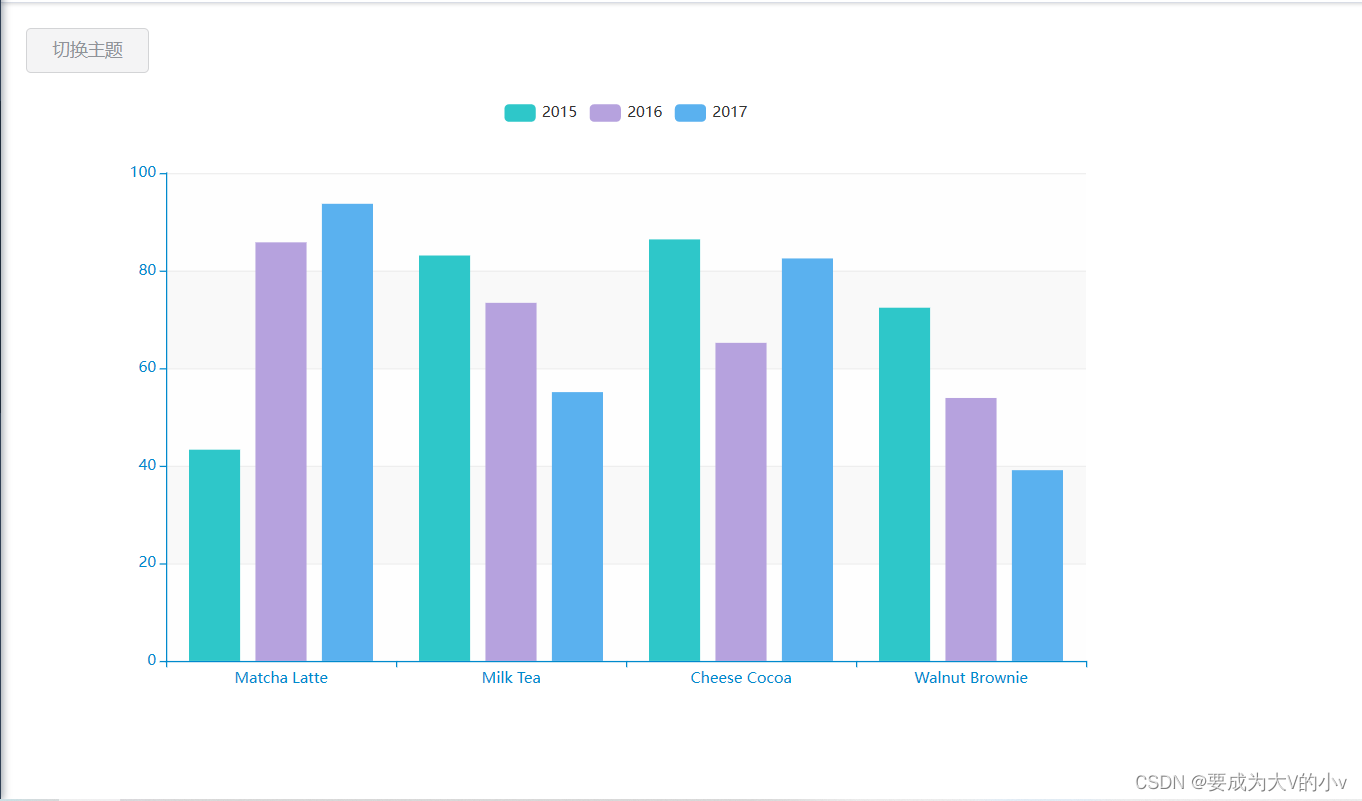
效果:

<template>
<div class="wrapper"><Row v-for="(items, index) in secondeData" :key="index"><Col  span="12" v-for="m in items" :key="m"><div class="chart" :ref="m.targetName" style="height: 400px;margin: 10px;box-shadow: 0 0 8px"></div></Col></Row>
</div>
</template>
<script>
var appName='';
//引入Echarts主模块let echarts=require('echarts/lib/echarts');//引入柱状图require('echarts/lib/chart/bar');//引入圆饼图require('echarts/lib/chart/pie');//引入所需组件require('echarts/lib/component/tooltip');require('echarts/lib/component/legend');import  'static/js/macarons.js'
export default {data(){return {charts:{},echartsData:[],appCode:'',appName:'',monitorAlarmMessage:{startAlarmTime:new Date(new Date().getTime()-600000),endAlarmTime:new Date()}}},computed: {// 计算属性的 gettersecondeData: function () {let newData = [], c = this.echartsData.length % 2 == 0, l = c ? this.echartsData.length : this.echartsData.length - 1 ;for (let i = 0; i < l; i = i+2) {newData.push([this.echartsData[i], this.echartsData[i+1]]);}if(!c){newData.push([this.echartsData[this.echartsData.length - 1]]);}return newData;}},methods:{setData(arrays){let _this = this;_this.echartsData = arrays;_this.$nextTick(function () {let newTargets = [];for (let index = 0; index < arrays.length; index++) {let item = arrays[index], doms = _this.$refs[item.targetName];newTargets[index] = item.targetName;if(!_this.charts[item.targetName]){console.log("不存在,开始重新绘制div ->" + item.targetName);_this.createChartOne(item.targetName, doms[0]);}_this.chartMonitorTargetUpdate(item.targetName, item); }for (const key in _this.charts) {if (newTargets.indexOf(key) < 0) {console.log("删除 ->" + key);delete _this.charts[key];}}})},showInfluxDBMonitorAlarmByAppCode(){this.$http.post('/influxDBMonitorAnalyze/showInfluxDBMonitorAlarmByAppCode',{//查询请求接口appName:this.appName,appCode:this.appCode}).then((res)=>{//alert(JSON.stringify(res.data.data));this.setData(res.data.data.filter(function(item){return item != null;}));//this.echartsDataSize= this.echartsData.length;console.log(this.echartsData);}).catch((err)=>{this.$Modal.error({ title: "请求失败", content: err });})},createChartOne(targetName, ref){//this.chartMonitorTarget=echarts.init(this.$refs.chartOne);this.charts[targetName] = echarts.init(ref, 'macarons');this.charts[targetName].setOption({tooltip: {trigger: 'axis'},grid:{top:100,bottom:40,left:40,right:45},xAxis:  {name:'时间',               //坐标轴名称type: 'category',nameGap:15,                  //坐标轴名称与轴线之间的距离nameRotate:0,                //坐标轴名字旋转,角度值boundaryGap: true,data: [],axisTick:{          //坐标轴刻度是否朝内,默认朝外。length:5                //坐标轴刻度的长度。},axisLabel: {interval:"auto",rotate:30  } },yAxis: {name:'',               //坐标轴名称type: 'value',axisLabel: {formatter: '{value}'}},series: []})},chartMonitorTargetUpdate(targetName, data){this.charts[targetName].setOption({title: {text: targetName,textStyle: {fontWeight: 'bolder',              //标题颜色color: '#408829'},subtext: ''},legend: {left:'center',top:'30',bottom:'auto',orient:'horizontal',data:data.legend.data},xAxis: {data: data.xaxisData},series: data.influxDBMonitorAlarm.seriesList});},test(){var arrays = [], count = Math.round(Math.random()*10);console.log("随机生成个数:" + count);for (let index = 0; index < count; index++) {//let count = Math.round(Math.random()*10);let xaxis = [10];for (let k = 0; k < 10; k++) {xaxis[k] = "8:" + Math.round(Math.random()*60);}let datas = [4];for (let j = 0; j < 4; j++) {let is = [10];for (let i = 0; i < 10; i++) {is[i] = Math.round(Math.random()*100);}datas[j] = is;  }arrays.push({"legend": {"data": ["基线值", "当前值", "基线上浮值", "基线下浮值"]},"targetName": "targetName" + index,"appName": null,"xaxisData": xaxis,"influxDBMonitorAlarm": {"seriesList": [{"name": "基线值","type": "line","data": datas[3],"markPoint": {"data": [{"type": "max","name": "最大值"}, {"type": "min","name": "最小值"}]}}, {"name": "当前值","type": "line","data": datas[0],"markPoint": {"data": [{"type": "max","name": "最大值"}, {"type": "min","name": "最小值"}]}}, {"name": "基线上浮值","type": "line","data": datas[1],"markPoint": {"data": [{"type": "max","name": "最大值"}, {"type": "min","name": "最小值"}]}}, {"name": "基线下浮值","type": "line","data": datas[2],"markPoint": {"data": [{"type": "max","name": "最大值"}, {"type": "min","name": "最小值"}]}}]}});}  this.setData(arrays);}},created(){},activated(){let _this = this;appName=_this.$route.query.appName_this.appCode=_this.$route.query.appCode_this.appName=_this.$route.query.appName_this.showInfluxDBMonitorAlarmByAppCode();// _this.test();window.setInterval(function(){_this.showInfluxDBMonitorAlarmByAppCode();}, 5000);},destroyed(){}}
</script>
<style lang="scss" scoped>//-----------------------------------------------------------css样式代码start
//编写样式
.ivu-form-item {margin-bottom: 24px;
}
</style>
js:macarons.js
(function (root, factory) {if (typeof define === 'function' && define.amd) {// AMD. Register as an anonymous module.define(['exports', 'echarts'], factory);} else if (typeof exports === 'object' && typeof exports.nodeName !== 'string') {// CommonJSfactory(exports, require('echarts'));} else {// Browser globalsfactory({}, root.echarts);}
}(this, function (exports, echarts) {var log = function (msg) {if (typeof console !== 'undefined') {console && console.error && console.error(msg);}};if (!echarts) {log('ECharts is not Loaded');return;}var colorPalette = ['#2ec7c9','#b6a2de','#5ab1ef','#ffb980','#d87a80','#8d98b3','#e5cf0d','#97b552','#95706d','#dc69aa','#07a2a4','#9a7fd1','#588dd5','#f5994e','#c05050','#59678c','#c9ab00','#7eb00a','#6f5553','#c14089'];var theme = {color: colorPalette,title: {textStyle: {fontWeight: 'normal',color: '#008acd'}},visualMap: {itemWidth: 15,color: ['#5ab1ef','#e0ffff']},toolbox: {iconStyle: {normal: {borderColor: colorPalette[0]}}},tooltip: {backgroundColor: 'rgba(50,50,50,0.5)',axisPointer : {type : 'line',lineStyle : {color: '#008acd'},crossStyle: {color: '#008acd'},shadowStyle : {color: 'rgba(200,200,200,0.2)'}}},dataZoom: {dataBackgroundColor: '#efefff',fillerColor: 'rgba(182,162,222,0.2)',handleColor: '#008acd'},grid: {borderColor: '#eee'},categoryAxis: {axisLine: {lineStyle: {color: '#008acd'}},splitLine: {lineStyle: {color: ['#eee']}}},valueAxis: {axisLine: {lineStyle: {color: '#008acd'}},splitArea : {show : true,areaStyle : {color: ['rgba(250,250,250,0.1)','rgba(200,200,200,0.1)']}},splitLine: {lineStyle: {color: ['#eee']}}},timeline : {lineStyle : {color : '#008acd'},controlStyle : {normal : { color : '#008acd'},emphasis : { color : '#008acd'}},symbol : 'emptyCircle',symbolSize : 3},line: {smooth : true,symbol: 'emptyCircle',symbolSize: 3},candlestick: {itemStyle: {normal: {color: '#d87a80',color0: '#2ec7c9',lineStyle: {color: '#d87a80',color0: '#2ec7c9'}}}},scatter: {symbol: 'circle',symbolSize: 4},map: {label: {normal: {textStyle: {color: '#d87a80'}}},itemStyle: {normal: {borderColor: '#eee',areaColor: '#ddd'},emphasis: {areaColor: '#fe994e'}}},graph: {color: colorPalette},gauge : {axisLine: {lineStyle: {color: [[0.2, '#2ec7c9'],[0.8, '#5ab1ef'],[1, '#d87a80']],width: 10}},axisTick: {splitNumber: 10,length :15,lineStyle: {color: 'auto'}},splitLine: {length :22,lineStyle: {color: 'auto'}},pointer : {width : 5}}};echarts.registerTheme('macarons', theme);
}));