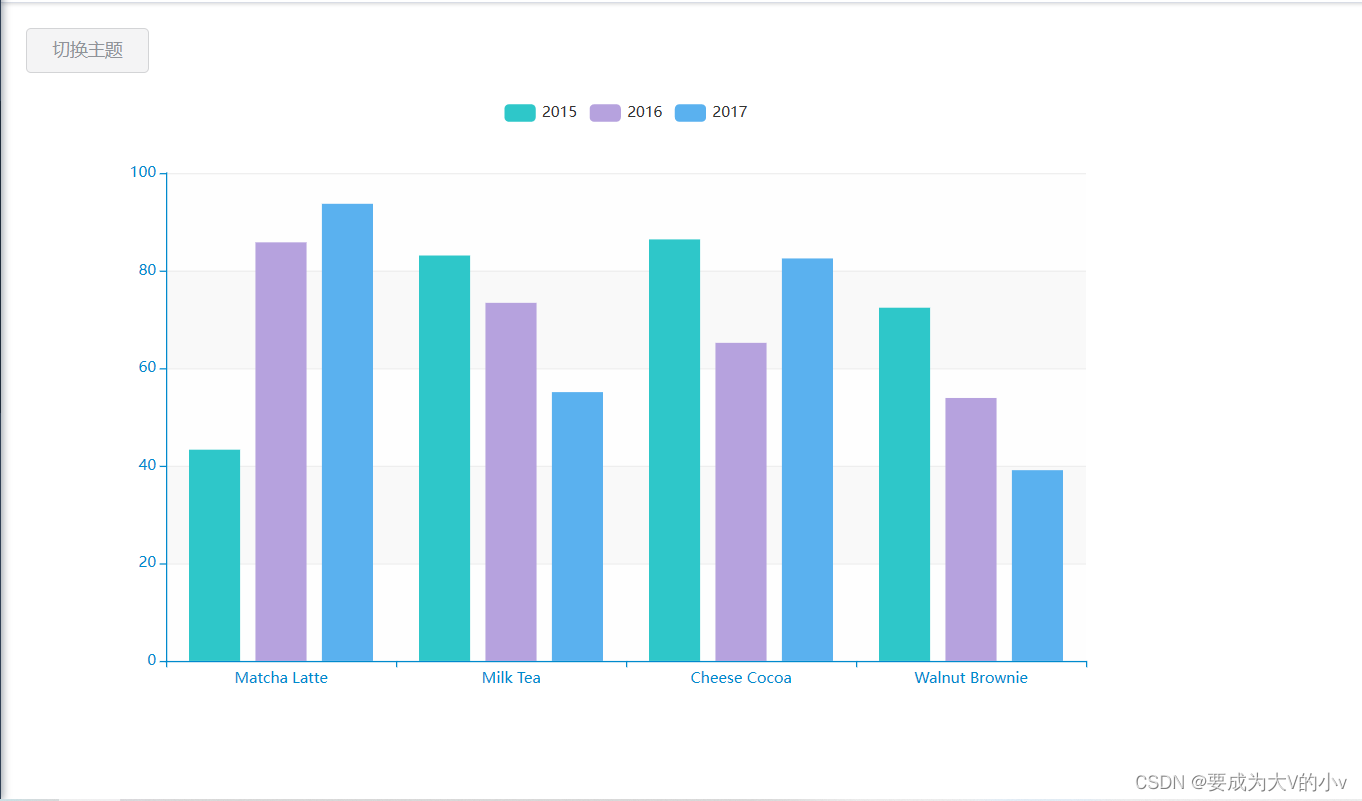
第一步:下载相应的js文件:echarts.min.js和macarons.js,其中macarons.js文件时主题文件。
第二步:编写index.html
<!DOCTYPE html>
<html lang="en">
<head><meta charset="UTF-8"><title>Document</title>
</head>
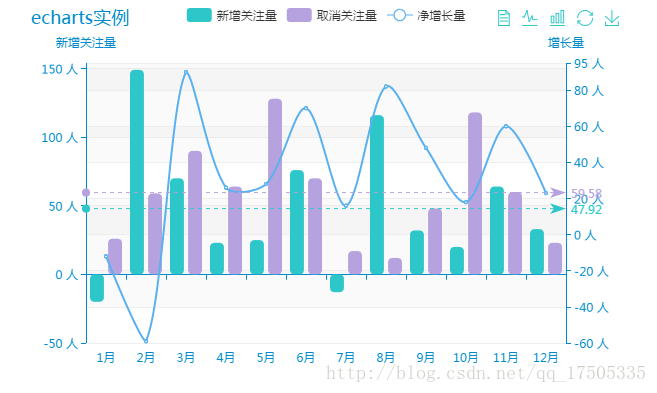
<body><div id = "d1" style = "margin:20px auto;width:600px;height:400px;"></div><script type="text/javascript" src="echarts.min.js"></script><script type="text/javascript" src="macarons.js"></script><script type="text/javascript">//其中第二个参数是动态设置主题var myChart = echarts.init(document.getElementById("d1"),'macarons');//初始化画布var option = {title:{text:"echarts实例"},tooltip : {trigger: 'axis'}, legend: {data:['新增关注量','取消关注量','净增长量']}, toolbox: {show : true,feature : {mark : {show: true},dataView : {show: true, readOnly: false},magicType : {show: true, type: ['line', 'bar']},restore : {show: true},saveAsImage : {show: true}}},calculable : true,xAxis : [{type : 'category',data : ['1月','2月','3月','4月','5月','6月','7月','8月','9月','10月','11月','12月']}], //双y轴yAxis : [{type : 'value',minInterval: 50,name : '新增关注量',splitNumber: 5, axisLabel : {formatter: '{value} 人' //控制输出格式},max: function(value){return value.max+5;}},{type : 'value',name : '增长量',splitNumber: 10,minInterval: 20,axisLabel : {formatter: '{value} 人' //控制输出格式},max: function(value){return value.max+5;}}],series : [{name:'新增关注量',type:'bar',itemStyle:{normal:{barBorderRadius:5},emphasis: {barBorderRadius: 5}},data:[-20, 149, 70, 23, 25, 76, -13, 116, 32, 20, 64, 33],markLine : {data : [{type : 'average', name: '平均值'}]}},{name:'取消关注量',type:'bar',itemStyle:{normal:{barBorderRadius:5},emphasis: {barBorderRadius: 5}},data:[26, 59, 90, 64, 128, 70, 17, 12, 48, 118, 60, 23],markLine : {data : [{type : 'average', name : '平均值'}]}},{name:'净增长量',yAxisIndex: 1,type:'line',data:[-12, -59, 90, 26, 28, 70, 16, 82, 48, 18, 60, 23]}]}myChart.setOption(option);</script>
</body>
</html>第三步:运行效果