文档:
https://echarts.apache.org/zh/tutorial.html#5%20%E5%88%86%E9%92%9F%E4%B8%8A%E6%89%8B%20ECharts

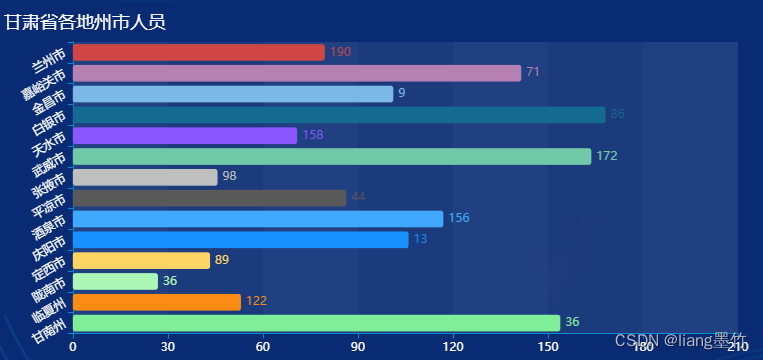
1、条形

<template><div> <!-- 包其他内容需要有个外div --><div :class="className" :style="{height:height,width:width}" id="sortEChart"/></div>
</template><script>import echarts from 'echarts'require('echarts/theme/macarons') // echarts themeexport default {props: {className: {type: String,default: 'chart'},width: {type: String,default: '100%'},height: {type: String,default: '335px'}},data() {return {chart: null}},mounted() {this.$nextTick(() => {this.initChart()})},beforeDestroy() {if (!this.chart) {return}this.chart.dispose()this.chart = null},methods: {initChart() {// this.chart = echarts.init(this.$el, 'macarons')this.chart = echarts.init(document.getElementById('sortEChart'))this.chart.setOption({tooltip: {trigger: 'axis',axisPointer: {type: 'shadow'}},legend: {bottom: 0,data: ['本地', '外地']},grid: {left: '3%',right: '4%',bottom: '10%',containLabel: true},xAxis: {type: 'category',data: ['新鲜水果', '新鲜蔬菜', '新鲜肉类', '冻品类', '粮油干货', '休闲食品', '调味品类', '禽蛋类']},yAxis: {type: 'value',boundaryGap: [0, 0.01]},series: [{name: '本地',type: 'bar',data: [10, 25, 50, 75, 99, 50, 60, 75],color: '#6495F9'},{name: '外地',type: 'bar',data: [10, 25, 50, 75, 99, 50, 65, 75],color: '#69DFAE'}]})}}}
</script>
2、圆形

<template><div><div :class="className" :style="{height:height,width:width}" id="purchaseEChart"/></div>
</template>
<script>
import echarts from 'echarts'require('echarts/theme/macarons') // echarts themeexport default {props: {className: {type: String,default: 'chart'},width: {type: String,default: '100%'},height: {type: String,default: '335px'}},data() {return {chart: null}},mounted() {this.$nextTick(() => {this.initChart()})},beforeDestroy() {if (!this.chart) {return}this.chart.dispose()this.chart = null},methods: {initChart() {// this.chart = echarts.init(this.$el, 'macarons')this.chart = echarts.init(document.getElementById('purchaseEChart'))this.chart.setOption({tooltip: {trigger: 'item',formatter: '{a} <br/>{b} : {c} ({d}%)'},legend: {orient: 'vertical',top: 50,height: '60%',right: '2%',data: ['新鲜蔬菜', '冻品类', '糖油干货', '奶类', '干货类','休闲食品', '调味品类', '蛋类', '水果类', '新鲜肉类']},series: [{name: '占比',type: 'pie',radius: '55%',center: ['35%', '50%'],selectedMode: 'single',data: [{ value: 33, name: '新鲜蔬菜', itemStyle: { color: '#03BD5B' }},{ value: 18, name: '冻品类', itemStyle: { color: '#F5A623' }},{ value: 9, name: '糖油干货', itemStyle: { color: '#F1453D' }},{ value: 7, name: '奶类', itemStyle: { color: '#785549' }},{ value: 8, name: '干货类', itemStyle: { color: '#B9D337' }},{ value: 7, name: '休闲食品', itemStyle: { color: '#1EBEA5' }},{ value: 6, name: '调味品类', itemStyle: { color: '#6744B1' }},{ value: 5, name: '蛋类', itemStyle: { color: '#FED630' }},{ value: 4, name: '水果类', itemStyle: { color: '#339AED' }},{ value: 3, name: '新鲜肉类', itemStyle: { color: '#28E5FD' }}],label: {normal: {// {b}代表显示的内容标题// {c}代表数据值// {d}代表占百分比// formatter: '{b}:{d}%',formatter: '{d}%',borderWidth: 20,borderRadius: 4}},emphasis: {itemStyle: {shadowBlur: 10,shadowOffsetX: 0,shadowColor: 'rgba(0, 0, 0, 0.5)'}}}]})}}
}
</script>
3、仪表盘 type: 'gauge',

<template><div :class="className" :style="{height:height,width:width}" />
</template><script>
import * as echarts from 'echarts'
require('echarts/theme/macarons') // echarts themeexport default {props: {className: {type: String,default: 'chart'},width: {type: String,default: '100%'},height: {type: String,default: '172px'},query: {type: Object,default: function() {const obj = {date: '',name: ''}return obj}}},data() {return {chart: null}},mounted() {this.$nextTick(() => {this.initChart()})},beforeDestroy() {if (!this.chart) {return}this.chart.dispose()this.chart = null},methods: {initChart() {this.chart = echarts.init(this.$el, 'macarons')var that = thisif (isNaN(that.query.date) || that.query.date === null) {that.query.date = 0}this.chart.setOption({series: [{name: '1',type: 'gauge',center: ['50%', '55%'], // 默认全局居中radius: '45%',startAngle: 314.99,min: 0,max: 400, // 分母splitNumber: 10,axisLine: { // 坐标轴线lineStyle: { // 属性lineStyle控制线条样式color: [[295.6 / 400, '#FF4343'], // 根据实际数据动态改变[1, '#DDDDDD']],width: 6, // 半径shadowColor: '#fff', // 默认透明shadowBlur: 1}},pointer: {show: false},axisLabel: {show: true,// 坐标轴小标记textStyle: { // 属性lineStyle控制线条样式fontWeight: 'bolder',color: 'transparent', // 刻度数字颜色 隐藏shadowColor: '#fff', // 默认透明shadowBlur: 10}},axisTick: { // 坐标轴小标记length: 11, // 属性length控制线长lineStyle: { // 属性lineStyle控制线条样式color: 'transparent', // 坐标轴 小刻度线颜色shadowColor: '#fff', // 默认透明shadowBlur: 10}},splitLine: { // 分隔线length: 20, // 属性length控制线长lineStyle: { // 属性lineStyle(详见lineStyle)控制线条样式width: 3,color: 'transparent', // 分割线shadowColor: '#fff', // 默认透明shadowBlur: 10}},title: {textStyle: { // 其余属性默认使用全局文本样式,详见TEXTSTYLEfontSize: 12,color: '#000',shadowColor: '#fff', // 默认透明shadowBlur: 10},offsetCenter: ['0', '175%']},detail: { // show : true ,borderColor: '#fff',shadowColor: '#fff', // 默认透明textStyle: { // 其余属性默认使用全局文本样式,详见TEXTSTYLEfontWeight: 'bolder',fontSize: 16,color: '#000'  // 字体颜色},formatter: '{value}',  // 格式化最终的展现offsetCenter: ['0', '10%']},data: [{value: 20.1,name: "蛋白质(g)"}]}]})}}
}
</script>
<style lang="scss"></style>
4、 字体适配
FontChart(res) {
//获取到屏幕的宽度
var clientWidth =
window.innerWidth ||
document.documentElement.clientWidth ||
document.body.clientWidth;
if (!clientWidth) return; //报错拦截:
let fontSize = 1 * (clientWidth / 1920);
return res * fontSize;
},
textStyle: { // 其余属性默认使用全局文本样式,详见TEXTSTYLE// fontWeight: 'bolder',fontSize: this.fontChart(40),color: '#237CFA' // 字体颜色
},