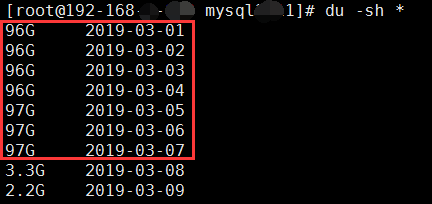
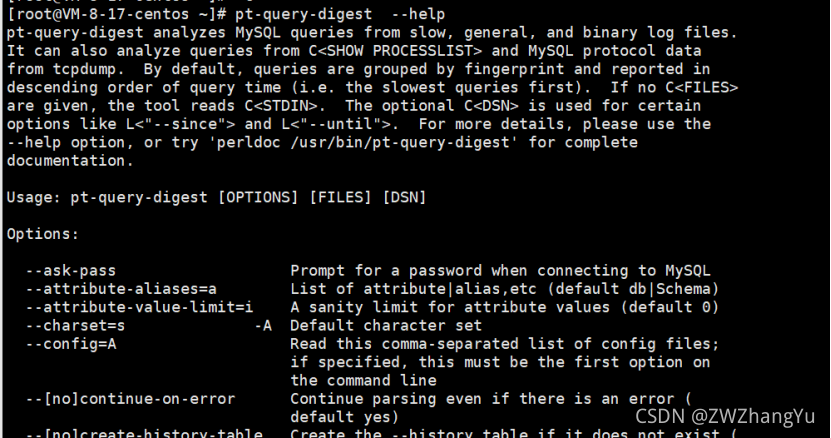
当应用程序后台 SQL 查询慢的时候我们一般第一时间会查看数据库慢查询记录,但是慢查询记录是原始文本,直接查询搜索分析比较费时费力,虽然业界有针对 MySQL 慢查询分析的命令行工具(比如:pt-query-digest),但是使用起来还是不够方便,而且分析结果也是针对整个实例的大概统计,不能及时定位到某个应用(库.表)的慢查询。出于这个目的我们可以将 MySQL 原始慢查询日志结构化导入 Elasticsearch,然后通过 Kibana 可视化查询分析,由于日志结构化解析出来了,所以可以快速查询分析。本文主要介绍如何运用业界主流的开源工具链实现这一需求,整体架构如下:

工具链集合
- Filebeat:日志收集端,使用 Filebeat 的 MySQL 模块结构化解析慢查询日志并写入到 Elasticsearch。
- Elasticsearch:存储 Filebeat 发送过来的日志消息;
- Kibana:可视化查询分析 Elasticsearch 存储的日志数据;
- docker-compose:容器化快速启动 Elasticsearch + Kibana 组件;
具体实现
docker-compose 启动 Elasticsearch + Kibana 组件,然后使用 Filebeat 自带的 MySQL 模块结构化慢查询日志并传输到 Elasticsearch。
docker-compose 启动 Elasticsearch + Kibana 组件
- Elasticsearch 7.4.0
- Kibana 7.4.0
docker-compose.yml
version: '3'networks:esnet:driver: bridge
services:elasticsearch:image: docker.elastic.co/elasticsearch/elasticsearch:7.4.0environment:- node.name=es01- discovery.seed_hosts=es01- cluster.initial_master_nodes=es01- cluster.name=docker-cluster- bootstrap.memory_lock=true- "ES_JAVA_OPTS=-Xms4096m -Xmx4096m"ulimits:memlock:soft: -1hard: -1ports:- "9500:9200"networks:- esnetkibana:image: docker.elastic.co/kibana/kibana:7.4.0environment:- "ELASTICSEARCH_HOSTS=http://elasticsearch:9200"ports:- "5601:5601"networks:- esnet
启动:
docker-compose up -d
安装配置 Filebeat
安装
curl -L -O https://artifacts.elastic.co/downloads/beats/filebeat/filebeat-7.4.0-x86_64.rpm
sudo rpm -vi filebeat-7.4.0-x86_64.rpm
配置 Filebeat
- 配置 Filebeat 输出到 Elasticsearch:
vim /etc/filebeat/filebeat.yml 填入如下内容
output.elasticsearch:# Array of hosts to connect to.hosts: ["localhost:9500"]
-
激活 filebeat mysql 模块
filebeat modules enable mysql关于 Filebeat mysql 模块介绍见这里:https://www.elastic.co/guide/en/beats/filebeat/master/filebeat-module-mysql.html
-
设置初始化环境
filebeat setup -e -
慢查询日志抓取目录路径
这里设置为:/data1/web/slow-query/original/*.log路径
vim /etc/filebeat/modules.d/mysql.yml- module: mysqlerror:enabled: falseslowlog:enabled: truevar.paths: ["/data1/web/slow-query/original/*.log"] -
Filebeat MySQL 慢查询日志解析配置
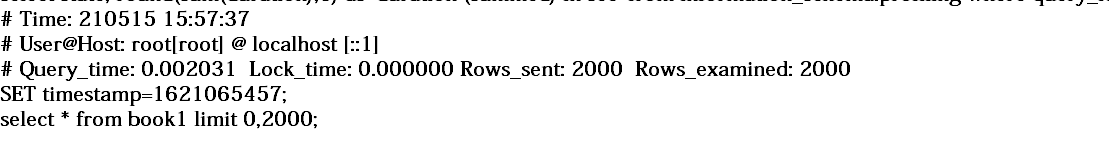
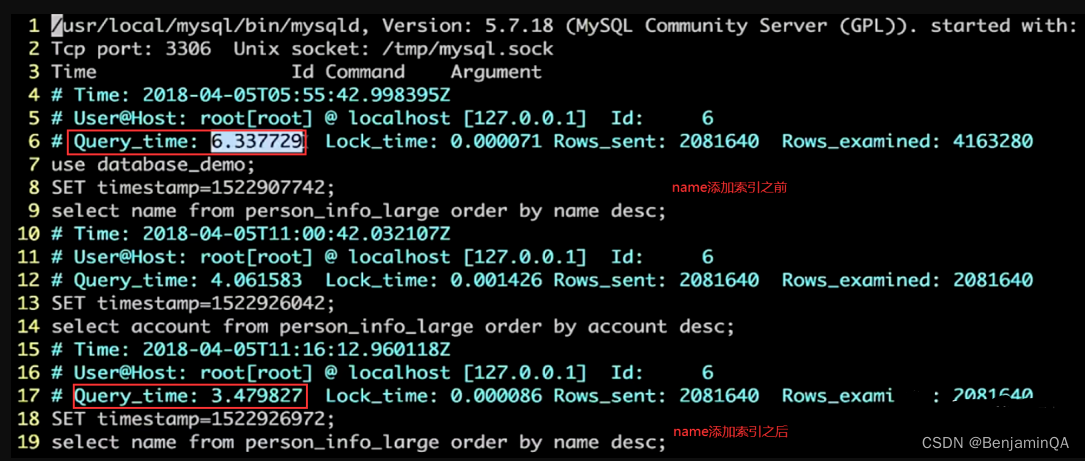
由于我们 MySQL 使用云提供商的 SQL 服务,但是云提供商的 MySQL 实例慢查询日志格式和自搭的有略微的区别,不太是很标准,所以需要自定义日志格式解析表达式,正则表达式符合 logstash Grok 语法,可以在这里调试正则表达式:http://grokdebug.herokuapp.com/。关于 Grok 正则语法的学习资料可以看看这两篇文章,这里不做介绍:ELK实战 - Grok简易入门,Logstash 官网:Grok 过滤器插件。我们目前慢查询日志格式样例:
# Time: 2019-10-23T00:00:22.964315Z
# User@Host: db[db] @  [cloudsqlproxy~192.168.1.11]  thread_id: 87983  server_id: 2945557302
# Query_time: 1.649439  Lock_time: 0.000116 Rows_sent: 1  Rows_examined: 1634
use report;
SET timestamp=1571788822;
select * from table where  team_id = 71206683786887168  and  definition_id = 142  and  definition_md5 = 'acd2e0a2fecb08ceb13c6ae'  and  UNIX_TIMESTAMP(create_time) * 1000 <= 1568851199999  order by create_time desc  limit 1;
对应的 Grok 正则:
说明:在 Grok 中转义一个字符使用一个\而不是两个\,比如要转义[需要写成\[。^# Time: %{TIMESTAMP_ISO8601:mysql.slowlog.time}\n# User@Host: %{USER:mysql.slowlog.user}[%{USER:mysql.slowlog.current_user}] @ %{HOSTNAME:mysql.slowlog.host}? [([a-zA-Z~])?%{IP:mysql.slowlog.ip}?]%{SPACE}(Id:%{SPACE}%{NUMBER:mysql.slowlog.id:int})?(%{SPACE}thread_id:%{SPACE}%{NUMBER:mysql.slowlog.thread_id:int})?(%{SPACE}server_id:%{SPACE}%{NUMBER:mysql.slowlog.server_id})?\n# Query_time: %{NUMBER:mysql.slowlog.query_time.sec:float}%{SPACE}Lock_time: %{NUMBER:mysql.slowlog.lock_time.sec:float}%{SPACE}Rows_sent: %{NUMBER:mysql.slowlog.rows_sent:int}%{SPACE}Rows_examined: %{NUMBER:mysql.slowlog.rows_examined:float}\n((use|USE) .;\n)?SET timestamp=%{NUMBER:mysql.slowlog.timestamp};\n%{GREEDYDATA:mysql.slowlog.query}
将调试好的 Grok 正则写入下面文件中:
说明: 写入下面 pipeline.json 文件中的正则特殊字符需要两个\转义,比如要转义[需要写成\\[。
/usr/share/filebeat/module/mysql/slowlog/ingest/pipeline.json
{"description": "Pipeline for parsing MySQL slow logs.","processors": [{"grok": {"field": "message","patterns":["^# Time: %{TIMESTAMP_ISO8601:mysql.slowlog.time}\n# User@Host: %{USER:mysql.slowlog.user}\\[%{USER:mysql.slowlog.current_user}\\] @ %{HOSTNAME:mysql.slowlog.host}? \\[([a-zA-Z~]*)?%{IP:mysql.slowlog.ip}?\\]%{SPACE}(Id:%{SPACE}%{NUMBER:mysql.slowlog.id:int})?(%{SPACE}thread_id:%{SPACE}%{NUMBER:mysql.slowlog.thread_id:int})?(%{SPACE}server_id:%{SPACE}%{NUMBER:mysql.slowlog.server_id})?\n# Query_time: %{NUMBER:mysql.slowlog.query_time.sec:float}%{SPACE}Lock_time: %{NUMBER:mysql.slowlog.lock_time.sec:float}%{SPACE}Rows_sent: %{NUMBER:mysql.slowlog.rows_sent:int}%{SPACE}Rows_examined: %{NUMBER:mysql.slowlog.rows_examined:float}\n((use|USE) .*;\n)?SET timestamp=%{NUMBER:mysql.slowlog.timestamp};\n%{GREEDYDATA:mysql.slowlog.query}"],"pattern_definitions" : {"GREEDYMULTILINE" : "(.|\n)*"},"ignore_missing": false}}, {"remove":{"field": "message"}}, {"date": {"field": "mysql.slowlog.time","target_field": "@timestamp","formats": ["ISO8601"],"ignore_failure": true}}],"on_failure" : [{"set" : {"field" : "error.message","value" : "{{ _ingest.on_failure_message }}"}}]}
/usr/share/filebeat/module/mysql/slowlog/config/slowlog.yml 文件调整如下:
type: logpaths:{{ range $i, $path := .paths }}- {{$path}}{{ end }}exclude_files: ['.gz$']multiline:pattern: '^# Time:'negate: truematch: afterexclude_lines: ['^[\/\w\.]+, Version: .* started with:.*'] # Exclude the header
启动 filebeat 开始日志收集:
systemctl start filebeat
Kibana 可视化查询
在 Kibana 界面创建 filebeat 索引即可实时查看慢查询日志,举例:查看最近 7 天 10s ~ 20s 的慢查询记录:

遇到的问题及解决方法
Kibana 首次查看上面建立的索引数据可能会报类似下面的错误,主要原因是单条日志事件过长 Kibana 有限制:
Request to Elasticsearch failed: {"error":{"root_cause":[{"type":"illegal_argument_exception","reason":"The length of [error.message] field of [JHzl020BgPENHIlNYRoc] doc of [filebeat-7.4.0-2019.10.16-000001] index has exceeded [1000000] - maximum allowed to be analyzed for highlighting. This maximum can be set by changing the [index.highlight.max_analyzed_offset] index level setting. For large texts, indexing with offsets or term vectors is recommended!"}],"type":"search_phase_execution_exception","reason":"all shards failed","phase":"query","grouped":true,"failed_shards":[{"shard":0,"index":"filebeat-7.4.0-2019.10.16-000001","node":"H_Zq22spSJKz0RWR_alDsA","reason":{"type":"illegal_argument_exception","reason":"The length of [error.message] field of [JHzl020BgPENHIlNYRoc] doc of [filebeat-7.4.0-2019.10.16-000001] index has exceeded [1000000] - maximum allowed to be analyzed for highlighting. This maximum can be set by changing the [index.highlight.max_analyzed_offset] index level setting. For large texts, indexing with offsets or term vectors is recommended!"}}],"caused_by":{"type":"illegal_argument_exception","reason":"The length of [error.message] field of [JHzl020BgPENHIlNYRoc] doc of [filebeat-7.4.0-2019.10.16-000001] index has exceeded [1000000] - maximum allowed to be analyzed for highlighting. This maximum can be set by changing the [index.highlight.max_analyzed_offset] index level setting. For large texts, indexing with offsets or term vectors is recommended!","caused_by":{"type":"illegal_argument_exception","reason":"The length of [error.message] field of [JHzl020BgPENHIlNYRoc] doc of [filebeat-7.4.0-2019.10.16-000001] index has exceeded [1000000] - maximum allowed to be analyzed for highlighting. This maximum can be set by changing the [index.highlight.max_analyzed_offset] index level setting. For large texts, indexing with offsets or term vectors is recommended!"}}},"status":400}
解决方法:
打开 Kibana --> Management --> Advanced Settings --> Highlight results 开关关闭。
关于 Filebeat 的一些使用心得
1. yum 方式安装的 Filebeat 其日志如何查看?
- journalctl -u filebeat -f
- tail -f /var/log/filebeat/filebeat
2. Filebeat 状态清理:清理 registry
有时候我们需要清理下 Filebeat 状态,从头开始读取日志,yum 方式安装的 filebeat 直接清理 /var/lib/filebeat/registry 文件夹即可。
参考文档
https://xiezefan.me/2017/04/09/elk_in_action_grok_start/ | Grok 简易入门
https://github.com/elastic/logstash/blob/v1.4.2/patterns/grok-patterns | Grok 本身支持的模式列表
https://churrops.io/2018/06/18/elastic-modulo-mysql-do-filebeat-para-capturar-slowlogs-slow-queries/
https://discuss.elastic.co/t/filebeat-mysql-module-slowlog-error-message-provided-grok-expressions-do-not-match-field-value/135945