下面介绍几种获取app流量的统计规则:

分析方法D
①如何获取uid?
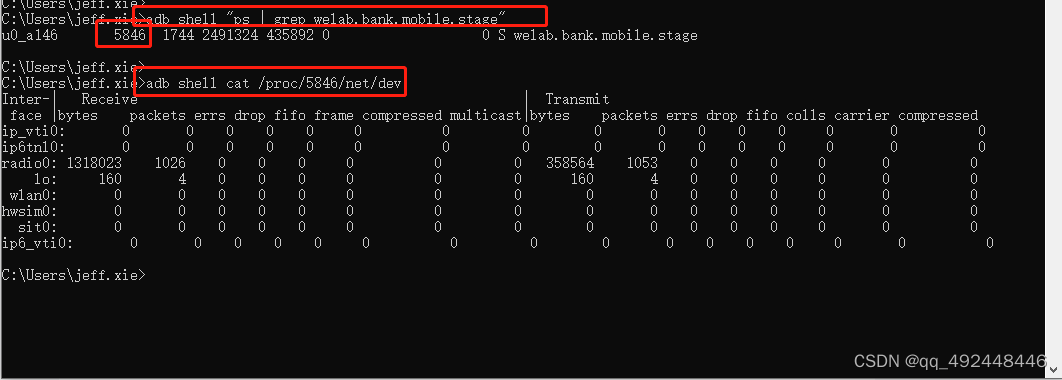
1.先获取进程pid (adb shell ps |findstr 包名)
2.进入到proc/pid/status 文件中
C:\Users\chenhui>adb shell
PD1816:/ $ cd proc/
PD1816:/proc $ cd 20814
PD1816:/proc/20814 $ cd status
/system/bin/sh: cd: /proc/20814/status: Not a directory
2|PD1816:/proc/20814 $ cat status
Name:   aozh.iReader.dj
State:  S (sleeping)
Tgid:   20814
Pid:    20814
PPid:   996
TracerPid:      0
Uid:    12912   12912   12912   12912
Gid:    12912   12912   12912   12912
Ngid:   0
FDSize: 1024
Groups: 3002 3003 9997 22912 52912
VmPeak:  2600288 kB
VmSize:  2284916 kB
VmLck:         0 kB
VmPin:         0 kB
VmHWM:    454092 kB
VmRSS:    317620 kB
VmData:   492016 kB
VmStk:      8192 kB
VmExe:        24 kB
VmLib:    162604 kB
VmPTE:      2468 kB
VmPMD:        16 kB
VmSwap:     4752 kB
Threads:        205
SigQ:   1/21806
SigPnd: 0000000000000000
ShdPnd: 0000000000000000
SigBlk: 0000000000001204
SigIgn: 0000000000000001
SigCgt: 00000006400086f8
CapInh: 0000000000000000
CapPrm: 0000000000000000
CapEff: 0000000000000000
CapBnd: 0000000000000000
CapAmb: 0000000000000000
Seccomp:        2Speculation_Store_Bypass:       unknown
Cpus_allowed:   ff
Cpus_allowed_list:      0-7
Mems_allowed:   1
Mems_allowed_list:      0
voluntary_ctxt_switches:        22752
nonvoluntary_ctxt_switches:     3041
PD1816:/proc/20814 $
②但是方法D中我们现在的华为、OPPO等高端机中proc系统文件中找不到uid_stat
分析方法E
①方法E中我们现在的华为、OPPO等高端机中proc系统文件中找不到xt_qtaguid
若设备使用的是WiFi,则取第2列的值为“wlan0”的第6列的值相加为当前app的下载流量统计;
第8列的值相加为当前app的上传流量统计
C:\Users\chenhui>adb shell "cat /proc/net/xt_qtaguid/stats |grep 12912"
100 wlan0 0x0 12912 0 2456833 3078 524138 3195 2454245 3041 0 0 2588 37 524138 3195 0 0 0 0
101 wlan0 0x0 12912 1 386386297 287026 14115763 189232 386381873 286965 0 0 4424 61 14115763 189232 0 0 0 0
110 wlan0 0xa00500000000 12912 0 0 0 0 0 0 0 0 0 0 0 0 0 0 0 0 0
111 wlan0 0xa00500000000 12912 1 99440 173 29904 233 99440 173 0 0 0 0 29904 233 0 0 0 0
128 wlan0 0x3494e3bf00000000 12912 0 0 0 0 0 0 0 0 0 0 0 0 0 0 0 0 0
129 wlan0 0x3494e3bf00000000 12912 1 66397 93 11360 111 66397 93 0 0 0 0 11360 111 0 0 0 0
148 wlan0 0xe9970c8000000000 12912 0 0 0 0 0 0 0 0 0 0 0 0 0 0 0 0 0
149 wlan0 0xe9970c8000000000 12912 1 3305 45 55154 36 3305 45 0 0 0 0 55154 36 0 0 0 0
182 lo 0x0 12912 0 0 0 0 0 0 0 0 0 0 0 0 0 0 0 0 0
183 lo 0x0 12912 1 8250787 1134 8250995 1138 8250787 1134 0 0 0 0 8250995 1138 0 0 0 0
若设备使用的是SIM联网,则取第2列的值为“rmnet_data1”的第6列的值相加为当前app的下载流量统计;第8列的值相加为当前app的上传流量统计
C:\Users\chenhui>adb shell "cat /proc/net/xt_qtaguid/stats | grep 12912"
82 rmnet_data1 0x0 12912 0 12650 22 5107 23 12650 22 0 0 0 0 5107 23 0 0 0 0
83 rmnet_data1 0x0 12912 1 6817945 4636 442095 4175 6817945 4636 0 0 0 0 442095 4175 0 0 0 0
86 rmnet_data1 0xa00500000000 12912 0 0 0 0 0 0 0 0 0 0 0 0 0 0 0 0 0
87 rmnet_data1 0xa00500000000 12912 1 5191 11 1517 14 5191 11 0 0 0 0 1517 14 0 0 0 0
90 rmnet_data1 0x3494e3bf00000000 12912 0 0 0 0 0 0 0 0 0 0 0 0 0 0 0 0 0
91 rmnet_data1 0x3494e3bf00000000 12912 1 3348 4 541 5 3348 4 0 0 0 0 541 5 0 0 0 0
188 wlan0 0x0 12912 0 7835694 7452 855519 6701 7832698 7409 0 0 2996 43 855519 6701 0 0 0 0
189 wlan0 0x0 12912 1 393639609 293035 14856894 194340 393635105 292973 0 0 4504 62 14856894 194340 0 0 0 0
198 wlan0 0xa00500000000 12912 0 5099 9 1394 12 5099 9 0 0 0 0 1394 12 0 0 0 0
199 wlan0 0xa00500000000 12912 1 104499 181 31258 244 104499 181 0 0 0 0 31258 244 0 0 0 0
220 wlan0 0x3494e3bf00000000 12912 0 3458 5 581 6 3458 5 0 0 0 0 581 6 0 0 0 0
221 wlan0 0x3494e3bf00000000 12912 1 71363 104 12987 126 71363 104 0 0 0 0 12987 126 0 0 0 0
242 wlan0 0xe9970c8000000000 12912 0 0 0 0 0 0 0 0 0 0 0 0 0 0 0 0 0
243 wlan0 0xe9970c8000000000 12912 1 4885 68 82992 55 4885 68 0 0 0 0 82992 55 0 0 0 0
278 lo 0x0 12912 0 0 0 0 0 0 0 0 0 0 0 0 0 0 0 0 0
279 lo 0x0 12912 1 8250787 1134 8250995 1138 8250787 1134 0 0 0 0 8250995 1138 0 0 0 0
注意以上每次打印的值都是当前app累计流量使用值;如果需要查看每秒钟app使用的流量数需要间隔1s分别计算当前app的上传流量&下载流量,并将2次上传和2次下载流量各自相减;
分析方法B
①获取到pid
1.先获取进程pid (adb shell ps |findstr 包名)
2.进入到/proc/pid/net/dev
若设备使用的是SIM联网,则取第1列的值为“rmnet_ipa0”的第2列的值下载流量统计;第10列的值为当前app的上传流量统计
C:\Users\chenhui>adb shell ps |findstr com.chaozh.iReader.dj
u0_a2912     26304   996 2345824 324444 0                   0 S com.chaozh.iReader.djC:\Users\chenhui>adb shell
PD1816:/ $ cd /proc/26304/net
PD1816:/proc/26304/net $ ls
anycast6           icmp                ip_tables_matches nf_conntrack_expect rt6_stats     tcp
arp                icmp6               ip_tables_names   packet              rt_cache      tcp6
arp_tables_matches if_inet6            ip_tables_targets pfkey               sco           udp
arp_tables_names   igmp                ipt_hashlimit     pnp                 sla_log_level udp6
arp_tables_targets igmp6               ipv6_route        pppoe               sla_tcp_info  udplite
bonding            ip6_flowlabel       l2cap             pppol2tp            sla_tcp_stat  udplite6
dev                ip6_tables_matches  mcfilter          protocols           snmp          unix
dev_mcast          ip6_tables_names    mcfilter6         psched              snmp6         wireless
dev_snmp6          ip6_tables_targets  netfilter         ptype               sockstat      xfrm_stat
fib_trie           ip6t_hashlimit      netlink           raw                 sockstat6     xt_qtaguid
fib_triestat       ip_conntrack        netstat           raw6                softnet_stat  xt_quota
hci                ip_conntrack_expect nf_conntrack      route               stat
PD1816:/proc/26304/net $ cat dev
Inter-|   Receive                                                |  Transmitface |bytes    packets errs drop fifo frame compressed multicast|bytes    packets errs drop fifo colls carrier compressed
ip_vti0:       0       0    0    0    0     0          0         0        0       0    0    0    0     0       0          0
r_rmnet_data6:       0       0    0    0    0     0          0         0        0       0    0    0    0     0       0          0sit0:       0       0    0    0    0     0          0         0        0       0    0    0    0     0       0          0
rmnet_data7:       0       0    0    0    0     0          0         0        0       0    0    0    0     0       0          0lo: 154760401   20782    0    0    0     0          0         0 154760401   20782    0    0    0     0       0          0
r_rmnet_data5:       0       0    0    0    0     0          0         0        0       0    0    0    0     0       0          0
rmnet_data4:       0       0    0    0    0     0          0         0        0       0    0    0    0     0       0          0
dummy0:       0       0    0    0    0     0          0         0     2660      38    0    0    0     0       0          0
ip6_vti0:       0       0    0    0    0     0          0         0        0       0    0    0    0     0       0          0
r_rmnet_data4:       0       0    0    0    0     0          0         0        0       0    0    0    0     0       0          0
rmnet_data3:       0       0    0    0    0     0          0         0        0       0    0    0    0     0       0          0wlan0: 7677506219 10137009    0    0    0     0          0         0 266420112 3046370    0   23    0     0       0          0
rmnet_data0:    4552      58    0    0    0     0          0         0     4018      44    0    0    0     0       0          0
r_rmnet_data3:       0       0    0    0    0     0          0         0        0       0    0    0    0     0       0          0
ip6tnl0:       0       0    0    0    0     0          0         0        0       0    0    0    0     0       0          0
rmnet_ipa0: 53214950   16347    0    0    0     0          0         0  2893836   27721    0    0    0     0       0          0p2p0:       0       0    0    0    0     0          0         0        0       0    0    0    0     0       0          0
r_rmnet_data2:       0       0    0    0    0     0          0         0        0       0    0    0    0     0       0          0bond0:       0       0    0    0    0     0          0         0        0       0    0    0    0     0       0          0
rmnet_data6:       0       0    0    0    0     0          0         0        0       0    0    0    0     0       0          0
r_rmnet_data1:       0       0    0    0    0     0          0         0        0       0    0    0    0     0       0          0
rmnet_data5:       0       0    0    0    0     0          0         0        0       0    0    0    0     0       0          0
r_rmnet_data0:       0       0    0    0    0     0          0         0        0       0    0    0    0     0       0          0
rmnet_data2:  579080    1445    0    0    0     0          0         0   248432    1523    0    0    0     0       0          0
r_rmnet_data8:       0       0    0    0    0     0          0         0        0       0    0    0    0     0       0          0
rmnet_data1: 52111442   41811    0    0    0     0          0         0  2641386   26154    0    0    0     0       0          0
r_rmnet_data7:       0       0    0    0    0     0          0         0        0       0    0    0    0     0       0          0
PD1816:/proc/26304/net $
若设备使用的WiFi联网,则取第1列的值为“wlan0:”的第2列的值下载流量统计;第10列的值为当前app的上传流量统计
C:\Users\chenhui>adb shell
PD1816:/ $ cd proc
PD1816:/proc $ cd 26304
PD1816:/proc/26304 $ ls
ls: ./cwd: Permission denied
ls: ./root: Permission denied
ls: ./exe: Permission denied
attr      clear_refs      cpuset  io        mem        net       oom_score_adj sched                schedstat statm   time_in_state
autogroup cmdline         environ limits    mountinfo  ns        pagemap       sched_group_id       smaps     status  timerslack_ns
auxv      comm            fd      map_files mounts     oom_adj   personality   sched_init_task_load stack     syscall virt
cgroup    coredump_filter fdinfo  maps      mountstats oom_score reclaim       sched_wake_up_idle   stat      task    wchan
1|PD1816:/proc/26304 $ cd net
PD1816:/proc/26304/net $ cat dev
Inter-|   Receive                                                |  Transmitface |bytes    packets errs drop fifo frame compressed multicast|bytes    packets errs drop fifo colls carrier compressed
ip_vti0:       0       0    0    0    0     0          0         0        0       0    0    0    0     0       0          0
r_rmnet_data6:       0       0    0    0    0     0          0         0        0       0    0    0    0     0       0          0sit0:       0       0    0    0    0     0          0         0        0       0    0    0    0     0       0          0
rmnet_data7:       0       0    0    0    0     0          0         0        0       0    0    0    0     0       0          0lo: 154760401   20782    0    0    0     0          0         0 154760401   20782    0    0    0     0       0          0
r_rmnet_data5:       0       0    0    0    0     0          0         0        0       0    0    0    0     0       0          0
rmnet_data4:       0       0    0    0    0     0          0         0        0       0    0    0    0     0       0          0
dummy0:       0       0    0    0    0     0          0         0     2660      38    0    0    0     0       0          0
ip6_vti0:       0       0    0    0    0     0          0         0        0       0    0    0    0     0       0          0
r_rmnet_data4:       0       0    0    0    0     0          0         0        0       0    0    0    0     0       0          0
rmnet_data3:       0       0    0    0    0     0          0         0        0       0    0    0    0     0       0          0wlan0: 7688486290 10146181    0    0    0     0          0         0 267426741 3054418    0   23    0     0       0          0
rmnet_data0:    4552      58    0    0    0     0          0         0     4018      44    0    0    0     0       0          0
r_rmnet_data3:       0       0    0    0    0     0          0         0        0       0    0    0    0     0       0          0
ip6tnl0:       0       0    0    0    0     0          0         0        0       0    0    0    0     0       0          0
rmnet_ipa0: 53290118   16560    0    0    0     0          0         0  2951245   28076    0    0    0     0       0          0p2p0:       0       0    0    0    0     0          0         0        0       0    0    0    0     0       0          0
r_rmnet_data2:       0       0    0    0    0     0          0         0        0       0    0    0    0     0       0          0bond0:       0       0    0    0    0     0          0         0        0       0    0    0    0     0       0          0
rmnet_data6:       0       0    0    0    0     0          0         0        0       0    0    0    0     0       0          0
r_rmnet_data1:       0       0    0    0    0     0          0         0        0       0    0    0    0     0       0          0
rmnet_data5:       0       0    0    0    0     0          0         0        0       0    0    0    0     0       0          0
r_rmnet_data0:       0       0    0    0    0     0          0         0        0       0    0    0    0     0       0          0
rmnet_data2:  579080    1445    0    0    0     0          0         0   248432    1523    0    0    0     0       0          0
r_rmnet_data8:       0       0    0    0    0     0          0         0        0       0    0    0    0     0       0          0
rmnet_data1: 52182746   42133    0    0    0     0          0         0  2698795   26509    0    0    0     0       0          0
r_rmnet_data7:       0       0    0    0    0     0          0         0        0       0    0    0    0     0       0          0
PD1816:/proc/26304/net $
注意以上每次打印的值都是当前app累计流量使用值;如果需要查看每秒钟app使用的流量数需要间隔1s分别计算当前app的上传流量&下载流量,并将2次上传和2次下载流量各自相减;