原文:http://www.codeproject.com/Articles/9815/Visual-Leak-Detector-Enhanced-Memory-Leak-Detectio
Table of Contents
- Introduction
- What's New?
- Using Visual Leak Detector
- Making a Memory Leak Detector
- Key Parts of the Source Code
- Known Bugs and Restrictions
- Credits
- References
- License
- History
Introduction
Visual C++ provides built-in memory leak detection, but its capabilities are minimal at best. This memory leak detector was created as a free alternative to the built-in memory leak detector provided with Visual C++. Here are some of Visual Leak Detector's features, none of which exist in the built-in detector:
- Provides a complete stack trace for each leaked block, including source file and line number information when available.
- Provides complete data dumps (in hex and ASCII) of leaked blocks.
- Customizable level of detail in the memory leak report.
Other after-market leak detectors for Visual C++ are already available. But most of the really popular ones, like Purify and BoundsChecker, are very expensive. A few free alternatives exist, but they're often too intrusive, restrictive, or unreliable. Here are some key advantages that Visual Leak Detector has over many other free alternatives:
- Visual Leak Detector is cleanly packaged as an easy-to-use library. You don't need to compile its source code to use it. And you only need to make minor additions to your own source code to integrate it with your program.
- In addition to providing stack traces with source files, line numbers, and function names, Visual Leak Detector also provides data dumps.
- It works with both C++ and C programs (compatible with both
new/deleteandmalloc/free). - The full source code to the library is included and it is well documented, so it is easy to customize it to suit your needs.
Visual Leak Detector is licensed free of charge as a service to the Windows developer community.
What's New?
14 November 2006: A new beta version has been posted. This version fixes a few bugs, most notably a deadlock bug and a couple of failed assertion bugs that were identified in the 1.9c beta.
Note that the beta version does not have the same limitations of the 1.0 version. Whereas 1.0 can only detect leaks resulting from new or malloc, the beta can detect many different classes of leaks.
Please also note that the article below describes the inner workings of the 1.0 version. Because the beta version might change significantly before the next official release, the article will not be updated to reflect the design of the beta version until the official release is complete.
Using Visual Leak Detector
This section briefly describes the basics of using Visual Leak Detector (VLD). For a more in-depth discussion of the configuration options, runtime APIs, and a discussion of the more advanced usage scenarios (such as using VLD with DLLs), please see the full documentation included in the downloadable Zip files.
To use VLD with your project, follow these simple steps:
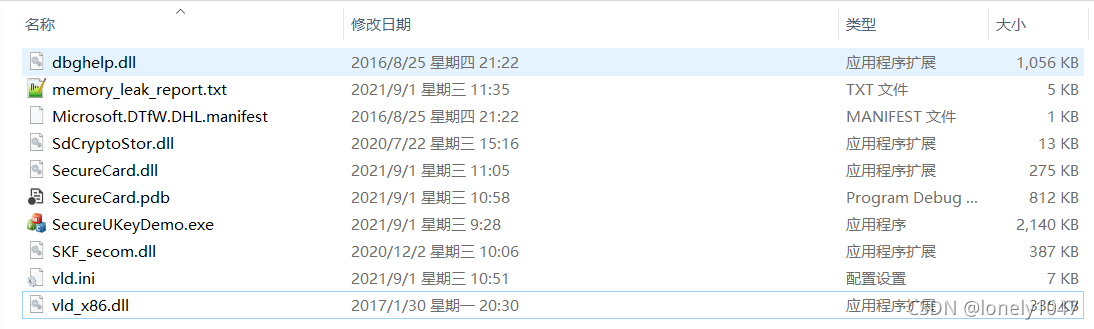
- Copy the VLD library (*.lib) files to your Visual C++ installation's "lib" subdirectory.
- Copy the VLD header files (vld.h and vldapi.h) to your Visual C++ installation's "include" subdirectory.
- In the source file containing your program's main entry point, include the vld.h header file. It's best, but not absolutely required, to include this header before any other header files, except for stdafx.h. If the source file, include stdafx.h, then vld.h should be included after it.
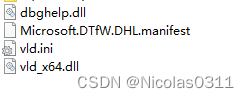
- If you are running Windows 2000 or earlier, then you will need to copy dbghelp.dll to the directory where the executable being debugged resides.
- Build the debug version of your project.
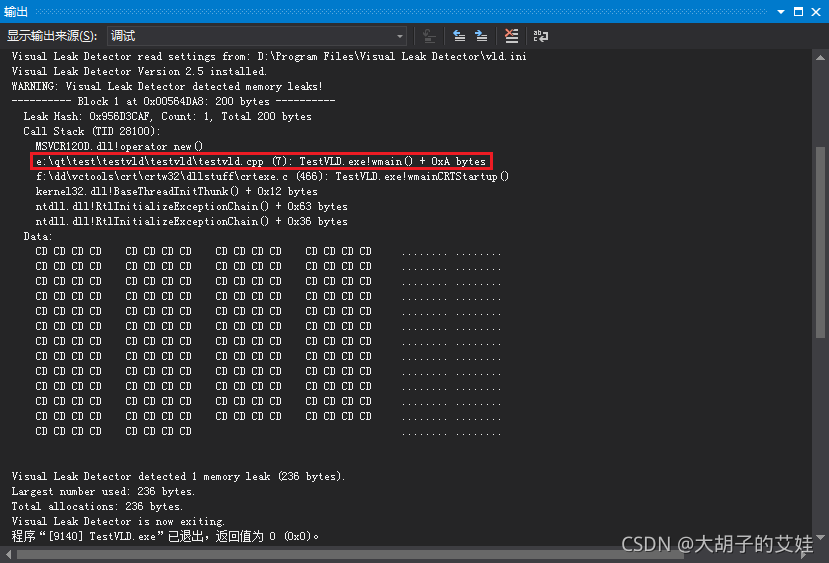
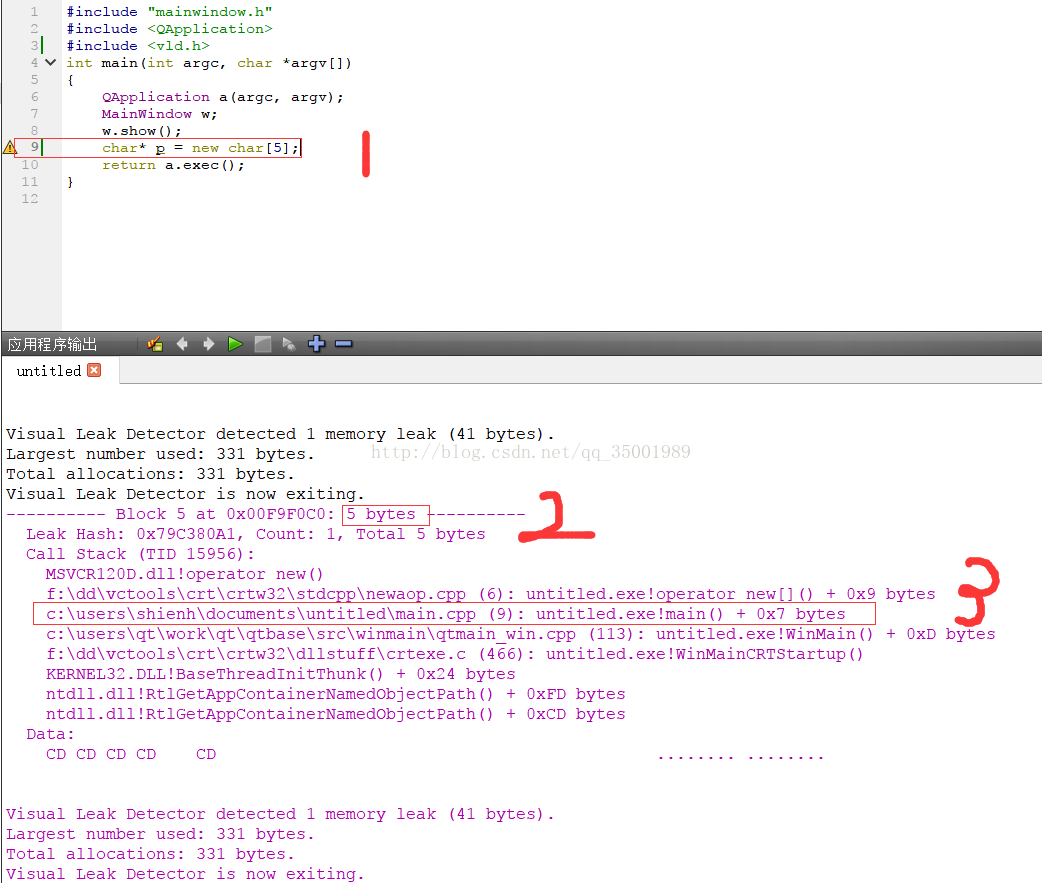
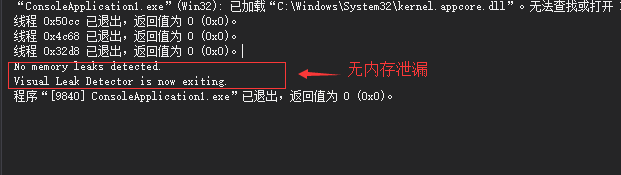
VLD will detect memory leaks in your program whenever you run the debug version under the Visual C++ debugger. A report of all the memory leaks detected will be displayed in the debugger's output window when your program exits. Double-clicking on a source file's line number in the memory leak report will take you to that file and line in the editor window, allowing easy navigation of the code path leading up to the allocation that resulted in a memory leak.
Note: When you build release versions of your program, VLD will not be linked into the executable. So it is safe to leave vld.h included in your source files when doing release builds. Doing so will not result in any performance degradation or any other undesirable overhead.
Making a Memory Leak Detector
The goal of Visual Leak Detector was to build a better replacement for the memory leak detector built-in to Visual C++. With that in mind, I set out to use the same method used by the built-in detector, namely the CRT Debug Heap. But this new detector would provide enhancements -- primarily full stack traces, which can beextremely helpful for finding and fixing leaks.
The Built-In Detector
The built-in detector is pretty simple really. When a program is exiting, the CRT runs a bunch of cleanup code after main returns. If the built-in detector is enabled, then it runs a memory leak check as part of the cleanup procedure. The memory leak check simply looks at the debug heap: if there are any user blocks still allocated on the debug heap, then they must be memory leaks. The debug version of malloc stores the file and line number that allocated each block in the block's header at the time it is allocated. When the built-in detector identifies a memory leak, it simply peers inside the block header to get the file and line number. It then reports that information to the debugger where it is displayed.
Note that the built-in detector detects leaks without doing any monitoring of allocations or frees. It simply takes a snapshot of the heap just before the process terminates and determines if there are any leaks based on that snapshot. A snapshot of the heap only tells us if there are leaks; it does not tell us how they were leaked. Clearly, to determine the "how" we also need to obtain a stack trace. But to obtain a stack trace, we need to be able to monitor every allocation on-the-fly at runtime. This is what will distinguish our leak detector from the built-in one.
Allocation Hooking
Luckily for us, Microsoft has provided an easy way to monitor every allocation made from the debug heap: allocation hooks. An allocation hook is simply a user-supplied callback function that will be called just before each allocation is made from the debug heap. Microsoft has provided a function, _CrtSetAllocHook, which registers the allocation hook function with the debug heap. When the debug heap calls the allocation hook, one of the arguments passed is an ID number that uniquely identifies each allocation -- it's basically a serial number for each memory block allocated. There's not enough room in the memory block header for us to record any information directly in it, but we can use this unique ID number as a key to map each block to any data that we want to record.
Walking the Stack
Now that we have a way to be notified every time a block is allocated, as well as a way to uniquely identify each allocation, all that's left to do is to record the call stack each time an allocation occurs. We could conceivably attempt to unwind the stack ourselves using inline assembly. But stack frames can be organized in different ways, depending on compiler optimizations and calling conventions, so it could become complicated to do it that way. Once again, Microsoft has provided us with a tool to help us out. This time it is a function that we can call iteratively to walk the stack, frame by frame. That function is StackWalk64. It is part of the Debug Help Library (dbghelp.dll). As long as we provide it with the information that it needs to establish a starting "frame of reference", so to speak, it can examine our stack from there and reliably unwind it for us. Each timeStackWalk64 is called, it gives back a STACKFRAME64 structure that can be reused as input for the next call toStackWalk64. It can be repeatedly called this way until the end of the stack is reached.
Initializing the Memory Leak Detector
We now have the beginnings of a better memory leak detector. We can monitor every allocation, and for each allocation monitored, we can obtain and record a stack trace. The only challenge that remains is to ensure that the allocation hook function is registered with the debug heap as soon as the program starts executing. This can be very simply solved by creating a global instance of a C++ class object. The constructor will run when the program is initialized. From the constructor, we can call _CrtSetAllocHook to register our allocation hook function. But wait, what if the program we are debugging already has other global C++ class objects that allocate memory? How can we ensure that our constructor will be called first, and that our allocation hook function will be installed before any other global objects are constructed? Unfortunately, the C++ specification does not spell out any rules for deciding in which order to construct global objects. So there are no absolute guarantees that our constructor will be called first. But we can come very close to guaranteeing it. We can leverage a compiler-specific preprocessor directive that explicitly tells the compiler to ensure that our global variable is constructed as soon as possible: #pragma init_seg (compiler). This directive tells the compiler to place our global object in the "compiler" initialization segment. Objects in this segment are the first to be constructed. Next, objects in the "library" segment are constructed, and objects in the "user" segment are constructed last. The "user" segment is the default segment for global objects. Generally speaking, no normal user objects should ever be placed in the "compiler" segment, so this provides a reasonable amount of certainty that our global object will be constructed before any user objects.
Detecting Memory Leaks
Because global objects are destroyed in the inverse order they are constructed, our global object will be destroyed after any user objects. We can then examine the heap, just like the built-in detector does. If we find a block on the heap that has not been freed, it is a leak and we can look up its call stack using the unique ID number recorded by our allocation hook function. An STL map would work fine here for mapping the ID number to the call stacks. I didn't use an STL map because I wanted my library to be compatible with both new and old versions of Visual C++. The STL from older versions is incompatible with the newer versions, so I couldn't use STL components. But the good news is that this gave me the opportunity to create a data structure similar in concept to the STL map, but with specific optimizations for use with my memory leak detector.
Do you remember that the built-in leak detector peers inside the memory block to get the name of the file and the line number where the block was allocated? Well, all we have for our call stack is a bunch of program addresses. Dumping all those hex numbers to the debugger wouldn't be of much use. To make those addresses more meaningful, we need to translate them to human readable information: files and line numbers (and function names too). Once again, Microsoft comes through with the tools that will help us do our job: the symbol handler APIs. Like StackWalk64, they also happen to be part of the Debug Help Library. I won't dwell on them in detail here, because there are a lot of them and they're pretty simple to use. They don't require as much ingenuity to use as StackWalk64 does. We can use two of the symbol handler APIs to get the filenames, line numbers, and function names that we want. The aptly named SymGetLineFromAddr64 translates addresses into source filenames and line numbers. Its sister API, SymFromAddr translates addresses into symbol names. For program addresses, which are what we have, the corresponding symbol name will be the name of the function containing that program address.
Key Parts of the Source Code
In case you got bored with the above section and skipped ahead, I'll summarize it here. In a nutshell, this memory leak detector works like this:
- A global object is automatically constructed. It is the first object constructed. The constructor registers our allocation hook function.
- Every allocation eventually calls our allocation hook function. The allocation hook function obtains and records the call stack for each allocation. The call stack information is recorded in a specialized STL-like map.
- When the program terminates, the global object is the last object destroyed. It examines the heap and identifies leaks. Leaked blocks are looked up in the map and matched with their corresponding call stack. The resulting data is sent to the debugger to be displayed.
Step 1: Registering the Allocation Hook
Here is the VisualLeakDetector class constructor. Note the call to _CrtSetAllocHook. This is where our callback function, allochook, is registered with the debug heap. The call to linkdebughelplibrary performs an explicit dynamic link with the Debug Help Library (dbghelp.dll). Because VLD is itself a library, implicitly linking with the Debug Help Library through the import library dbghelp.lib is undesirable; it would make the VLD library dependent on dbghelp.lib at link-time. dbghelp.lib will not be present on many Windows computers and it's not redistributable, so we need to link with the DLL at runtime in order to bypass the import library. There is a lot of other stuff going on in here as well, but most of it has to do with custom configuration options that VLD supports.
// Constructor - Dynamically links with the Debug Help Library and installs the
//   allocation hook function so that the C runtime's debug heap manager will
//   call the hook function for every heap request.
//
VisualLeakDetector::VisualLeakDetector ()
{// Initialize private data.
    m_mallocmap    = new BlockMap;m_process      = GetCurrentProcess();m_selftestfile = __FILE__;m_status       = 0x0;m_thread       = GetCurrentThread();m_tlsindex     = TlsAlloc();if (_VLD_configflags & VLD_CONFIG_SELF_TEST) {// Self-test mode has been enabled.
        // Intentionally leak a small amount of
        // memory so that memory leak self-checking can be verified.
        strncpy(new char [21], "Memory Leak Self-Test", 21);m_selftestline = __LINE__;}if (m_tlsindex == TLS_OUT_OF_INDEXES) {report("ERROR: Visual Leak Detector:" " Couldn't allocate thread local storage.\n");}else if (linkdebughelplibrary()) {// Register our allocation hook function with the debug heap.
        m_poldhook = _CrtSetAllocHook(allochook);report("Visual Leak Detector " "Version "VLD_VERSION" installed ("VLD_LIBTYPE").\n");reportconfig();if (_VLD_configflags & VLD_CONFIG_START_DISABLED) {// Memory leak detection will initially be disabled.
            m_status |= VLD_STATUS_NEVER_ENABLED;}m_status |= VLD_STATUS_INSTALLED;return;}report("Visual Leak Detector is NOT installed!\n");
}
Step 2: Walking the Stack
Here is the function responsible for obtaining call stacks. This is perhaps the trickiest part of the entire program. Setting up for the first call to StackWalk64 is where the tricky bit is. To start the stack trace, StackWalk64needs to know exactly where on the stack to begin walking. It never assumes that we want to start tracing from the current stack frame. This requires that we provide it with the address of the current frame, as well as the current program address. I've seen other examples that attempt to get this information by callingGetThreadContext to retrieve the current thread's context, which would contain both of the required addresses. But, as its documentation clearly states, GetThreadContext can't be relied upon to get valid information for a running thread. By definition, this means that GetThreadContext can't get a valid context for the current thread. A better approach is to get the required addresses directly, and the only way to do that is with inline assembly.
Obtaining the address of the current frame is easy: it's stored in a CPU register (EBP) that we can directly read it from. The program address is a little harder to obtain. Though there is a CPU register (EIP) that always contains the current program address, on Intel x86 CPUs, it can't be read by software. But we can get the same address in a round-about way, by calling another function and from within that function obtaining the return address. The return address is the same as the program address that called the function. For this, I've created a separate function, getprogramcounterx86x64. Since we're already doing inline assembly, we could write a simple function call in assembly, instead of writing another C++ function, but to keep it easier to understand, I've used C++ wherever it's possible to do so.
In the following code, pStackWalk64, pSymFunctionTableAccess64 and pSymGetModuleBase64 are all pointers to the functions exported by dbghelp.dll.
// getstacktrace - Traces the stack, starting from this function, as far
//   back as possible.
//
//  - callstack (OUT): Pointer to an empty CallStack to be populated with
//    entries from the stack trace.
//
//  Return Value:
//
//    None.
//
void VisualLeakDetector::getstacktrace (CallStack *callstack)
{DWORD        architecture;CONTEXT      context;unsigned int count = 0;STACKFRAME64 frame;DWORD_PTR    framepointer;DWORD_PTR    programcounter;// Get the required values for initialization of the STACKFRAME64 structure
    // to be passed to StackWalk64(). Required fields are AddrPC and AddrFrame.
#if defined(_M_IX86) || defined(_M_X64)architecture = X86X64ARCHITECTURE;programcounter = getprogramcounterx86x64();__asm mov [framepointer], BPREG // Get the frame pointer (aka base pointer)
#else
// If you want to retarget Visual Leak Detector to another processor
// architecture then you'll need to provide architecture-specific code to
// retrieve the current frame pointer and program counter in order to initialize
// the STACKFRAME64 structure below.
#error "Visual Leak Detector is not supported on this architecture."
#endif // defined(_M_IX86) || defined(_M_X64)
// Initialize the STACKFRAME64 structure.
    memset(&frame, 0x0, sizeof(frame));
    frame.AddrPC.Offset    = programcounter;
    frame.AddrPC.Mode      = AddrModeFlat;
    frame.AddrFrame.Offset = framepointer;
    frame.AddrFrame.Mode   = AddrModeFlat;
// Walk the stack.
    while (count < _VLD_maxtraceframes) {count++;
        if (!pStackWalk64(architecture, m_process, m_thread, &frame, &context, NULL, pSymFunctionTableAccess64, pSymGetModuleBase64, NULL)) {// Couldn't trace back through any more frames.
            break;
        }if (frame.AddrFrame.Offset == 0) {// End of stack.
            break;}// Push this frame's program counter onto the provided CallStack.
        callstack->push_back((DWORD_PTR)frame.AddrPC.Offset);}
}
And here is the function that retrieves the EIP register. Again, this has to be done as a separate function call because there is no way for the software to directly read the EIP register. But the same value can be obtained by making a function call, and then from within the called function getting the return address. The return address is the program address that made the function call, and it is pushed onto the stack when the function call is made. We get it by copying it from the stack.
// getprogramcounterx86x64 - Helper function that retrieves the program counter
//   for getstacktrace() on Intel x86 or x64 architectures.
//
//  Note: Inlining of this function must be disabled. The whole purpose of this
//    function's existence depends upon it being a *called* function.
//
//  Return Value:
//
//    Returns the caller's program address.
//
#if defined(_M_IX86) || defined(_M_X64)
#pragma auto_inline(off)
DWORD_PTR VisualLeakDetector::getprogramcounterx86x64 ()
{DWORD_PTR programcounter;// Get the return address out of the current stack frame
    __asm mov AXREG, <BPREG + SIZEOFPTR>// Put the return address into the variable we'll return
    __asm mov [programcounter], AXREGreturn programcounter;
}
#pragma auto_inline(on)
#endif // defined(_M_IX86) || defined(_M_X64)
Step 3: Generating a Better Memory Leak Report
Finally, here is the function that converts the program addresses obtained while walking the stack into useful symbol names. Note that the address-to-symbol conversion code is only run if memory leaks are detected. This avoids having to do symbol lookups on-the-fly while the program is running, which would add considerable additional overhead. Not to mention that it just doesn't make sense to store (large) symbol names for later retrieval when you can store (small) addresses instead.
The CRT doesn't expose any documented method for gaining access to its internal linked-list of allocated memory blocks. This linked list is what is used by the built-in detector for taking a "snapshot" of the heap to determine if there are any memory leaks. I've come up with a very simple trick to gain access to the list. Any time a new memory block is allocated, it happens to be placed at the beginning of the linked-list. So, to get a pointer to the head of the list, I just allocate a temporary memory block. That block's address can be converted to the address of the containing _CrtMemBlockHeader structure and now I have a pointer to the beginning of the linked list.
In the following code, pSymSetOptions, pSymInitialize, pSymGetLineFromAddr64, and pSymFromAddrare all pointers to the functions exported by dbghelp.dll. The report function is just a custom wrapper aroundOutputDebugString which sends messages to the debugger for display in the debugger's output window.
This function is quite long. To cut down on clutter, I've removed all of the uninteresting and trivial parts. To see this function in its entirety, please download the source ZIP file.
// reportleaks - Generates a memory leak report when the program terminates if
//   leaks were detected. The report is displayed in the debug output window.
//
//  Return Value:
//
//    None.
//
void VisualLeakDetector::reportleaks ()
{...// Initialize the symbol handler. We use it for obtaining source file/line
    // number information and function names for the memory leak report.
    symbolpath = buildsymbolsearchpath();pSymSetOptions(SYMOPT_LOAD_LINES | SYMOPT_DEFERRED_LOADS | SYMOPT_UNDNAME);if (!pSymInitialize(m_process, symbolpath, TRUE)) {report("WARNING: Visual Leak Detector: The symbol handler" " failed to initialize (error=%lu).\n""    Stack traces will probably not be available" " for leaked blocks.\n", GetLastError());}...#ifdef _MT_mlock(_HEAP_LOCK);
#endif // _MT
    pheap = new char;pheader = pHdr(pheap)->pBlockHeaderNext;delete pheap;while (pheader) {...callstack = m_mallocmap->find(pheader->lRequest);if (callstack) {...// Iterate through each frame in the call stack.
            for (frame = 0; frame < callstack->size(); frame++) {// Try to get the source file and line number associated with
                // this program counter address.
                if (pSymGetLineFromAddr64(m_process, (*callstack)[frame], &displacement, &sourceinfo)) {...}// Try to get the name of the function containing this program
                // counter address.
                if (pSymFromAddr(m_process, (*callstack)[frame], &displacement64, pfunctioninfo)) {functionname = pfunctioninfo->Name;}else {functionname = "(Function name unavailable)";}...}...}pheader = pheader->pBlockHeaderNext;}
#ifdef _MT_munlock(_HEAP_LOCK);
#endif // _MT
...}
Known Bugs and Restrictions
There are currently no known bugs in the latest release, but there are some known restrictions:
- VLD does not detect COM leaks, out-of-process resource leaks, or any other types of memory leaks that are not associated with the CRT heap. In simpler terms, VLD only detects memory leaks that are the result of calls to
newormalloc. Keep in mind that VLD was created as an alternative to the built-in memory leak detector, which also only detects leaks fromnewandmalloc. - VLD is not compatible with version 6.5 of the Debug Help Library (dbghelp.dll). The recommended version of dbghelp.dll to use with VLD is 6.3. Version 6.3 is included in the VLD distribution.
- The pre-compiled libraries included in the VLD distribution may not be compatible with Visual Studio 2005. If you need to use VLD with Visual Studio 2005, building VLD from source in Visual Studio 2005 should create compatible libraries.
Credits
- Thanks to Alexandre Nikolov for quickly discovering the bug in 0.9e and helping to slap together a quick fix.
- Credit for the idea of how to make VLD's global class
VisualLeakDetectorobject get constructed before any other user global objects goes to cmk. Thanks cmk! - Thanks to Nitrogenycs (aka Matthias) for discovering the
VLD_MAX_DATA_DUMPinfinite loop bug. - Thanks to hsvcs (aka Holger) for discovering the
VLD_MAX_DATA_DUMPcompilation bug. - Thanks to Don Clugston for pointing out to me that people sometimes do build optimized debug executables, and that I need to watch out for that.
References
Here are some links to useful related articles and resources:
_CrtSetAllocHookfrom the MSDN Library.StackWalk64from the MSDN Library.- Using the Symbol Handler, from the MSDN Library.
- IA-32 Intel Architecture Software Developer's Manual - Volume 1. Section 3.5 explains the
EIPregister and how software can and cannot interact with it.
License
Visual Leak Detector is distributed under the terms of the GNU Lesser General Public License. See the documentation included in the downloadable ZIP files for detailed licensing information.