一、LGBM 模型结果 图形展示:
1、模型训练
train_x = train[feas_x]
train_y= train['target'].astype(int).copy()
test_x, test_y = test[feas_x], test['target']
lgb_clf = lgb.LGBMClassifier(objective='binary',metric='auc',num_leaves=20,max_depth=2,learning_rate=0.06,seed=27,
colsample_bytree=0.7,subsample=0.7,n_estimators=500)
lgb_model = lgb_clf.fit(train_x, train_y, eval_set=[(test_x, test_y)], early_stopping_rounds=200)
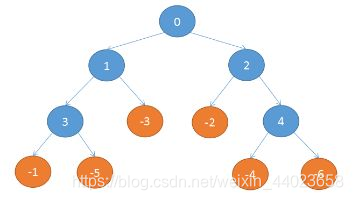
2、打印树让其用以下图片方式展示

画图方法一:
使用 Graphvizjar画图
2.1 下载 Graphvizjar
该网址(Download | Graphviz )下载自己需要的Graphvizjar 版本 ,本示例用的是 graphviz-3.0.0(64.bit)
2.2 安装 graphviz
2.3、环境变量 path 配置D:\Graphviz\bin
2.4 调用graphviz (D:\\Graphviz\\ 为Graphviz 安装路径)
import os
os.environ["PATH"] += os.pathsep + 'D:\\Graphviz\\bin\\'
2.5 用graphviz 画图,tree_index 为打印第几棵树
lgb.create_tree_digraph(lgb_model, tree_index=8,show_info=['split_gain','leaf_count',])
其中 show_info 参数 可参考:lightgbm.create_tree_digraph — LightGBM 3.3.2.99 documentation
画图方法二:
方法二,没有方法一画图清晰
import matplotlib.pyplot as plt
fig2 = plt.figure(figsize=(20, 20))
ax = fig2.subplots()
lgb.plot_tree(lgb_model, tree_index=0, ax=ax,show_info=['split_gain','leaf_count'])
plt.show()
![[机器学习] 模型融合GBDT(xgb/lgbm/rf)+LR 的原理及实践](https://img-blog.csdn.net/201810091707037?watermark/2/text/aHR0cHM6Ly9ibG9nLmNzZG4ubmV0L2Fuc2h1YWlfYXcx/font/5a6L5L2T/fontsize/400/fill/I0JBQkFCMA==/dissolve/70)


![[C++] OpenCasCade空间几何库的模型展现](https://img-blog.csdnimg.cn/20190104124903515.png?x-oss-process=image/watermark,type_ZmFuZ3poZW5naGVpdGk,shadow_10,text_aHR0cHM6Ly9ibG9nLmNzZG4ubmV0L20wXzM4MTI1Mjc4,size_16,color_FFFFFF,t_70)