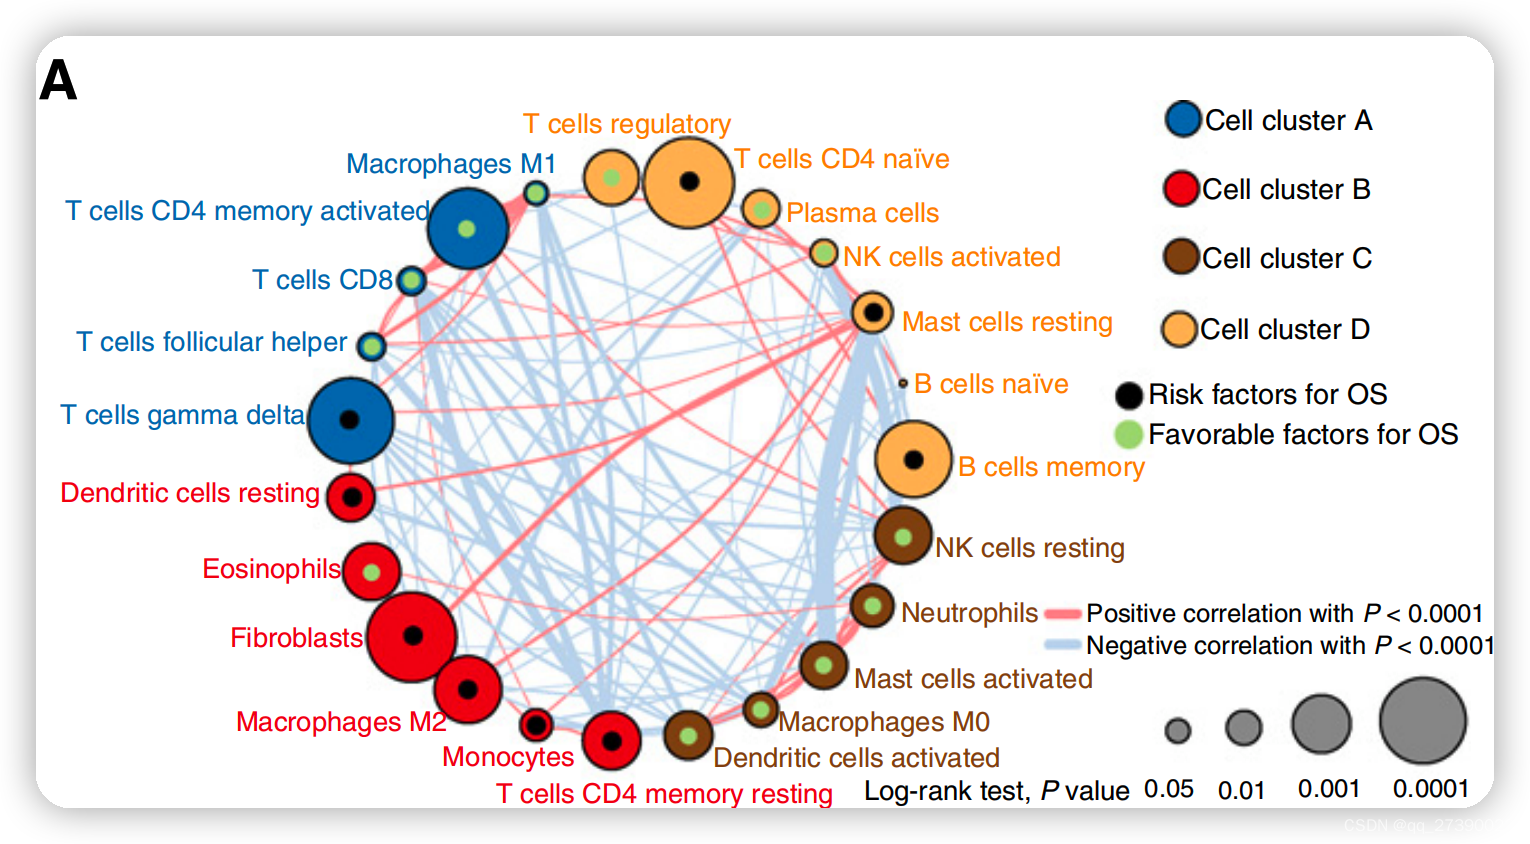
ggraph 是 ggplot2 的扩展,用于绘制关系型数据结构,如网络、图和树等。
ggraph 包含 3 个核心概念:
layout:定义图的布局,如蜂巢图、圆堆积图等
nodes:定义节点图形属性,使用 geom_node_*() 函数来控制
edges:定义边的图形属性,使用 geom_edge_*() 函数来控制
R 代码
# install.packages('ggraph')
# install.packages('tidygraph')library(ggraph)
library(tidygraph)# help(package=ggraph)
###1. 读入数据m_data <- read.csv("/test/test.csv")
colnames(m_data) # [1] "from" "to" "Spearman_R" "P_value" "weight"#节点数据
nodes <- data.frame(name = unique(union(m_data$from, m_data$to)))
nodes$survival_impact <- runif(23,0.0001,0.05)
nodes$cluster <- c(rep("cluster A",5),rep("cluster B",10),rep("cluster c",8))
nodes$role_type <- c(rep("Risk factors for OS",10),rep("Favorable factors for OS",13))
#边数据
edges <- m_data[c("from","to","Spearman_R")]
edges$class <- ifelse(edges$Spearman_R>0, "Positive correlation with P < 0.0001", "Negative correlation with P < 0.0001")
g <- tbl_graph(nodes = nodes, edges = edges)
class(g) #[1] "tbl_graph" "igraph" ###2. 绘制图形
# 自定义颜色映射
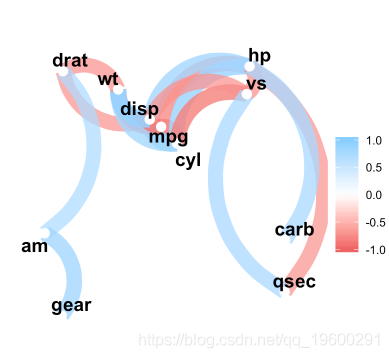
colors <- colorRampPalette(c("red", "orange", "blue"),space = "rgb")(3)ggraph(g,layout='linear',circular = TRUE) +
#ggraph(g,layout='linear',circular = FALSE) +
#ggraph(g,layout='circle') +geom_node_point(aes(size=survival_impact,colour = cluster),alpha = 0.5) +geom_node_text(aes(x = x*1.06, y=y*1.06, label=name,color=cluster),angle=0,hjust=0, fontface="bold",size=3,family="Times") + # 设置点的注释scale_size_continuous(range = c(20, 1)) + #设置点大小范围,可以设置值越小,点越大geom_node_point(size = 2,aes(colour = role_type))+scale_color_manual(values = c(colors,"green","black")) +#geom_edge_link(aes(colour = class,width=abs(Spearman_R)),alpha = 0.5) +#geom_edge_arc(alpha = 0.5) + #设置链接线为曲线, # geom_edge_link(mapping = aes(edge_width = abs(Spearman_R), # edge_color = class), # #arrow = arrow(length = unit(4, "mm")),# #start_cap = circle(3, "mm"), # #end_cap = circle(3, "mm"),# alpha = 0.5) + geom_edge_bend(mapping = aes(edge_width = abs(Spearman_R), edge_color = class), strength = 0.02,alpha = 0.5) +scale_edge_colour_manual(values = c("lightblue","pink")) +scale_edge_width_continuous(range = c(0.5,5)) +theme_graph()#theme(legend.position="bottom") ##注:ggplot2关于点大小,形状,颜色的映射
## 离散数据:scale_colour_manual,scale_fill_manual,scale_size_manual等
## 连续数据:scale_size,scale_radius,scale_size_continuous,scale_colour_continuous,
# scale_colour_gradient,scale_fill_gradient等参考
https://www.e-learn.cn/tag/ggraph