1、HTML 页面
## index.html<!DOCTYPE html>
<html lang="en">
<head><meta charset="UTF-8"><meta name="viewport" content="width=device-width, initial-scale=1.0"><title>第六讲-绘制图形</title><link rel="stylesheet" href="http://localhost/arcgis_js_api/4.15/esri/css/main.css"><link rel="stylesheet" href="css/index.css"><script src="http://localhost/arcgis_js_api/4.15/init.js"></script><script src="js/index.js"></script>
</head><body><div id="viewDiv"><div class="toolbar"><button id="drawPoint" class="tool-btn1">绘制点</button><button id="drawPolygon" class="tool-btn2">绘制面</button><button id="clearDrawings" class="tool-btn3">清除绘制</button></div></div>
</body>
</html>
2、样式设置
## index.csshtml,
body {height: 100%;width: 100%;padding: 0;margin: 0;
}#viewDiv {height: 100%;width: 100%;
}.tool-btn1 {position: absolute;top: 20px;right: 150px;
}.tool-btn2 {position: absolute;top: 20px;right: 90px;
}.tool-btn3 {position: absolute;top: 20px;right: 15px;
}
3、Javascript API 实现地图绘制
## index.jsrequire(["esri/Map","esri/views/MapView","esri/Graphic","esri/layers/GraphicsLayer","esri/views/draw/Draw","esri/geometry/Polygon","esri/geometry/Point"
], function(Map, MapView, Graphic, GraphicsLayer, Draw, Polygon, Point) {var map = new Map({basemap: "satellite"});var view = new MapView({container: "viewDiv",map: map});var graphicsLayer = new GraphicsLayer();map.add(graphicsLayer);var fillSymbol = {type: "simple-fill",color: "yellow",outline: {color: "red",width: 2}};var pointSymbol = {type: "simple-marker",style: "circle",size: 12,color: "blue"}var drawTool = new Draw({view: view});function showPolygon(event) {var polygon = new Polygon({rings: event.vertices,spatialReference: view.spatialReference});var polygonGraphic = new Graphic({geometry: polygon,symbol: fillSymbol});view.graphics.removeAll();view.graphics.add(polygonGraphic);}function addPolygonGraphic(event) {var polygon = new Polygon({rings: event.vertices,spatialReference: view.spatialReference});var polygonGraphic = new Graphic({geometry: polygon,symbol: fillSymbol});view.graphics.removeAll();graphicsLayer.add(polygonGraphic);}document.getElementById("drawPolygon").addEventListener("click", function(e) {var drawAction = drawTool.create("polygon", { mode: "click" });drawAction.on("vertex-add", showPolygon);drawAction.on("vertex-remove", showPolygon);drawAction.on("cursor-update", showPolygon);drawAction.on("draw-complete", addPolygonGraphic);});document.getElementById("drawPoint").addEventListener("click", function(e) {var drawAction = drawTool.create("point");drawAction.on("draw-complete", addPointGraphic);});function addPointGraphic(event) {var point = new Point({x: event.coordinates[0],y: event.coordinates[1],spatialReference: view.spatialReference});var pointGraphic = new Graphic({geometry: point,symbol: pointSymbol});graphicsLayer.add(pointGraphic);}document.getElementById("clearDrawings").addEventListener("click", function(e) {graphicsLayer.removeAll();})
});
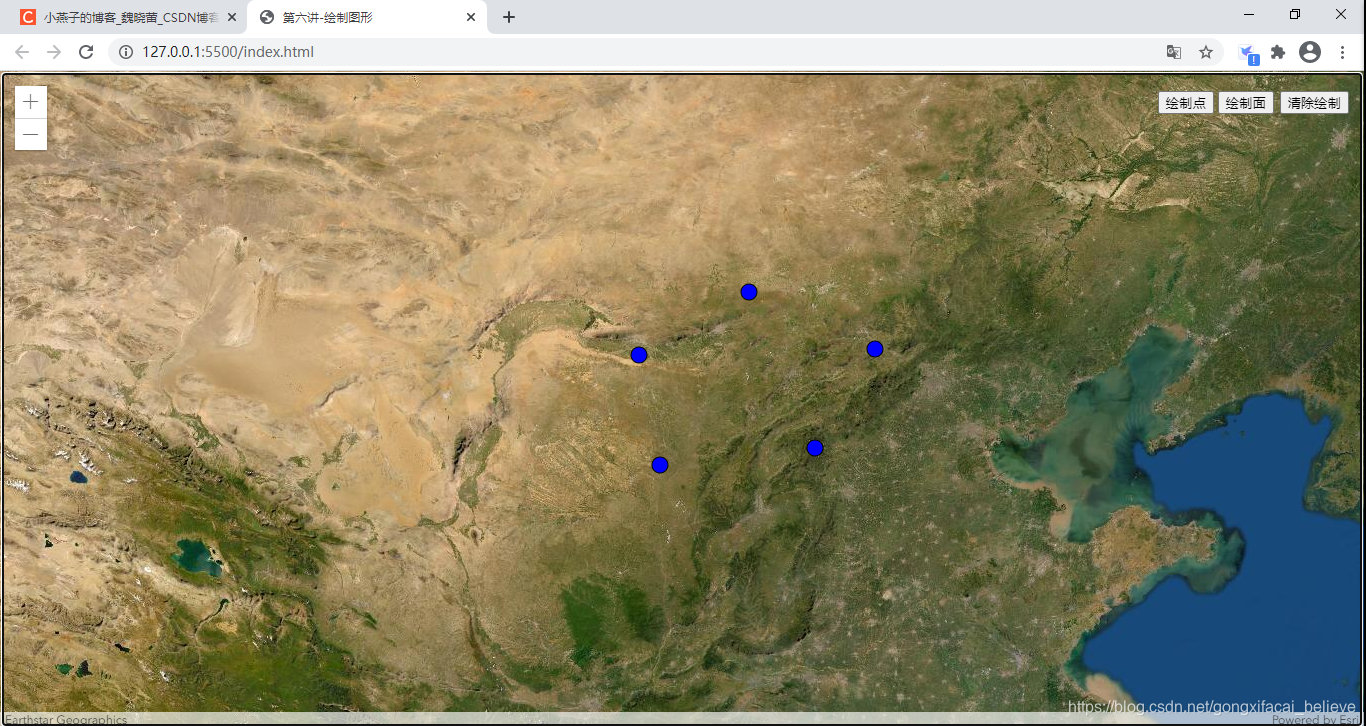
4、实现效果
绘制点
绘制面