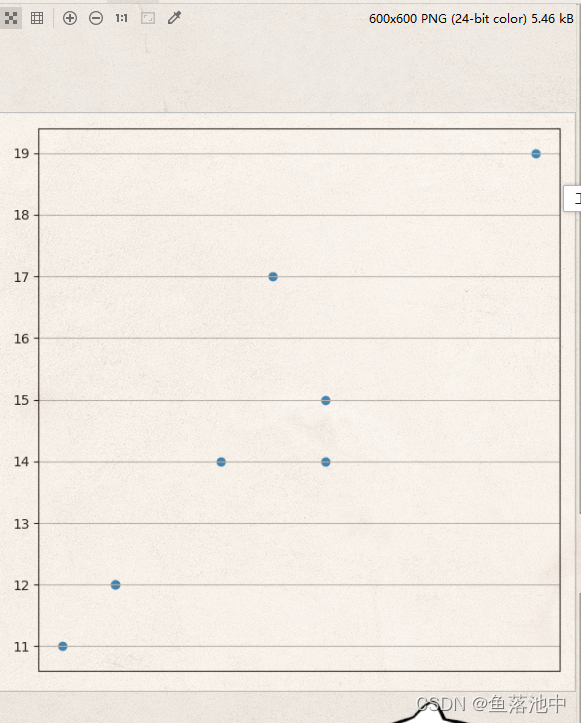
1. 隐藏x坐标轴
import matplotlib.pyplot as pltx = [3, 4, 4, 6, 7, 8, 8, 12]
y = [11, 12, 12, 14, 17, 15, 14, 19]fig, ax = plt.subplots(figsize=(6, 6), dpi=100)ax.scatter(x, y)
ax.grid(True)
ax.get_xaxis().set_visible(False)
fig.show()
2. 隐藏y坐标轴
import matplotlib.pyplot as pltx = [3, 4, 4, 6, 7, 8, 8, 12]
y = [11, 12, 12, 14, 17, 15, 14, 19]fig, ax = plt.subplots(figsize=(6, 6), dpi=100)ax.scatter(x, y)
ax.grid(True)
ax.get_yaxis().set_visible(False)
fig.show()

3. 隐藏xy和边框
import matplotlib.pyplot as pltx = [3, 4, 4, 6, 7, 8, 8, 12]
y = [11, 12, 12, 14, 17, 15, 14, 19]fig, ax = plt.subplots(figsize=(6, 6), dpi=100)ax.scatter(x, y)
ax.grid(True)
ax.axis("off")
fig.show()