1 Sysbench
安装
requirements
yum -y install make automake libtool pkgconfig libaio-devel# For MySQL support, replace with mysql-devel on RHEL/CentOS 5yum -y install mariadb-devel openssl-devel mysql-devel# For PostgreSQL supportyum -y install postgresql-devel
compile
wget https://github.com/akopytov/sysbench/archive/1.0.16.tar.gz
./autogen.sh
# Add --with-pgsql to build with PostgreSQL support
./configure --with-pgsql --prefix=/home/mingjie.gmj/bin/sysbench-1.0.16
make -sj64
make install
run
$ sysbench --version
sysbench 1.0.16
参数
$ sysbench --help
Usage:sysbench [options]... [testname] [command]
-
command
command是sysbench要执行的命令,包括prepare、run和cleanup,顾名思义,prepare是为测试提前准备数据,run是执行正式的测试,cleanup是在测试完成后对数据库进行清理。
-
testname
testname指定了要进行的测试,在老版本的sysbench中,可以通过–test参数指定测试的脚本;而在新版本中,–test参数已经声明为废弃,可以不使用–test,而是直接指定脚本。
# 等价
sysbench --test=./tests/include/oltp_legacy/oltp.lua
sysbench ./tests/include/oltp_legacy/oltp.lua
测试时使用的脚本为lua脚本,可以使用sysbench自带脚本,也可以自己开发。对于大多数应用,使用sysbench自带的脚本就足够了。不同版本的sysbench中,lua脚本的位置可能不同,可以自己在sysbench路径下使用find命令搜索oltp.lua。
-
options
sysbench的参数有很多,其中比较常用的包括:
MySQL连接信息参数
- –mysql-host:MySQL服务器主机名,默认localhost;如果在本机上使用localhost报错,提示无法连接MySQL服务器,改成本机的IP地址应该就可以了。
- –mysql-port:MySQL服务器端口,默认3306
- –mysql-user:用户名
- –mysql-password:密码
MySQL执行参数
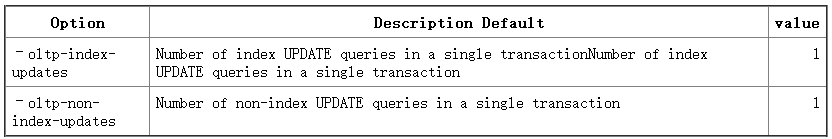
- –oltp-test-mode:执行模式,包括simple、nontrx和complex,默认是complex。simple模式下只测试简单的查询;nontrx不仅测试查询,还测试插入更新等,但是不使用事务;complex模式下测试最全面,会测试增删改查,而且会使用事务。可以根据自己的需要选择测试模式。
- –oltp-tables-count:测试的表数量,根据实际情况选择
- –oltp-table-size:测试的表的大小,根据实际情况选择
- –threads:客户端的并发连接数
- –time:测试执行的时间,单位是秒,该值不要太短,可以选择120
- –report-interval:生成报告的时间间隔,单位是秒,如10
测试
CPU基准测试
$ cat /proc/cpuinfo
processor	: 63
vendor_id	: GenuineIntel
cpu family	: 6
model		: 79
model name	: Intel(R) Xeon(R) CPU E5-2682 v4 @ 2.50GHz
stepping	: 1
cpu MHz		: 2494.479
cache size	: 40960 KB$ sysbench cpu --cpu-max-prime=20000 run
sysbench 1.0.16 (using bundled LuaJIT 2.1.0-beta2)Running the test with following options:
Number of threads: 1
Initializing random number generator from current timePrime numbers limit: 20000Initializing worker threads...Threads started!CPU speed:events per second:   320.33General statistics:total time:                          10.0032stotal number of events:              3205Latency (ms):min:                                    3.11avg:                                    3.12max:                                    3.9495th percentile:                        3.13sum:                                10001.38Threads fairness:events (avg/stddev):           3205.0000/0.00execution time (avg/stddev):   10.0014/0.00
IO基准测试
测试混合随机读写:rndrw
顺序写入:seqwr
顺序重写:seqrewr
顺序读取:seqrd
随机读取:rndrd
随机写入:rndwr
混合随机读写:rndnrw
Disk1:SSD
#smartctl --all /dev/sda...
User Capacity:    340,076,814,336 bytes [340 GB]
Sector Sizes:     512 bytes logical, 4096 bytes physical
...
50G数据测试
$ sysbench --test=fileio --file-total-size=50G prepare
$ sysbench --test=fileio --file-total-size=50G --file-test-mode=rndrw --time=300 --events=0 runWARNING: the --test option is deprecated. You can pass a script name or path on the command line without any options.
sysbench 1.0.16 (using bundled LuaJIT 2.1.0-beta2)Running the test with following options:
Number of threads: 1
Initializing random number generator from current timeExtra file open flags: (none)
128 files, 400MiB each
50GiB total file size
Block size 16KiB
Number of IO requests: 0
Read/Write ratio for combined random IO test: 1.50
Periodic FSYNC enabled, calling fsync() each 100 requests.
Calling fsync() at the end of test, Enabled.
Using synchronous I/O mode
Doing random r/w test
Initializing worker threads...Threads started!File operations:reads/s:                      6531.22writes/s:                     4354.15fsyncs/s:                     13933.44Throughput:read, MiB/s:                  102.05written, MiB/s:               68.03General statistics:total time:                          300.0059stotal number of events:              7445716Latency (ms):min:                                    0.00avg:                                    0.04max:                                    8.5695th percentile:                        0.06sum:                               297668.65Threads fairness:events (avg/stddev):           7445716.0000/0.00execution time (avg/stddev):   297.6686/0.00$ sysbench fileio --file-total-size=50G cleanup
Disk2:HDD
#smartctl --all /dev/sdb...
User Capacity:    8,001,563,222,016 bytes [8.00 TB]
Sector Sizes:     512 bytes logical, 4096 bytes physical
Rotation Rate:    7200 rpm
...
50G数据测试
$ sysbench --test=fileio --file-total-size=50G prepare
$ sysbench --test=fileio --file-total-size=50G --file-test-mode=rndrw --time=300 --events=0 run
WARNING: the --test option is deprecated. You can pass a script name or path on the command line without any options.
sysbench 1.0.16 (using bundled LuaJIT 2.1.0-beta2)Running the test with following options:
Number of threads: 1
Initializing random number generator from current timeExtra file open flags: (none)
128 files, 400MiB each
50GiB total file size
Block size 16KiB
Number of IO requests: 0
Read/Write ratio for combined random IO test: 1.50
Periodic FSYNC enabled, calling fsync() each 100 requests.
Calling fsync() at the end of test, Enabled.
Using synchronous I/O mode
Doing random r/w test
Initializing worker threads...Threads started!File operations:reads/s:                      600.53writes/s:                     400.36fsyncs/s:                     1281.15Throughput:read, MiB/s:                  9.38written, MiB/s:               6.26General statistics:total time:                          300.0311stotal number of events:              684559Latency (ms):min:                                    0.00avg:                                    0.44max:                                  543.7895th percentile:                        0.01sum:                               299828.29Threads fairness:events (avg/stddev):           684559.0000/0.00execution time (avg/stddev):   299.8283/0.00
SSD和HDD的对比
| 型号 | R/W Throughput(MiB/s) | total time(50G) | Total numer of events |
|---|---|---|---|
| INTEL SSDSCKHB340G4 | 102.05 / 68.03 | 300.0059s | 7445716 |
| ST8000NM0055-1RM112 | 9.38 / 6.26 | 300.0311s | 684559 |
OLTP基准测试方法
mysql参数(HDD硬盘64核CPU)
[mysqld]
innodb_buffer_pool_size = 128M
basedir = /home/mingjie.gmj/databases/mysql5400
datadir = /home/mingjie.gmj/databases/data/mydata5400
port = 5400
server_id = 06700000
socket = /home/mingjie.gmj/databases/data/mydata5400/mysql5400.sock
join_buffer_size = 128M
sort_buffer_size = 2M
read_rnd_buffer_size = 2M
log_bin = mysql-bin
准备数据(默认使用数据库sbtest)
sysbench oltp_common --threads=64 --events=0 --mysql-socket=/home/mingjie.gmj/databases/data/mydata5400/mysql5400.sock --mysql-user=jackgo --mysql-password=333 --tables=10 --table_size=1000000 prepare64线程10分钟
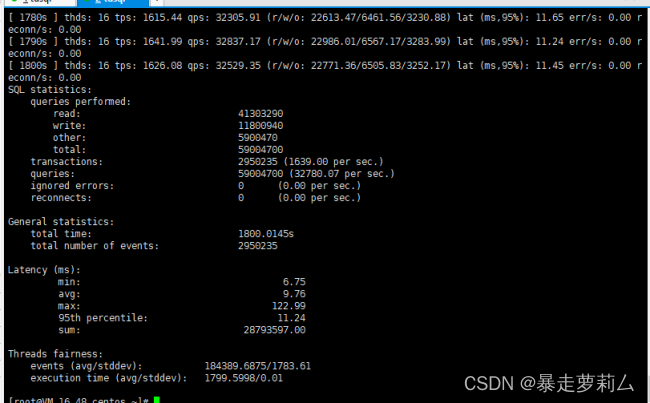
sysbench oltp_read_write --threads=64 --events=0 --mysql-socket=/home/mingjie.gmj/databases/data/mydata5400/mysql5400.sock --mysql-user=jackgo --mysql-password=333 --mysql-db=sbtest --tables=10 --table_size=1000000 --time=600 --report-interval=1 run > ./64.logSQL statistics:queries performed:read: 2004898write: 572828other: 286414total: 2864140transactions: 143207 (238.55 per sec.)queries: 2864140 (4770.94 per sec.)ignored errors: 0 (0.00 per sec.)reconnects: 0 (0.00 per sec.)General statistics:total time: 600.3291stotal number of events: 143207Latency (ms):min: 4.49avg: 268.20max: 3120.5195th percentile: 846.57sum: 38407832.31Threads fairness:events (avg/stddev): 2237.6094/25.40execution time (avg/stddev): 600.1224/0.03128线程10分钟
sysbench oltp_read_write --threads=128 --events=0 --mysql-socket=/home/mingjie.gmj/databases/data/mydata5400/mysql5400.sock --mysql-user=jackgo --mysql-password=333 --mysql-db=sbtest --tables=10 --table_size=1000000 --time=600 --report-interval=1 run > ./128.log
SQL statistics:queries performed:read:                            2998604write:                           856744other:                           428372total:                           4283720transactions:                        214186 (356.69 per sec.)queries:                             4283720 (7133.88 per sec.)ignored errors:                      0      (0.00 per sec.)reconnects:                          0      (0.00 per sec.)General statistics:total time:                          600.4736stotal number of events:              214186Latency (ms):min:                                    6.18avg:                                  358.83max:                                 3474.2395th percentile:                     1149.76sum:                             76856235.74Threads fairness:events (avg/stddev):           1673.3281/20.67execution time (avg/stddev):   600.4393/0.05
256线程10分钟
sysbench oltp_read_write --threads=256 --events=0 --mysql-socket=/home/mingjie.gmj/databases/data/mydata5400/mysql5400.sock --mysql-user=jackgo --mysql-password=333 --mysql-db=sbtest --tables=10 --table_size=1000000 --time=600 --report-interval=1 run > ./256.log
SQL statistics:queries performed:read:                            3312344write:                           946384other:                           473192total:                           4731920transactions:                        236596 (393.76 per sec.)queries:                             4731920 (7875.11 per sec.)ignored errors:                      0      (0.00 per sec.)reconnects:                          0      (0.00 per sec.)General statistics:total time:                          600.8682s...skipping one lineLatency (ms):min:                                    5.96avg:                                  649.49max:                                 6085.7795th percentile:                     1903.57sum:                            153665561.59Threads fairness:events (avg/stddev):           924.2031/13.66execution time (avg/stddev):   600.2561/0.22
512线程10分钟
sysbench oltp_read_write --threads=512 --events=0 --mysql-socket=/home/mingjie.gmj/databases/data/mydata5400/mysql5400.sock --mysql-user=jackgo --mysql-password=333 --mysql-db=sbtest --tables=10 --table_size=1000000 --time=600 --report-interval=1 run > ./512.log
SQL statistics:queries performed:read:                            2910740write:                           831640other:                           415820total:                           4158200transactions:                        207910 (345.89 per sec.)queries:                             4158200 (6917.72 per sec.)ignored errors:                      0      (0.00 per sec.)reconnects:                          0      (0.00 per sec.)General statistics:total time:                          601.0922stotal number of events:              207910Latency (ms):min:                                    8.11avg:                                 1478.86max:                                20588.4995th percentile:                     3326.55sum:                            307470559.14Threads fairness:events (avg/stddev):           406.0742/27.49execution time (avg/stddev):   600.5284/0.28
cleanup
sysbench oltp_common --threads=64 --events=0 --mysql-socket=/home/mingjie.gmj/databases/data/mydata5400/mysql5400.sock --mysql-user=jackgo --mysql-password=333 --tables=10 --table_size=1000000 cleanup结合Gunplot输出结果图
安装
https://cfhcable.dl.sourceforge.net/project/gnuplot/gnuplot/5.2.6/gnuplot-5.2.6.tar.gz
./configure --prefix=/home/mingjie.gmj/bin/gunplot/
make -sj64
make install
技巧
set datafile separator <string> 指定自己的分隔符
set datafile commentschar 指定除了 # 之外的注释字符
使用
set grid
set xlabel "collection time"
set xrange[0:600]
set ylabel "qps"
set yrange[0:35000]
plot "64.log" using 2:9 with line linecolor 1 linewidth 1 title "64 threads",\
"128.log" using 2:9 with line linecolor 2 linewidth 1 title "128 threads",\
"256.log" using 2:9 with line linecolor 5 linewidth 1 title "256 threads",\
"512.log" using 2:9 with linespoints linecolor 4 linewidth 1 pointtype 7 pointsize 1 title "512 threads"set grid
set xlabel "collection time"
set xrange[0:600]
set ylabel "qps"
set yrange[0:35000]
plot "64.log" using 2:9 w l lc 1 lw 1 title "64 threads",\
"128.log" using 2:9 w l lc 2 lw 1 title "128 threads",\
"256.log" using 2:9 w l lc 5 lw 1 title "256 threads",\
"512.log" using 2:9 w lp lc 7 lw 1 pt 1 ps 1 title "512 threads"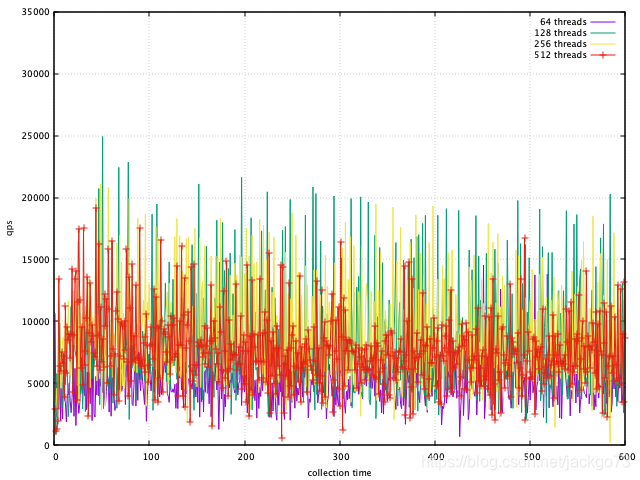
曲线平滑
拟合
https://blog.csdn.net/liyuanbhu/article/details/7574193?utm_source=blogkpcl12
set grid
set xlabel "collection time"
set xrange[0:600]
set ylabel "qps"
set yrange[0:35000]
plot "64.log" using 2:9 w l lc 1 lw 1 title "64 threads" smooth acsplines,\
"128.log" using 2:9 w l lc 2 lw 1 title "128 threads" smooth acsplines,\
"256.log" using 2:9 w l lc 5 lw 1 title "256 threads" smooth acsplines,\
"512.log" using 2:9 w lp lc 7 lw 1 pt 1 ps 1 title "512 threads" smooth acsplinesset grid
set xlabel "collection time"
set xrange[0:600]
set ylabel "qps"
set yrange[0:35000]
plot "64.log" using 2:9 w l lc 1 lw 1 title "64 threads" smooth sbezier,\
"128.log" using 2:9 w l lc 2 lw 1 title "128 threads" smooth sbezier,\
"256.log" using 2:9 w l lc 5 lw 1 title "256 threads" smooth sbezier,\
"512.log" using 2:9 w lp lc 7 lw 1 pt 1 ps 1 title "512 threads" smooth sbezier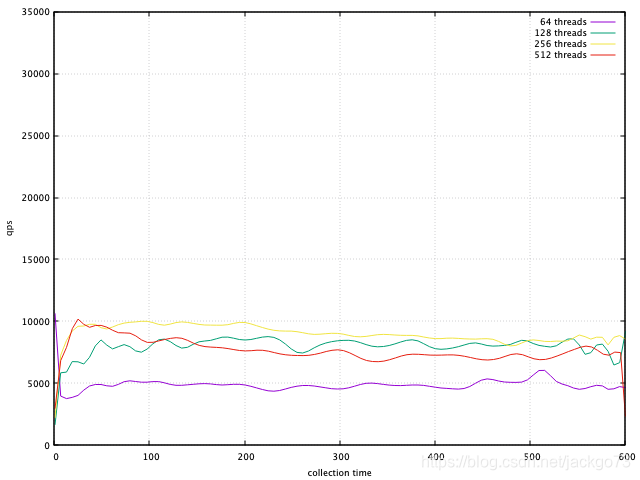
set grid
set xlabel "collection time"
set xrange[0:600]
set ylabel "qps"
plot "pgsql_p128_0.log" using 2:9 w l lc 1 lw 1 title "[0] threads" smooth sbezier,\
"pgsql_p128_1.log" using 2:9 w l lc 2 lw 1 title "[1] threads" smooth sbezier
2 测试指标
吞吐量
TPCC、TPCH,单位常用TPS
响应时间、延迟
包括平均响应时间、最小响应时间、最大响应时间、时间百分比等,其中时间百分比参考意义较大,如前95%的请求的最大响应时间
并发性
同时处理的查询请求的数量
可扩展性
placeholder
3 测试脚本
MYSQL测试数据收集脚本
mytest.sh
#!/bin/shINTERNAL=5
PREFIX=$INTERNAL-sec-status
RUNFILE=/tmp/bm_running
MYPREFIX='mysql -S /home/mingjie.gmj/databases/data/mydata5400/mysql5400.sock -uroot -e'
$MYPREFIX 'SHOW GLOBAL VARIABLES' >> mysql-variables
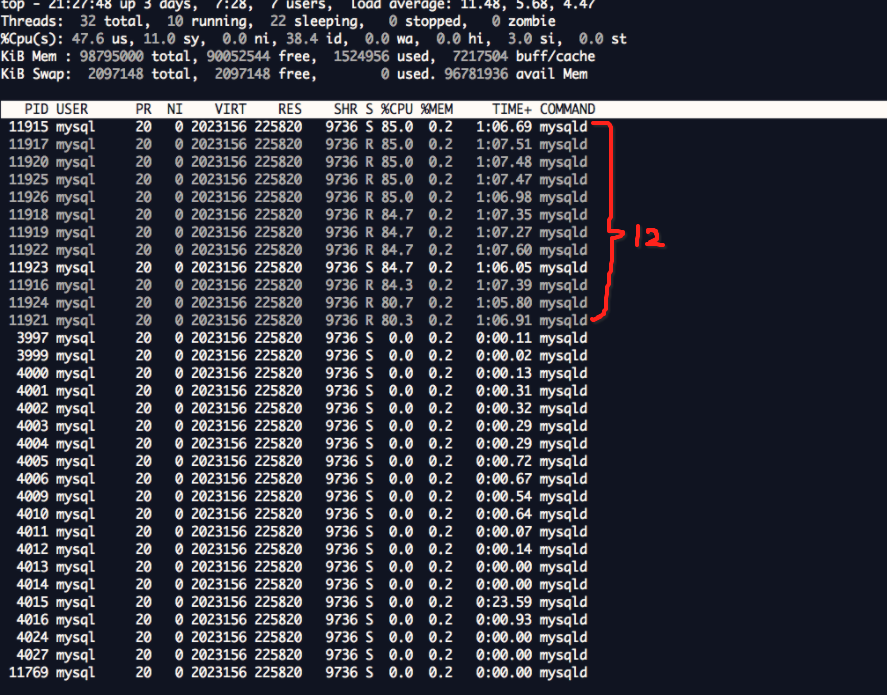
while test -e $RUNFILE; dofile=$(date +%F_%I)sleep $INTERNALts="$(date +"TS %s.%N %F %T")"loadavg="$(uptime)"echo "$ts $loadavg" >> $PREFIX-${file}-status$MYPREFIX 'SHOW GLOBAL STATUS' >> $PREFIX-${file}-status &echo "$ts $loadavg" >> $PREFIX-${file}-processlist$MYPREFIX 'SHOW FULL PROCESSLIST\G' >> $PREFIX-${file}-processlist &echo "$ts $loadavg" >> $PREFIX-${file}-innodbstatus$MYPREFIX 'SHOW ENGINE INNODB STATUS\G' >> $PREFIX-${file}-innodbstatus &echo $ts
done
echo Exiting because $RUNFILE does not exist.
4 常用命令
本地测试
sysbench oltp_common --mysql-socket=mysql.sock --mysql-port=5470 --mysql-user=root --mysql-db=benchdb --db-driver=mysql --tables=4 --table-size=1000000 --report-interval=1 --threads=4 prepare
常规灌数
sysbench oltp_common --mysql-host=xxx --mysql-port=90 --mysql-user=xxx --mysql-password=xxx --mysql-db=xxx --db-driver=mysql --tables=1 --table-size=100000000 --report-interval=1 --threads=32 prepare
insert写入测试
nohup sysbench oltp_insert run --mysql-host=xxx --mysql-port=90 --mysql-user=xxx --mysql-password=xxx --mysql-db=xxx --db-driver=mysql --auto_inc=off --rand-type=uniform --threads=128 --report-interval=1 --tables=32 --time=999999999 > tmp8 2>&1 &
批量写入测试
sysbench bulk_insert prepare --mysql-host=xxx --mysql-port=90 --mysql-user=xxx --mysql-password=xxx --mysql-db=xxx --db-driver=mysql --rand-type=uniform --threads=64sysbench bulk_insert run --mysql-host=xxx --mysql-port=90 --mysql-user=xxx --mysql-password=xxx --mysql-db=xxx --db-driver=mysql --rand-type=uniform --report-interval=1 --threads=64 --time=100000000


![[网络安全]dSploit-Android系统下的网络分析和渗透套件的使用](https://img-blog.csdn.net/20161113002006332)