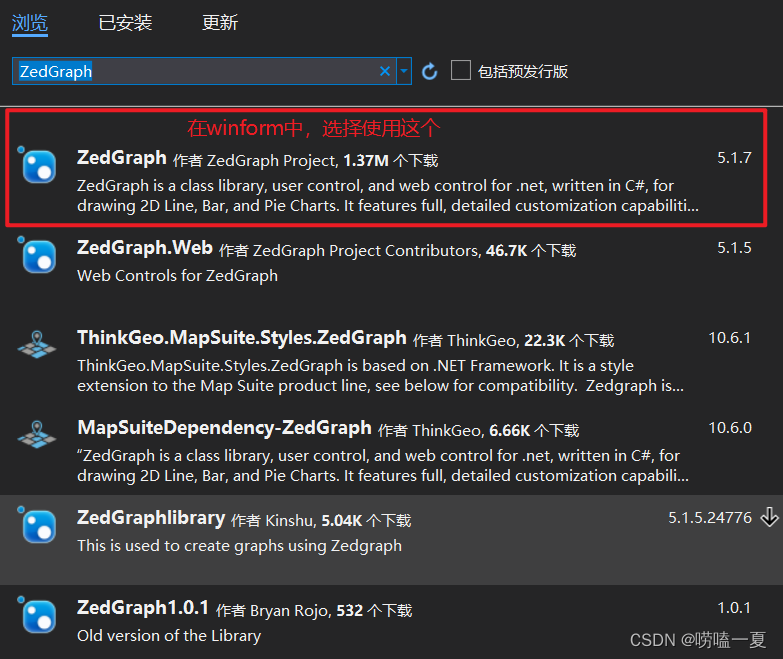
zedGraph是一个开源的曲线绘制插件,由于要制作上位机显示实时数据,百度搜索到了zedgraph,优点是开源,功能也够使用。
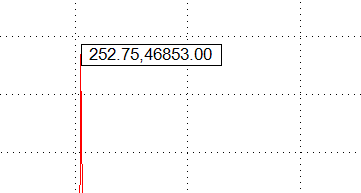
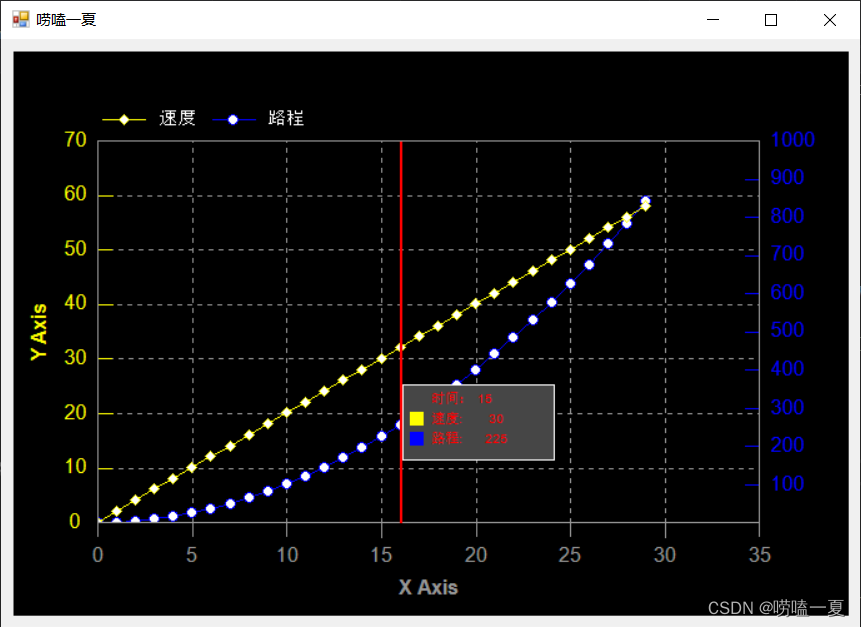
缺点是看网址08年后就没有更新过。尝试使用了一下,感觉还可以。 曲线绘制直接看下图。

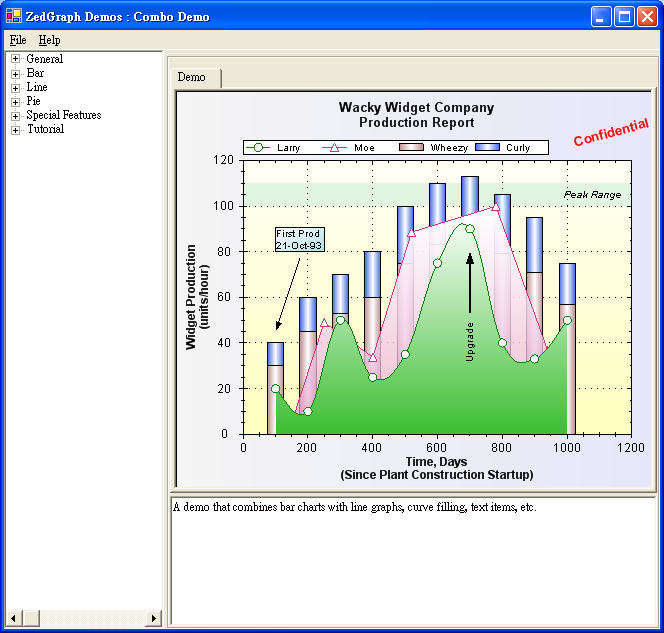
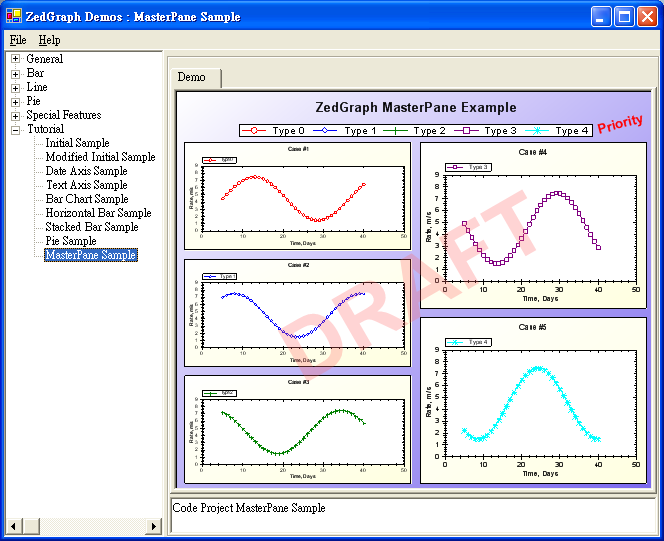
原理很简单。设置一个曲线属性,然后一直给曲线加点,就会在图上显示。网上也有很多历程。下面是一个生成两个图幅的例子
通过定时器更新曲线,在vs中使用c#实现,网上可以找到源代码。有很多类似的
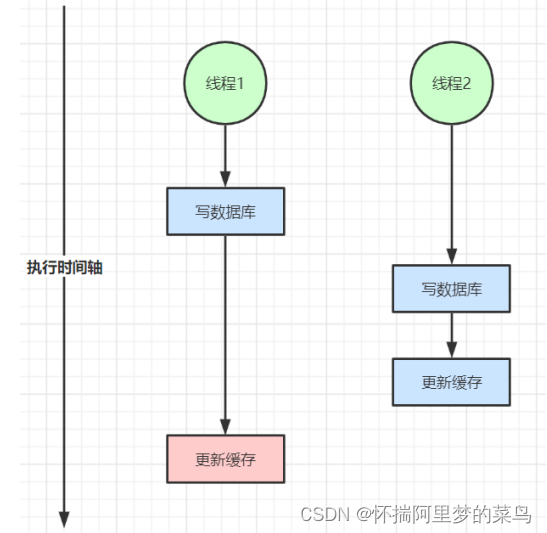
public partial class Form1 : Form{public Form1(){InitializeComponent();GraphIt();GraphIt2();}private void Form1_Load(object sender, EventArgs e){}LineItem myCurve1, myCurve2, myCurve3;private void GraphIt(){MasterPane master = z1.MasterPane;master.PaneList.Clear();// Display the MasterPane Title, and set the outer margin to 10 pointsmaster.Title.IsVisible = true;master.Title.Text = "实时显示";master.Margin.All = 5;// Create some GraphPane's (normally you would add some curves tooGraphPane pane1 = new GraphPane();GraphPane pane2 = new GraphPane();GraphPane pane3 = new GraphPane();// Add all the GraphPanes to the MasterPanemaster.Add(pane1);// master.Add(pane2);// master.Add(pane3);pane1.XAxis.Scale.MinorStep = pane2.XAxis.Scale.MinorStep = pane3.XAxis.Scale.MinorStep = 1;pane1.XAxis.Scale.MajorStep = pane2.XAxis.Scale.MajorStep = pane3.XAxis.Scale.MajorStep = 50;PointPairList dummylist = new PointPairList();myCurve1 = pane1.AddCurve("Angle X", dummylist, Color.Red);myCurve2 = pane2.AddCurve("Angle Y", dummylist, Color.Blue);// myCurve3 = pane3.AddCurve("Angle Z", dummylist, Color.Green);myCurve1.Line.Width = myCurve2.Line.Width = 5;// = myCurve3.Line.Width = 5;myCurve1.Symbol.Size = myCurve2.Symbol.Size = 0;// = myCurve3.Symbol.Size = 0;// Refigure the axis ranges for the GraphPanesz1.AxisChange();// Layout the GraphPanes using a default Pane Layoutusing (Graphics g = this.CreateGraphics()){master.SetLayout(g, PaneLayout.SquareRowPreferred);//优先排成一列}}Int32 Ntimer = 0;private void timer1_Tick(object sender, EventArgs e){Ntimer++;IPointListEdit list2_1 = myCurve1.Points as IPointListEdit;list2_1.Add(Ntimer, 2);IPointListEdit list2_2 = myCurve2_1.Points as IPointListEdit;list2_2.Add(Ntimer, 1);Scale xScale = z1.GraphPane.XAxis.Scale;if (Ntimer > xScale.Max - xScale.MajorStep){xScale.Max = Ntimer + xScale.MajorStep;xScale.Min = xScale.Max - 500.0;}xScale = z2.GraphPane.XAxis.Scale;if (Ntimer > xScale.Max - xScale.MajorStep){xScale.Max = Ntimer + xScale.MajorStep;xScale.Min = xScale.Max - 500.0;}z1.AxisChange();z1.Invalidate();z2.AxisChange();z2.Invalidate();}LineItem myCurve2_1, myCurve2_2, myCurve2_3;private void GraphIt2(){MasterPane master = z2.MasterPane;master.PaneList.Clear();// Display the MasterPane Title, and set the outer margin to 10 pointsmaster.Title.IsVisible = true;master.Title.Text = "实时显示";master.Margin.All = 5;// Create some GraphPane's (normally you would add some curves tooGraphPane pane1 = new GraphPane();GraphPane pane2 = new GraphPane();GraphPane pane3 = new GraphPane();// Add all the GraphPanes to the MasterPanemaster.Add(pane1);// master.Add(pane2);// master.Add(pane3);pane1.XAxis.Scale.MinorStep = pane2.XAxis.Scale.MinorStep = pane3.XAxis.Scale.MinorStep = 1;pane1.XAxis.Scale.MajorStep = pane2.XAxis.Scale.MajorStep = pane3.XAxis.Scale.MajorStep = 50;PointPairList dummylist = new PointPairList();myCurve2_1 = pane1.AddCurve("Angle X", dummylist, Color.Red);myCurve2_2 = pane2.AddCurve("Angle Y", dummylist, Color.Blue);// myCurve3 = pane3.AddCurve("Angle Z", dummylist, Color.Green);myCurve2_1.Line.Width = myCurve2_2.Line.Width = 5;// = myCurve3.Line.Width = 5;myCurve2_1.Symbol.Size = myCurve2_2.Symbol.Size = 0;// = myCurve3.Symbol.Size = 0;// Refigure the axis ranges for the GraphPanesz2.AxisChange();// Layout the GraphPanes using a default Pane Layoutusing (Graphics g = this.CreateGraphics()){master.SetLayout(g, PaneLayout.SquareRowPreferred);//优先排成一列}}}博主主要想说的是。当数据量大的时候,曲线更新快会导致界面卡死的现象。这是由于更新太耗时导致的。
作为一个小白,网上搜索了大量资料,最后发现解决方式有两个1、BackgroundWorker 异步更新
2、创建新的线程 单独去更新 就可以解决了。
博主最后使用了接收can报文 10ms周期, 每周期4个报文,运行半天,没有出现异常