最近做一个上位机的项目,要求实时显示温度曲线,开始用.net自带的 chart控做的,在动态显示那块,在删除一个数据点、加入一个新的数据点的时候,新的数据点显示不出来;纠结好久,解决不了这个问题。后来只好选择开源.net控件zedgraph。
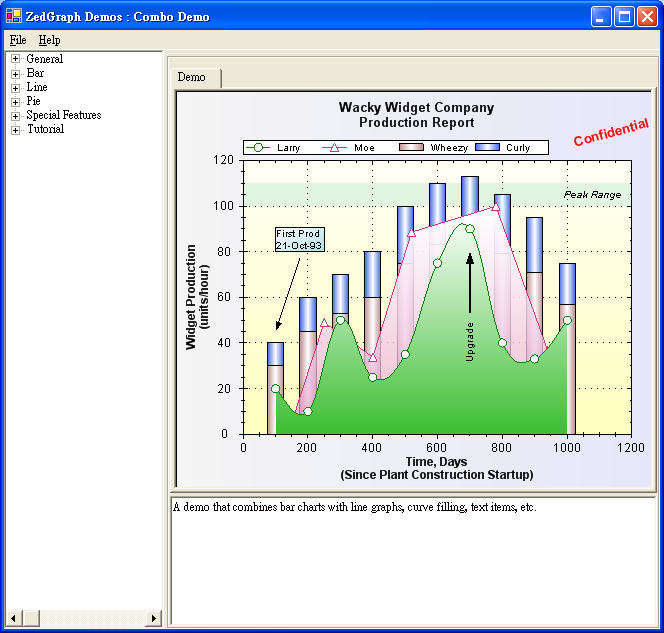
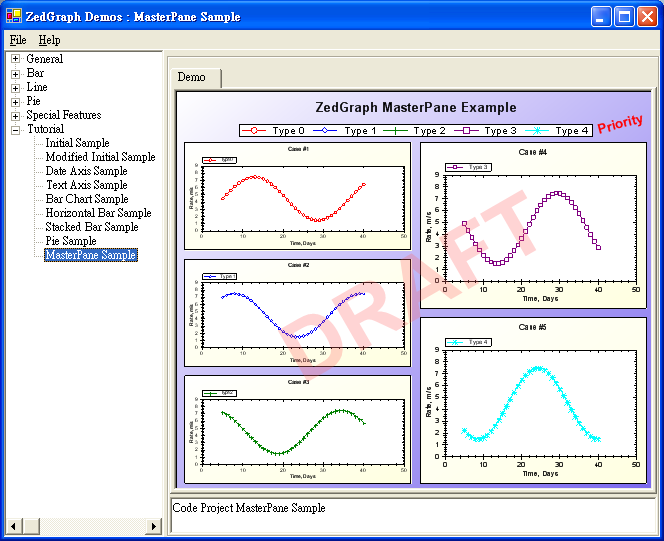
ZedGraph 是用于创建任意数据的二维线型、棒型、饼型图表的一个类库,也可以作为 Windows 窗体用户控件和 ASP 网页访问控件。这个类库具有高度的灵活性,几乎所有式样的图表都能够被创建。关于zedgraph控件的使用具体。参考官网介绍:http://www.codeproject.com/Articles/5431/A-flexible-charting-library-for-NET
在项目中遇到的问题总结如下:
一、曲线图基本参数设置:
//标题和x轴、y轴标签
this.zedGraphControl1.GraphPane.Title.Text = "实时曲线图";
this.zedGraphControl1.GraphPane.Title.FontSpec.FontColor = Color.Blue;
this.zedGraphControl1.GraphPane.Title.FontSpec.Size = 30f;
this.zedGraphControl1.GraphPane.Title.FontSpec.FontColor = Color.Blue;
this.zedGraphControl1.GraphPane.Title.FontSpec.Size = 30f;
this.zedGraphControl1.GraphPane.XAxis.Title.Text = "时间";
this.zedGraphControl1.GraphPane.XAxis.Title.FontSpec.FontColor = Color.Blue;
this.zedGraphControl1.GraphPane.XAxis.Title.FontSpec.Size = 20f;
this.zedGraphControl1.GraphPane.YAxis.Title.Text = "温度(℃)";
this.zedGraphControl1.GraphPane.YAxis.Title.FontSpec.FontColor = Color.Blue;
this.zedGraphControl1.GraphPane.YAxis.Title.FontSpec.Size = 20f;
//刻度值字体大小、颜色
this.zedGraphControl1.GraphPane.XAxis.Scale.FontSpec.Size = 20f;
this.zedGraphControl1.GraphPane.XAxis.Scale.FontSpec.FontColor = Color.Black;
this.zedGraphControl1.GraphPane.YAxis.Scale.FontSpec.Size = 20f;
this.zedGraphControl1.GraphPane.YAxis.Scale.Min = 0;
this.zedGraphControl1.GraphPane.YAxis.Scale.Max = 100;
this.zedGraphControl1.GraphPane.YAxis.Scale.MinorStep = 1;//小步长
//x轴数据类型
//x轴数据类型
this.zedGraphControl1.GraphPane.XAxis.Type = ZedGraph.AxisType.DateAsOrdinal;
this.zedGraphControl1.GraphPane.XAxis.Type = ZedGraph.AxisType.Date;
this.zedGraphControl1.GraphPane.XAxis.Type = ZedGraph.AxisType.Date;
this.zedGraphControl1.GraphPane.XAxis.Type = ZedGraph.AxisType.Text;//显示文本
this.zedGraphControl1.GraphPane.XAxis.Scale.Format = "HH:mm:ss";//时间格式
this.zedGraphControl1.GraphPane.XAxis.Scale.Format = "HH:mm:ss";//时间格式
//yy-mm-dd HH:mm:ss 其中HH是24小时制 hh是12小时制
//显示网格线
this.zedGraphControl1.GraphPane.YAxis.MajorGrid.IsVisible = true;
this.zedGraphControl1.GraphPane.XAxis.MajorGrid.IsVisible = true;
//legend图例
this.zedGraphControl1.GraphPane.Legend.FontSpec.Size = 10f;
this.zedGraphControl1.GraphPane.Legend.Position = LegendPos.Right;
//面板填充颜色
this.zedGraphControl1.GraphPane.Chart.Fill = new Fill(Color.White, Color.LightGray, 45.0f);
//在面板上添加文本
TextObj text2 = new TextObj(
"Zoom: left mouse & drag\nPan: middle mouse & drag\nContext Menu: right mouse",
0.05f, 0.95f, CoordType.ChartFraction, AlignH.Left, AlignV.Bottom);
text2.FontSpec.StringAlignment = StringAlignment.Near;
this.zedGraphControl1.GraphPane.GraphObjList.Add(text2);
//添加箭头图案
ArrowObj myArrow = new ArrowObj(Color.Red, 12F, 230F, 70F, 280F, 55F);
this.zedGraphControl1.GraphPane.GraphObjList.Add(myArrow);
// get a reference to the GraphPane
GraphPane myPane =zedGraphControl1.GraphPane;
// Set the Titles
myPane.Title.Text = "My Test Graph\n(For CodeProject Sample)";
myPane.XAxis.Title.Text = "My X Axis";
myPane.YAxis.Title.Text = "My Y Axis";
//设置图表大小
//设置图表大小
this.zedGraphControl1.Location = new Point(10, 10);
this.zedGraphControl1.Size = new Size(ClientRectangle.Width - 20, ClientRectangle.Height - 20);
this.zedGraphControl1.Size = new Size(ClientRectangle.Width - 20, ClientRectangle.Height - 20);
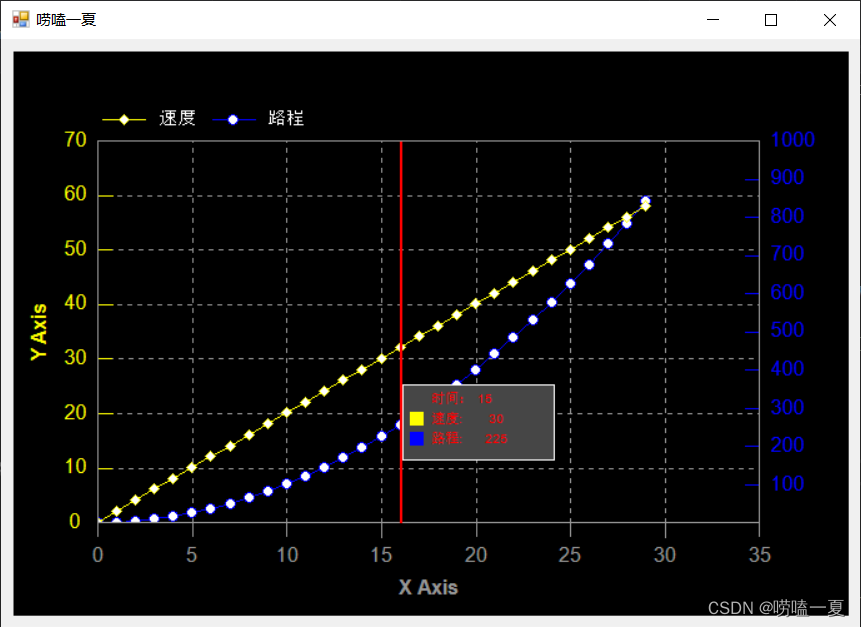
二、曲线的实时显示:
//显示曲线
list.Add(x,y);//添加数据点
LineItem mycurve = zedGraphControl1.GraphPane.AddCurve
("温度传感器1", list, Color.Red, SymbolType.Square);
//LineItem mycurve = zedGraphControl1.GraphPane.AddCurve
// ("温度传感器1", null, Ty, Color.Red, SymbolType.Square);
//this.zedGraphControl1.GraphPane.XAxis.Scale.TextLabels = Tx;
mycurve.Symbol.Size = 5.0f;//节点图案大小
mycurve.Line.Width = 2.0F;//线宽
//在面板上添加文本
TextObj text = new TextObj(y.ToString("") + "℃",
x, y*1.02, CoordType.AxisXYScale, AlignH.Center, AlignV.Top);
text.FontSpec.Size = 15f;
text.FontSpec.FontColor = Color.Black;
text.FontSpec.Border.IsVisible = false;
text.FontSpec.Fill.IsVisible = true;
text.ZOrder = ZOrder.A_InFront;
text.FontSpec.Fill = new Fill(Color.FromArgb(240, Color.Snow));
// Rotate the text to 90 degrees
//text.FontSpec.Angle = 60; //字体倾斜度
this.zedGraphControl1.GraphPane.GraphObjList.Add(text);
//更新坐标轴
this.zedGraphControl1.AxisChange();
//更新图像
this.zedGraphControl1.Refresh();
//同时清除该点的值!!注意索引 节点值刷新慢一拍
if (list.Count >= 9) this.zedGraphControl1.GraphPane.GraphObjList.RemoveAt(1);//删除改点处的文本
if (list.Count >= 10) list.RemoveAt(0);//大于10个点就删除第一个点
根据上面的设置就可以很容易定制自己的曲线图了。
三、程序参考:
<span style="font-size:14px;">        //标题、标签this.zedGraphControl1.GraphPane.Title.Text = "实时曲线图";this.zedGraphControl1.GraphPane.Title.FontSpec.FontColor = Color.Blue;this.zedGraphControl1.GraphPane.Title.FontSpec.Size = 30f;this.zedGraphControl1.GraphPane.XAxis.Title.Text = "时间";this.zedGraphControl1.GraphPane.XAxis.Title.FontSpec.FontColor = Color.Blue;this.zedGraphControl1.GraphPane.XAxis.Title.FontSpec.Size = 20f;this.zedGraphControl1.GraphPane.YAxis.Title.Text = "温度(℃)";this.zedGraphControl1.GraphPane.YAxis.Title.FontSpec.FontColor = Color.Blue;this.zedGraphControl1.GraphPane.YAxis.Title.FontSpec.Size = 20f;//this.zedGraphControl1.GraphPane.Chart.Border.Color  = Color .White  ;this.zedGraphControl1.GraphPane.Chart.IsRectAuto =true ;//刻度值字体大小this.zedGraphControl1.GraphPane.XAxis.Scale.FontSpec.Size = 20f;this.zedGraphControl1.GraphPane.YAxis.Scale.FontSpec.Size = 20f;this.zedGraphControl1.GraphPane.YAxis.Scale.Min = 0;this.zedGraphControl1.GraphPane.YAxis.Scale.Max = 50;//x轴类型this.zedGraphControl1.GraphPane.XAxis.Type = ZedGraph.AxisType.Date;this.zedGraphControl1.GraphPane.XAxis.Scale.Format = "HH:mm:ss";//显示网格线this.zedGraphControl1.GraphPane.YAxis.MajorGrid.IsVisible = true;this.zedGraphControl1.GraphPane.XAxis.MajorGrid.IsVisible = true;//legendthis.zedGraphControl1.GraphPane.Legend.FontSpec.Size = 10f;this.zedGraphControl1.GraphPane.Legend.Position = LegendPos.InsideTopRight;//面板填充颜色this.zedGraphControl1.GraphPane.Chart.Fill = new Fill(Color.White, Color.LightGray, 45.0f);//设置窗口大小SetSize();//更新画面this.zedGraphControl1.AxisChange();this.zedGraphControl1.Refresh();
</span>
定时显示程序:
<span style="font-size:14px;">         private void timer2_Tick(object sender, EventArgs e){this.zedGraphControl1.GraphPane.CurveList.Clear();//温度曲线1try{y = Convert.ToDouble(Convert.ToInt16(strTempureArry[4]) / 100.00); ;}catch{return;}//存储数据     StoreDataDelegate myStoreDataDelegate = new StoreDataDelegate(StoreData);//实例化委托myStoreDataDelegate(DateTimeNow, y);//调用委托list.Add(x, y);               LineItem mycurve = zedGraphControl1.GraphPane.AddCurve("温度传感器1", list, Color.Red, SymbolType.Circle);                          mycurve.Line.Width = 2.0F;//线宽TextObj textT1 = new TextObj(y.ToString("") + "℃",x, y*1.02, CoordType.AxisXYScale, AlignH.Center , AlignV.Bottom);textT1.FontSpec.Size = 10f;textT1.FontSpec.FontColor = Color.Red;textT1.FontSpec.Fill.IsVisible = false;textT1.FontSpec.Border.IsVisible = false;//textT1.ZOrder = ZOrder.A_InFront;//textT1.FontSpec.Fill = new Fill(Color.FromArgb(240, Color.Snow));this.zedGraphControl1.GraphPane.GraphObjList.Add(textT1);this.zedGraphControl1.AxisChange();this.zedGraphControl1.Refresh();//this.zedGraphControl1.Invalidate();if (list.Count >= 10){list.RemoveAt(0);//同时清除该点的值this.zedGraphControl1.GraphPane.GraphObjList.RemoveAt(0);}}
</span>
控件大小设置:
private void SetSize(){zedGraphControl1.Location = new Point(10, 10);zedGraphControl1.Size = new Size(ClientRectangle.Width - 100, ClientRectangle.Height - 200);}