主要对matlab三维绘图函数进行总结并展示一下绘图结果,重点不在函数解读,在于函数介绍,函数的具体使用可以查看matlab的help文档。
| 函数名 | 说明 |
| line,plot3,ezplot3 | 绘制三维曲线 |
| mesh,ezmesh | 绘制三维网状图 |
| meshc,ezmeshc | 绘制带有等高线的三维网状图 |
| meshz | 绘制带有“围裙”的网状图 |
| surf,ezsurf | 绘制三维曲面图 |
| surfc,ezsurfc | 绘制带有等高线的三维曲面图 |
| surfl | 绘制带有光照的三维曲面图 |
| surfnorm | 计算或者显示三维表面法向 |
| contour3 | 绘制三维等高线图 |
| waterfall | 绘制带有水流效果的三维图 |
| pcolor | 绘制以颜色表示高度的图形 |
1. line,plot3,ezplot3绘制三维曲线
t=linspace(0,pi,401); %生成图形窗口
xf=inline('sin(t*8)*2'); %生成内联函数
yf=inline('cos(t*8)*3');
s(1)= subplot(131);
%利用函数line绘制三维曲线
line(sin(t*8),cos(t*8),t);
s(2)=subplot(132);
%利用plot3绘制两条曲线
plot3(sin(t*8)/2,cos(t*8)/2,t,'k',sin(t*16),cos(t*16),t,'r:');
s(3)=subplot(133);
%根据符号表达式绘制三维曲线
ezplot3(xf,yf,inline('t'),[-3,3]);
axis equal;
%设置坐标轴视角
view(s(1),[-33,14]);
view(s(2),[-33,14]);
view(s(3),[44,62]);
2.mesh绘制三维网格图
[X,Y]=meshgrid(-2:0.2:2, -2:0.2:2);%生成坐标格网矩阵
Z=X.*exp(-X.^2-Y.^2);
subplot(131);mesh(X,Y,Z);%绘制网状图
xlabel('(a)','Fontsize',14,'Fontname','Times New Roman');
subplot(132);mesh(X,Y,Z,rand(size(Z)));%绘制随机彩色网状图
xlabel('(b)','Fontsize',14,'Fontname','Times New Roman');
subplot(133);mesh(X,Y,Z,2*ones(size(Z)),'EdgeColor','k');%绘制单色网状图
xlabel('(c)','Fontsize',14,'Fontname','Times New Roman');

3.ezmesh绘制三维网格图
zfun=inline('sqrt(1-s^2-t^2)');%定义内联函数
xs=inline('cos(s)*cos(t)');
ys=inline('cos(s)*sin(t)');
zs=inline('sin(s)');
subplot(131);ezmesh(zfun,100);%绘制网状图并指明采样点数
xlabel('(a)','Fontsize',14,'Fontname','Times New Roman');
subplot(132);ezmesh(zfun,[-1,1],20);
xlabel('(b)','Fontsize',14,'Fontname','Times New Roman');
subplot(133);ezmesh(xs,ys,zs,[-pi,pi],20);
xlabel('(c)','Fontsize',14,'Fontname','Times New Roman');

改变ezmesh绘制网状图的着色方案
xs=inline('cos(s)*cos(t)');
ys=inline('cos(s)*sin(t)');
zs=inline('sin(s)');
subplot(131);ezmesh(xs,ys,zs,[0,pi],16);
view([-39,56])
xlabel('(a)','Fontsize',14,'Fontname','Times New Roman');
subplot(132);ezmesh(xs,ys,zs,[0,pi],16);
view([-39,56])
S1=get(gca,'Children');
set(S1,'CData',rand(size(get(S1,'CData'))));%通过句柄对网状图着色
xlabel('(b)','Fontsize',14,'Fontname','Times New Roman');
subplot(133);ezmesh(xs,ys,zs,[0,pi],16);
view([-39,56])
S1=get(gca,'Children');
set(S1,'EdgeColor','k');%通过句柄对网状图着色
xlabel('(c)','Fontsize',14,'Fontname','Times New Roman');

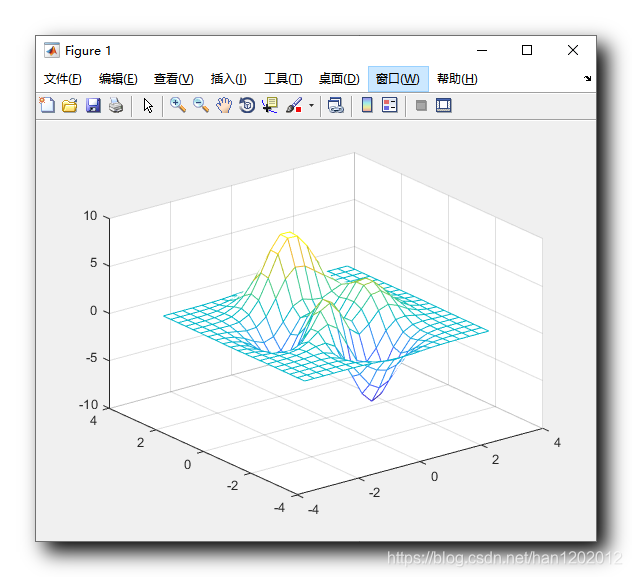
5.meshc绘制带有等高线的网状图
[X,Y,Z]=peaks(30);%生成坐标数据
subplot(121),meshc(Z);%生成带等高线的网状图
xlabel('(a)','Fontsize',14,'Fontname','Times New Roman');
subplot(122),m=meshc(X,Y,Z,Z);
set(m(1),'EdgeColor','k');%通过句柄改变属性
xlabel('(b)','Fontsize',14,'Fontname','Times New Roman');

6.ezmeshc绘制带有等高线的网状图
subplot(131),ezmeshc('imag(atan(x+i*y))',[-4,4]);
xlabel('(a)','Fontsize',14,'Fontname','Times New Roman');
subplot(132),ezmeshc('real(log(x+i*y))',[-4,4],30);
xlabel('(b)','Fontsize',14,'Fontname','Times New Roman');
S2=get(gca,'Children');set(S2(end),'EdgeColor','k');
subplot(133),ezmeshc('real(log(x+i*y))',[-4,4],'circ');
xlabel('(c)','Fontsize',14,'Fontname','Times New Roman');

7.meshz绘制带有“围裙”的网状图
[X,Y,Z]=peaks(30);%生成坐标数据
subplot(121),meshz(Z);%生成带"围裙"的网状图
xlabel('(a)','Fontsize',14,'Fontname','Times New Roman');
subplot(122),m=meshz(X,Y,Z,Z);
set(m(1),'EdgeColor','k');%通过句柄改变属性
xlabel('(b)','Fontsize',14,'Fontname','Times New Roman');

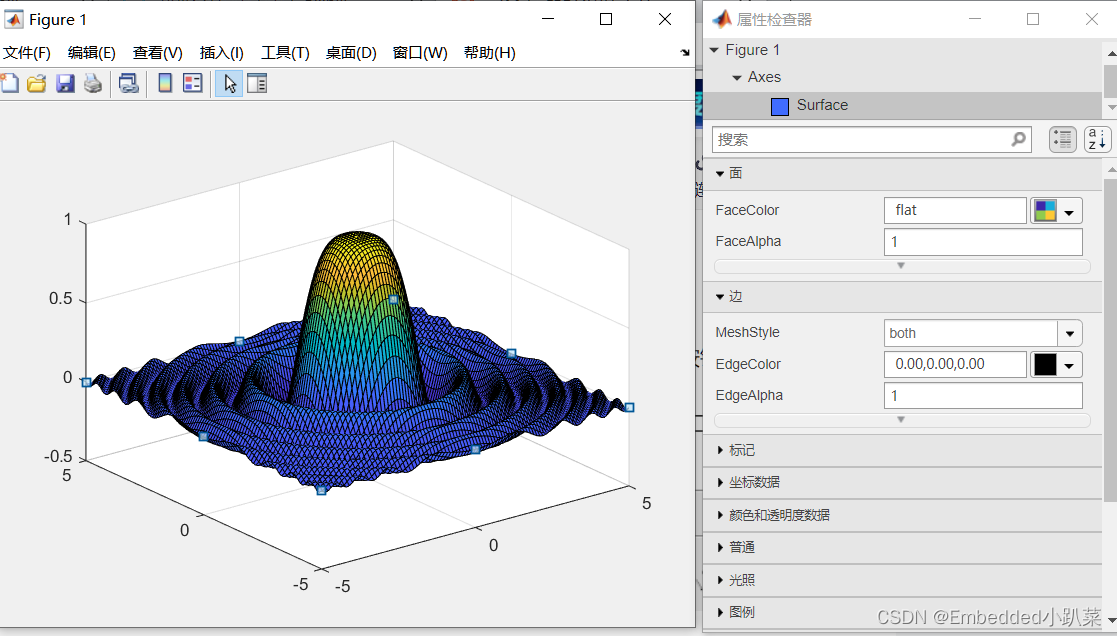
8.surf绘制三维曲面图
[x,y]=meshgrid(linspace(-3,3,31));%生成格网坐标
z=(x-y).*exp(-(x.^2+y.^2)/2);
subplot(121),surf(x,y,z);%绘制曲面图
xlabel('(a)','Fontsize',14,'Fontname','Times New Roman');
subplot(122),surf(x,y,z,'EdgeColor','flat');
xlabel('(b)','Fontsize',14,'Fontname','Times New Roman');

9.ezsurf根据数学表达式绘制三维曲面
funx=inline('sin(s)*t');%定义数学表达式
funy=inline('cos(s)*t');
funz=inline('sinc(t)');
subplot(231),ezsurf(@(x,y) funz(x)*cos(y));%绘制曲面图
xlabel('(a)','Fontsize',14,'Fontname','Times New Roman');
subplot(232),ezsurf(@(x,y) sin(x*2)*sinc(y),[-pi,pi]);%绘制曲面图,并设定网格线属性
xlabel('(b)','Fontsize',14,'Fontname','Times New Roman');
subplot(233),ezsurf(funx,funy,funz);%绘制曲面图,并设定网格线属性
xlabel('(c)','Fontsize',14,'Fontname','Times New Roman');
subplot(234),ezsurf(@(s,t) funx(s,t)*sin(t),@(s,t) funy(s,t)*cos(t^2),...@(s,t) funz(t)*sinc(s),[-2,2]);%绘制曲面图,并设定网格线属性
xlabel('(d)','Fontsize',14,'Fontname','Times New Roman');
subplot(235),ezsurf(@(s,t) funz(t)*sin(s),30);%绘制曲面图,并设定网格线属性
xlabel('(e)','Fontsize',14,'Fontname','Times New Roman');
subplot(236),ezsurf(@(s,t) exp(-[s^2+t^2]),[-2,2],2,'circ');%绘制曲面图,并设定网格线属性
xlabel('(f)','Fontsize',14,'Fontname','Times New Roman');

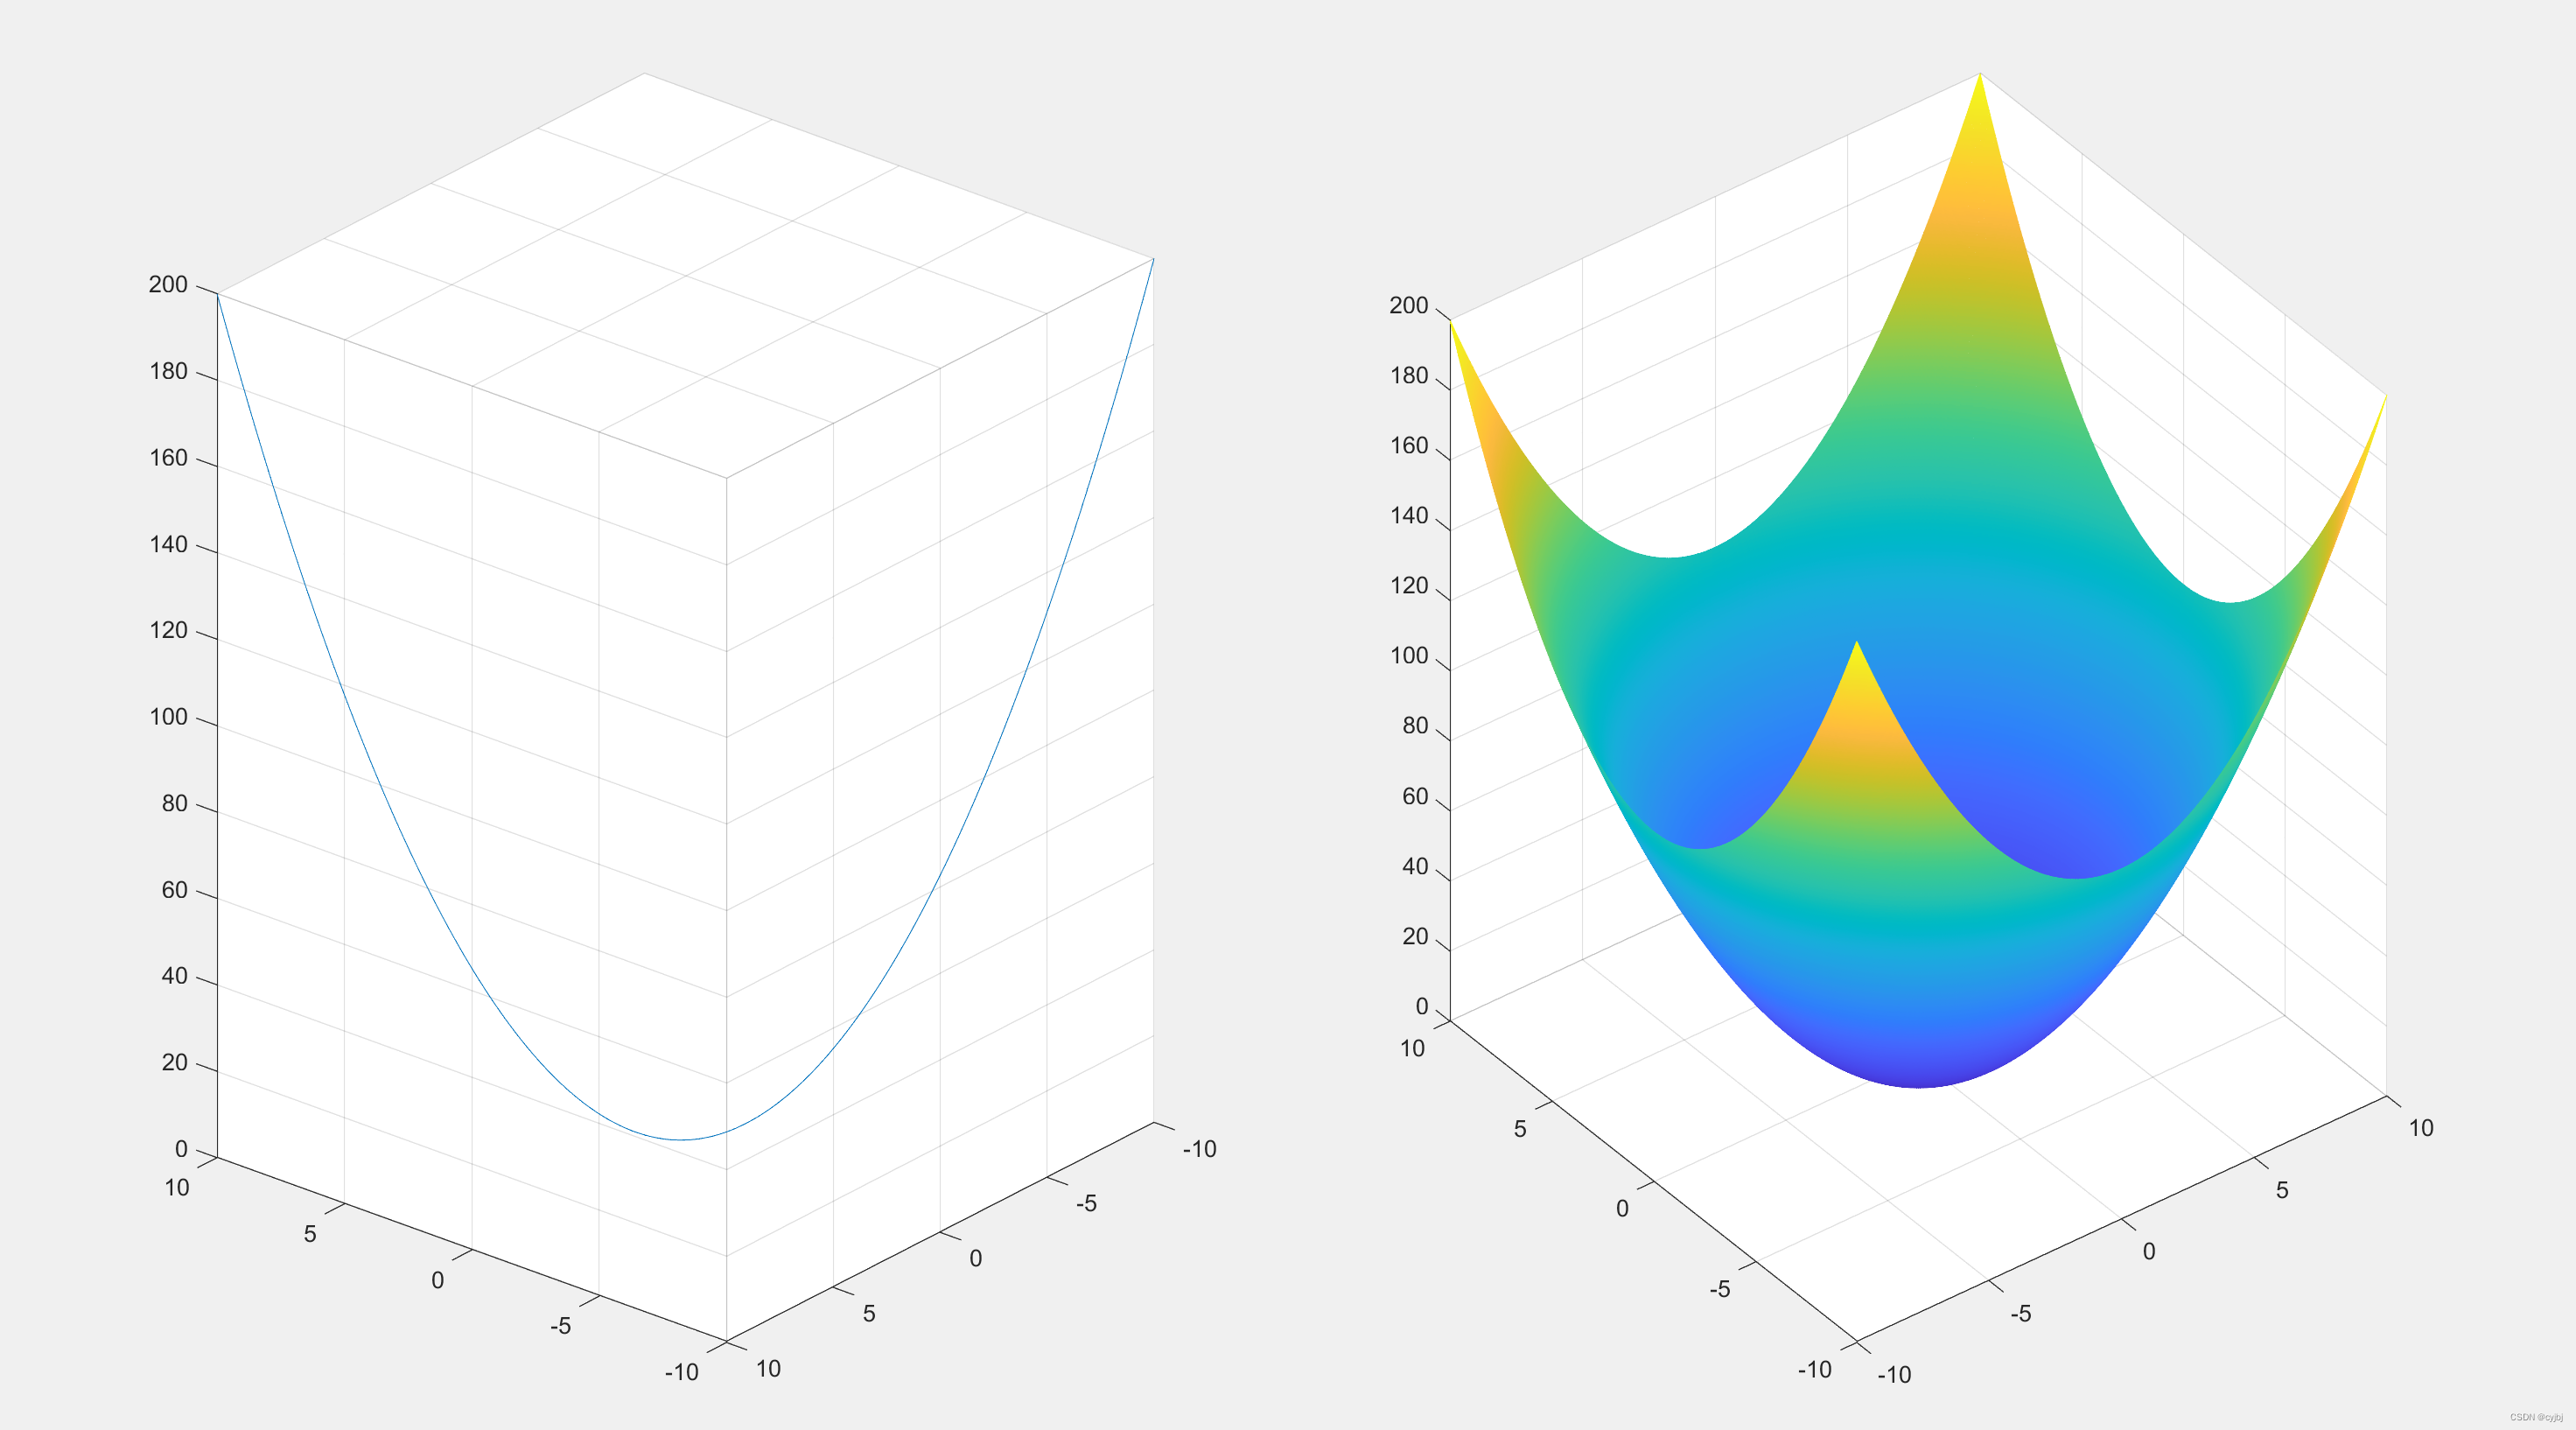
10.surfc绘制带有等高线的曲面
[x,y]=meshgrid(linspace(-4,4,30));%生成采样数值点
z=3*(x-1).^2.*exp(-x.^2-(y-1).^2)-8*(x/5-x.^3-y.^5).*exp(-x.^2-y.^2)-...1/4*exp(-(x+1).^2-y.^2);
subplot(121),surfc(x,y,z);%绘制三维曲面
xlabel('(a)','Fontsize',14,'Fontname','Times New Roman');
subplot(122),surfc(x,y,z,'EdgeColor','k','FaceColor','None');%设置曲面颜色属性
xlabel('(b)','Fontsize',14,'Fontname','Times New Roman');

ezsurfc绘制带有等高线的曲面
subplot(121)
ezsurfc(@(x,y)sin(x)*exp(-x.^2-y.^2));
subplot(122)
ezsurfc(@(x,y)sin(2*y)*exp(-x.^2-y^2/2),[-2,2],'circ');
view([-111,42])
11.surfl绘制带有光照效果的曲面
[x,y,z]=peaks(30);
subplot(121),surfl(x,y,z);
shading interp;%着色淡化处理
colormap(gray);
axis([-3,3,-3,3]);view(3);%设置颜色为灰度、坐标轴范围和视角
subplot(122)
surfl(x,y,z,[0.8,0.2,0.8],'light');%带有光照效果
shading interp;
axis([-3,3,-3,3]);view(3);
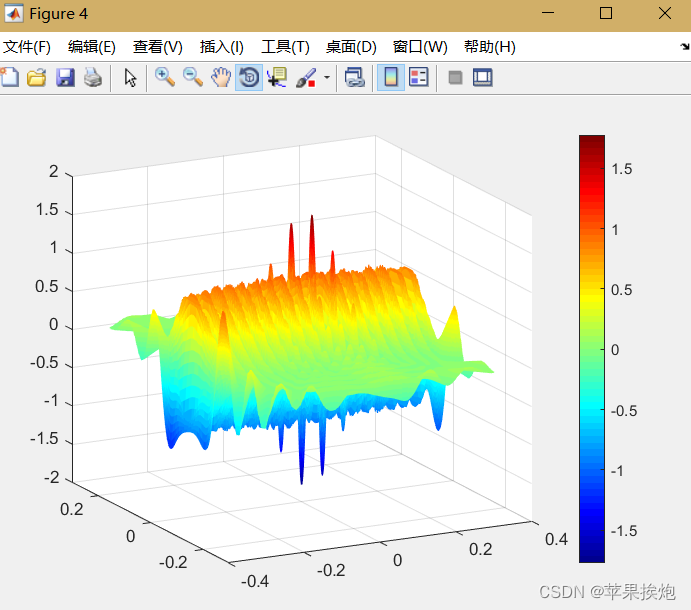
12.surfnorm计算或者显示三维表面法向
[X,Y,Z]=peaks(40);
surfnorm(X,Y,Z);xlim([-3,3]);ylim([-3,3]);

13.contour3绘制三维等高线
subplot(121),contour3(peaks(40));%绘制三维等高线
xlabel('(a)','Fontsize',14,'Fontname','Times New Roman');
subplot(122),mesh(peaks(40),'EdgeColor',[0.85,0.85,0.85]);%绘制三维网状曲面,并设置网格线为浅灰色
hold on
contour3(peaks(40));
xlabel('(b)','Fontsize',14,'Fontname','Times New Roman');

14.waterfall绘制具有流水效果的的曲面,瀑布图
[x,y,z]=peaks(40);
subplot(131),waterfall(peaks(40));%绘制具有流水效果的曲面
xlabel('(a)','Fontsize',14,'Fontname','Times New Roman');
subplot(132),waterfall(peaks(40),rand(40));%绘制具有流水效果的曲面
xlabel('(b)','Fontsize',14,'Fontname','Times New Roman');
subplot(133),w=waterfall(x',y',z');%绘制具有流水效果的曲面
set(w,'EdgeColor','k');
xlabel('(c)','Fontsize',14,'Fontname','Times New Roman');

15.pcolor绘制以颜色表示高度值的图形
[x,y,z]=peaks(20);
subplot(131),pcolor(x,y,z);%伪色绘图
xlabel('(a)','Fontsize',14,'Fontname','Times New Roman');
subplot(132),p=pcolor(x,y,z);
set(p,'EdgeColor','flat');%除去网格线
xlabel('(b)','Fontsize',14,'Fontname','Times New Roman');
subplot(133),hi=image(z);
set(hi,'CDataMapping','scaled');%设置颜色映像属性
xlabel('(c)','Fontsize',14,'Fontname','Times New Roman');
set(gca,'YDir','normal');

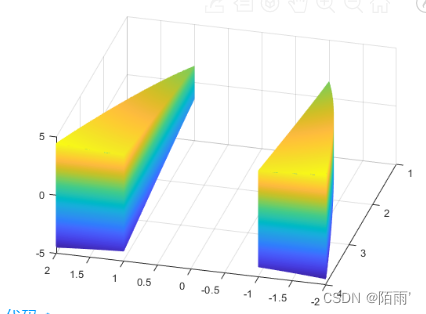
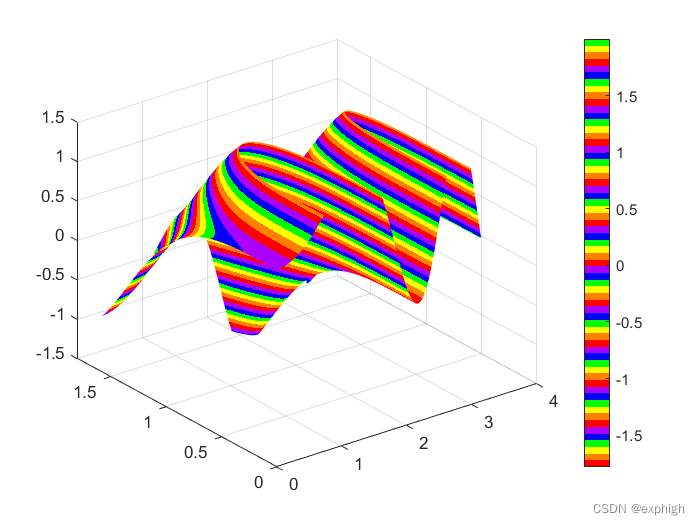
16.曲面切割效果
水平方向切割
[x,y,z]=peaks(800);
subplot(131),surf(x,y,z);shading interp;
xlabel('(a)','Fontsize',14,'Fontname','Times New Roman');
z(z>4)=2;
z(z<-4)=-4;
subplot(132),surf(x,y,z);
view(-48,52);shading interp;
xlabel('(b)','Fontsize',14,'Fontname','Times New Roman');
subplot(133),surf(x,y,-z);
view(-48,52);shading interp;
xlabel('(c)','Fontsize',14,'Fontname','Times New Roman');

任意切割
[x,y,z]=peaks(200);
z1=z;
z1(x<0&y>0)=nan;%利用NaN切割曲面
z2=z;
z2(sqrt(x.^2+y.^2)<1.2)=nan;
subplot(131),surf(x,y,z);
shading interp;
xlim([-3,3]);ylim([-3,3]);
xlabel('(a)','Fontsize',14,'Fontname','Times New Roman');
subplot(132),surf(x,y,z1);
shading interp;
xlim([-3,3]);ylim([-3,3]);
xlabel('(b)','Fontsize',14,'Fontname','Times New Roman');
subplot(133),surf(x,y,z2);
shading interp;
xlim([-3,3]);ylim([-3,3]);
xlabel('(c)','Fontsize',14,'Fontname','Times New Roman');

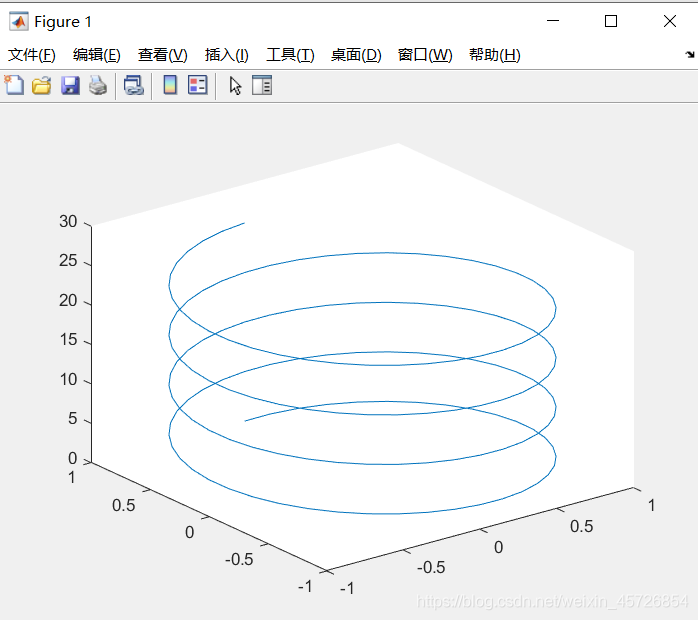
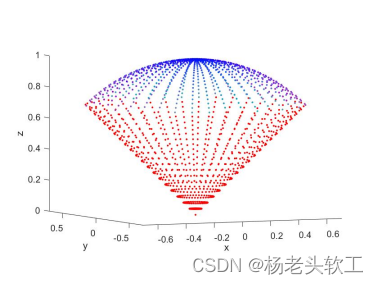
17.cylinder生成关于z轴旋转对称的螺旋体坐标
r=2+cos(linspace(0,pi*2));%生成半径向量
[x1,y1,z1]=cylinder(r);%生成螺旋体坐标
[x2,y2,z2]=cylinder(r,30);
subplot(131),cylinder(r);%生成三维螺旋体
xlabel('(a)','Fontsize',14,'Fontname','Times New Roman');
subplot(132),surf(x1,y1,z1);
xlabel('(b)','Fontsize',14,'Fontname','Times New Roman');
subplot(133),mesh(x2,y2,z2);
xlabel('(c)','Fontsize',14,'Fontname','Times New Roman');

18.sphere生成单位球体坐标
[x,y,z]=sphere;
subplot(121),sphere;
xlabel('(a)','Fontsize',14,'Fontname','Times New Roman');
subplot(122),surf(x,y,z);
xlabel('(b)','Fontsize',14,'Fontname','Times New Roman');

19.slice绘制三维切片图
[x,y,z]=meshgrid(-2:0.2:2,-2:0.25:2,-2:0.16:2);
v=x.*exp(-x.^2-y.^2-z.^4);
[xi,yi]=meshgrid(-2:0.1:2);
zi=6*exp(-[xi.^2+yi.^2]).*xi;%计算完全切面轴坐标
zi(zi>1)=1;zi(zi<-1)=-1;%限制zi取值范围
subplot(121),slice(x,y,z,v,[-1.2 0.8 2],2,[-2 -0.2]);%绘制切片图
xlabel('(a)','Fontsize',14,'Fontname','Times New Roman');
subplot(122),slice(x,y,z,v,zi,xi,yi);
xlabel('(b)','Fontsize',14,'Fontname','Times New Roman');
参考文献
刘正君.《MATLAB科学计算与可视化仿真宝典》