SIR II (Epidemic modeling)
jupyter notebook link
在这个模型中,考虑一个在一定空间内的流行病模型。人只能与附近的人交互作用,所以给人在一定的空间里随机运动。
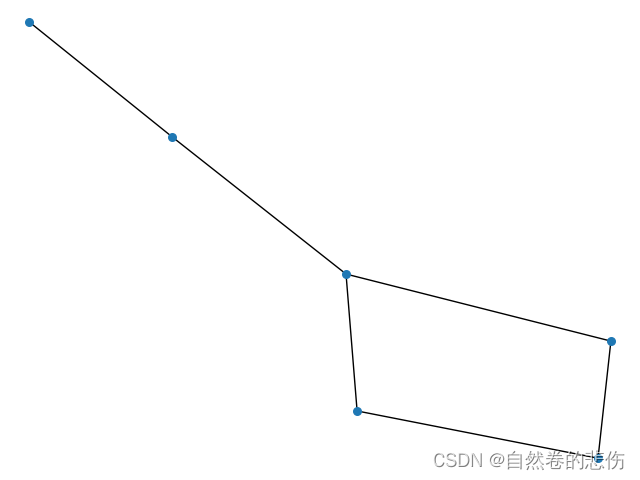
首先,在一个2维平面,随机游走:
using Plots
using Compose
using Cairo
using Fontconfig
struct Coordinate{T}x::Ty::T
end#定义 +
function Base.:+(a::Coordinate, b::Coordinate)return Coordinate(a.x+b.x, a.y+b.y)
endpossiblemoves = [Coordinate( 1, 0), Coordinate( 0, 1), Coordinate(-1, 0), Coordinate( 0,-1),]
#每一步随机取possiblemoves中的一个,加上去,形成随机游走function randwalk(P::Coordinate, n::Int)accumulate(+, rand(possiblemoves, n); init = P)
end#绘图
function p_tuple(c)c.x, c.yend
P = plot(ratio=1)
pline = randwalk(Coordinate(4,4), 1000)
figure = plot!(P, p_tuple.(pline),label=nothing, linewidth=2, linealpha=LinRange(1.0, 0.2, length(pline)))
#savefig(figure,"figure1.png")

function p_plot(p::Plots.Plot, line::Vector)plot!(p, p_tuple.(line), label=nothing,linewidth=2, linealpha=LinRange(1.0, 0.2, length(pline)))
end
p1 = plot(ratio=1)for i ∈ 1:10p_plot(p1, randwalk(Coordinate(4,4), 1000))
end
p1

给定一个空间,点在空间中移动,一旦超过边界,返回点在边界上:
空间大小为: L × L L\times L L×L
function boundary(c::Coordinate, L::Number)x, y = [c.x, c.y]if c.x < -Lx = -Lelseif c.x > Lx = Lendif c.y < -Ly = -Lelseif c.y > Ly = Lendreturn Coordinate(x, y)
end
boundary (generic function with 1 method)
然后利用边界对随机游走进行限制
function randwalk_boundary(P::Coordinate, n::Int, L::Number)res = accumulate(+, rand(possiblemoves, n); init = P)return boundary.(res, L)
end
p1 = plot(ratio=1)for i ∈ 1:10p_plot(p1, randwalk_boundary(Coordinate(4,4), 1000, 20))
end
p1

定义一个结构,每个人包括一个位置坐标和一个感染状况。
@enum InfectionStatus S I R
abstract type AbstractAgent end
mutable struct Agent <: AbstractAgentposition::Coordinatestatus::InfectionStatus
end
初始化,生成一堆人,随机挑选一个设为感染者:
function initialize(N::Number, L::Number)res = []for i ∈ 1:Npush!(res, Agent(Coordinate(rand(-L:L), rand(-L:L)), S))endranNum = rand(1:N)res[ranNum].status = Ireturn res
end
initialize (generic function with 1 method)
initialize(3, 10)
3-element Array{Any,1}:Agent(Coordinate{Int64}(-7, -5), S)Agent(Coordinate{Int64}(-5, 5), I)Agent(Coordinate{Int64}(-6, 10), S)
对每一种人用不同的颜色表示:
#deepskyblue,salmon,limegreen
color(s::InfectionStatus) = if s == S"deepskyblue"elseif s == I"salmon"else"limegreen"endcolor(a::Agent) = color(a.status)
color (generic function with 2 methods)
#将初始化的人,可视化
function visualize(agents::Vector, L)p = plot(ratio=1, framestyle = :box, xaxis=nothing, yaxis=nothing)c = color.(agents)l = length(agents)scatter!([agents[i].position.x for i=1:l], [agents[i].position.y for i=1:l], c=c)return p
end
N = 20
L = 10
visualize(initialize(N, L), L)

像之前模型一那样,定义传染的函数:
abstract type AbstractInfection endstruct CollisionInfectionRecovery <: AbstractInfectionp_infection::Float64p_recovery::Float64
end
function bernoulli(p)return rand() ≤ p
end
bernoulli (generic function with 1 method)
#重合有几率感染
function interact!(agent::Agent, source::Agent, infection::CollisionInfectionRecovery)if source.position == agent.position && bernoulli(infection.p_infection)if agent.status == S && source.status == Iagent.status = Ielseif source.status == S && agent.status == Isource.status = Iendelseif agent.status == I && bernoulli(infection.p_recovery)agent.status = Rendreturn (agent, source)
end
interact! (generic function with 1 method)
function step!(agents::Vector, L::Number, infection::AbstractInfection)ranNum = rand(1:length(agents)) agents[ranNum].position += rand(possiblemoves)agents[ranNum].position = boundary(agents[ranNum].position, L)for i ∈ 1:length(agents)if i ≠ ranNumagents[i], agents[ranNum] = interact!(agents[i], agents[ranNum], infection)endendreturn agents
end
step! (generic function with 1 method)
function sweep!(agents::Vector, L::Number, infection::AbstractInfection)for i ∈ 1:length(agents)agents = step!(agents, L, infection)endreturn agents
end
sweep! (generic function with 1 method)
pandemic = CollisionInfectionRecovery(0.5, 10^-5)
function SimulateTest(N::Int64, L::Number, ksweeps::Number)agents = initialize(N, L)plot_before = visualize(agents, L) # replace with your codefor i ∈ 1:ksweepsagents = sweep!(agents, L, pandemic)endplot_after = visualize(agents, L)p = plot(plot_before, plot_after)return p
endSimulateTest(50, 40, 1000)#需要按照WebIO扩展
#@manipulate for ksweeps ∈ 1:10000
#    SimulateTest(50, 40, ksweeps)
#end
#Count
k_sweep_max = 10000
function countingSIR(agents::Vector)result_S, result_I, result_R = 0, 0, 0for i in agentsif i.status == Sresult_S += 1elseif i.status == Iresult_I += 1elseif i.status == Rresult_R += 1endendreturn (result_S, result_I, result_R)
end#40人, 30×30面积
N = 40
L = 30agents = initialize(N, L)
result_S = Int[]
result_I = Int[]
result_R = Int[]
for t ∈ 1:k_sweep_maxagents = sweep!(agents, L, pandemic)s, i, r = countingSIR(agents)push!(result_S, s)push!(result_I, i)push!(result_R, r)
end
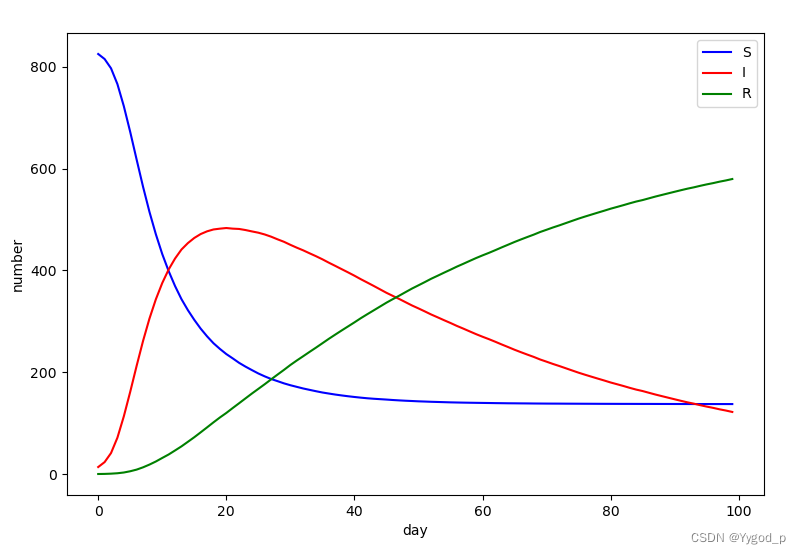
p = plot(leg=:outerright)
plot!(result_S, label="S")
plot!(result_I, label="I")
plot!(result_R, label="R")

N = 100
L = 50
x = initialize(N, L)
pandemicI = CollisionInfectionRecovery(0.5, 0.00001)Ss, Is, Rs = Int[], Int[], Int[]Tmax = 100@gif for t ∈ 1:Tmaxfor i ∈ 1:50Nstep!(x, L, pandemicI)endresult_SIR = countingSIR(x)push!(Ss, result_SIR[1])push!(Is, result_SIR[2])push!(Rs, result_SIR[3])l = visualize(x, L)r = plot(xlim=(1, Tmax), ylim=(1, N))plot!(r, 1:t, Ss, color=color(S), label="S")plot!(r, 1:t, Is, color=color(I), label="I")plot!(r, 1:t, Rs, color=color(R), label="R")plot(l, r)
end

现在添加社交,社交概率:越大越可能接触
mutable struct SocialAgent <: AbstractAgentposition::Coordinatestatus::InfectionStatusnum_infected::Intsocial_score::Float64
end
position(a::SocialAgent) = a.position
color(a::SocialAgent) = color(a.status)
function initialize_social(N, L)res = []for i ∈ 1:Npush!(res, SocialAgent(Coordinate(rand(-L:L), rand(-L:L)), S, 0, rand(0.1:0.01:0.5)))endranNum = rand(1:N)res[ranNum].status = Ireturn res
end#社交概率和感染概率决定是否被感染
function interact!(agent::SocialAgent, source::SocialAgent, infection::CollisionInfectionRecovery)total_scores = agent.social_score + source.social_scoreif source.position == agent.position && bernoulli(infection.p_infection) && bernoulli(total_scores)if agent.status == S && source.status == Iagent.status = Ielseif source.status == S && agent.status == Isource.status = Iendelseif agent.status == I && bernoulli(infection.p_recovery)agent.status = Rendreturn (agent, source)
end
Simulate
N = 50
L = 50global social_agents = initialize_social(N, L)
x = copy(social_agents)
pandemicI = CollisionInfectionRecovery(0.5, 0.00001)Ss, Is, Rs = Int[], Int[], Int[]Tmax = 200@gif for t ∈ 1:Tmaxfor i ∈ 1:50Nstep!(x, L, pandemicI)endresult_SIR = countingSIR(x)push!(Ss, result_SIR[1])push!(Is, result_SIR[2])push!(Rs, result_SIR[3])l = visualize(x, L)r = plot(xlim=(1, Tmax), ylim=(1, N))plot!(r, 1:t, Ss, color=color(S), label="S")plot!(r, 1:t, Is, color=color(I), label="I")plot!(r, 1:t, Rs, color=color(R), label="R")plot(l, r, size=(1000, 600))
end

降低社交概率:
N = 50
L = 40x = initialize_social(N, L)
for i in 1:Nx[i].social_score *= 0.25
end
pandemicI = CollisionInfectionRecovery(0.5, 0.00001)Ss, Is, Rs = Int[], Int[], Int[]Tmax = 200@gif for t ∈ 1:Tmaxfor i ∈ 1:50Nstep!(x, L, pandemicI)endresult_SIR = countingSIR(x)push!(Ss, result_SIR[1])push!(Is, result_SIR[2])push!(Rs, result_SIR[3])l = visualize(x, L)r = plot(xlim=(1, Tmax), ylim=(1, N))plot!(r, 1:t, Ss, color=color(S), label="S")plot!(r, 1:t, Is, color=color(I), label="I")plot!(r, 1:t, Rs, color=color(R), label="R")plot(l, r, size=(1000, 600), title="Lock")
end