在画图时候遇到的记录一下 希望可以帮到遇到相同问题的伙伴儿~~
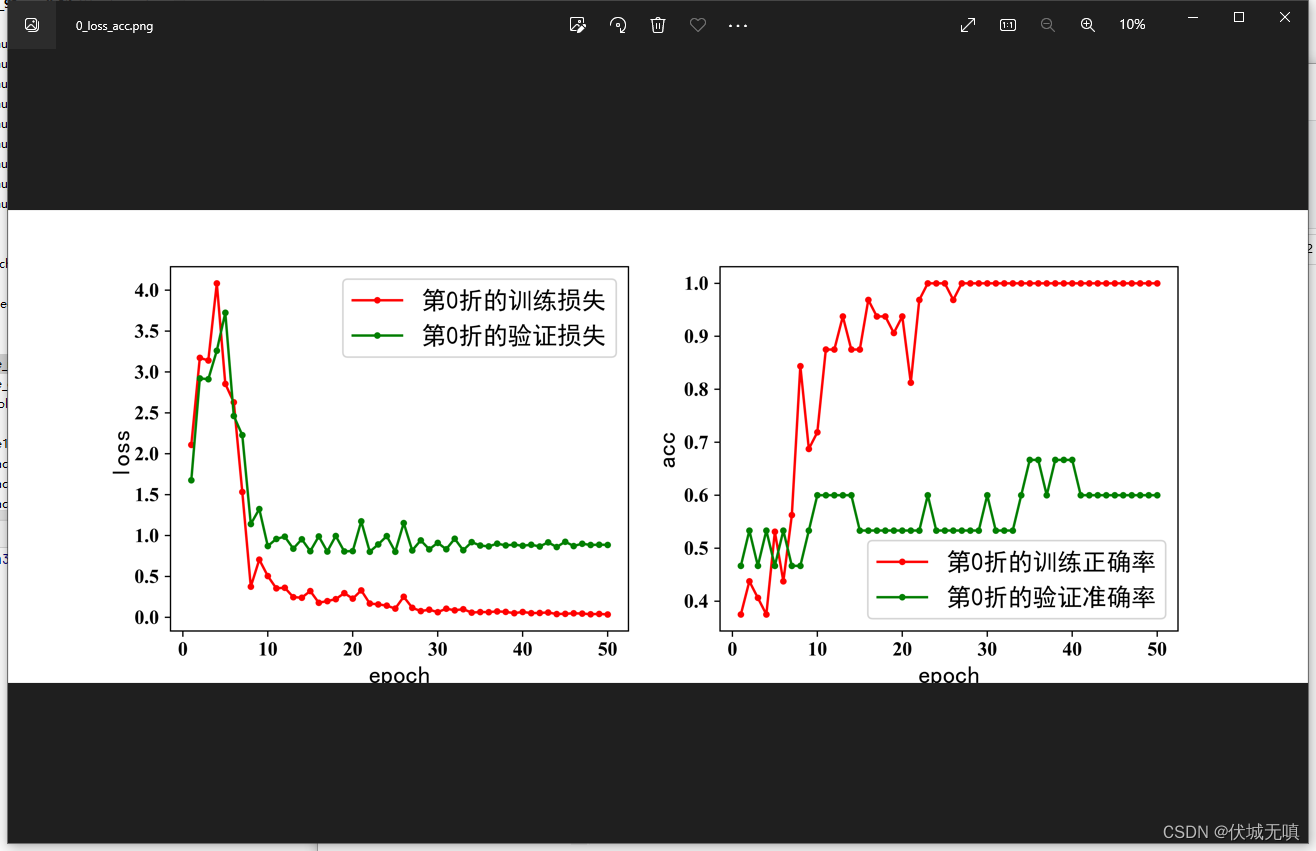
本来是这样:
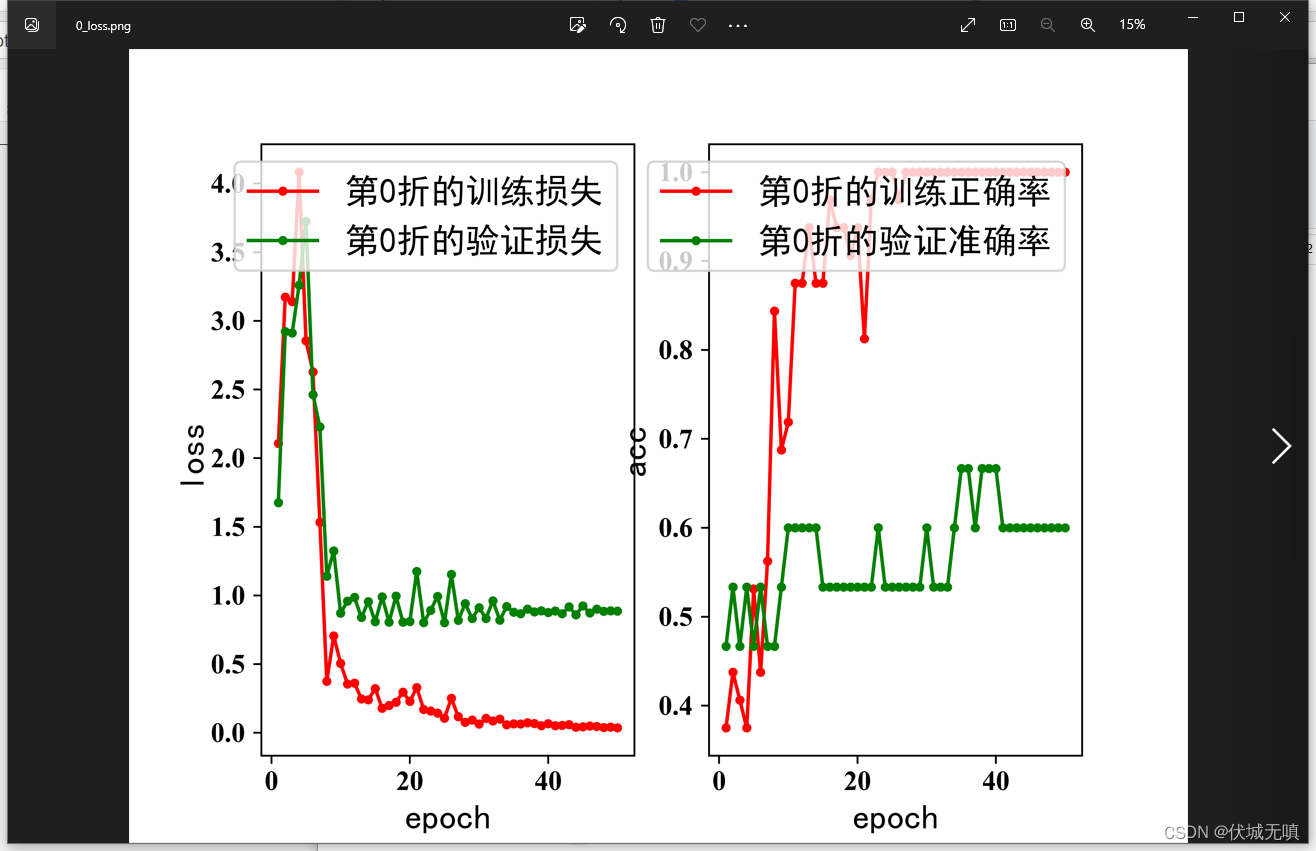
本来代码:
plt.subplot(1, 2, 1)plt.rcParams['font.sans-serif'] = ['SimHei']plt.rcParams['axes.unicode_minus'] = Falseplt.rcParams['figure.dpi'] = 1080plt.rcParams['figure.figsize'] = (8.0, 16.0)plt.plot(x, trian_loss, marker = '.', color = 'red', label = "第" + str(i) + "折的训练损失")plt.plot(x, test_loss, marker = '.', color = 'green', label = "第" + str(i) + "折的验证损失")plt.xlabel('epoch', fontsize=15)plt.ylabel('loss', fontsize=15)plt.yticks(fontproperties='Times New Roman', size=12, weight='bold') # 设置大小及加粗plt.xticks(fontproperties='Times New Roman', size=12, weight='bold')plt.legend(loc='upper right', fontsize=15)#第二个acc图plt.subplot(1, 2, 2)plt.rcParams['font.sans-serif'] = ['SimHei']plt.rcParams['axes.unicode_minus'] = Falseplt.rcParams['figure.dpi'] = 1080plt.rcParams['figure.figsize'] = (8.0, 16.0)plt.plot(x, train_acc, marker='.', color='red', label="第" + str(i) + "折的训练正确率")plt.plot(x, test_acc, marker='.', color='green', label="第" + str(i) + "折的验证准确率")plt.xlabel('epoch', fontsize=15)plt.ylabel('acc', fontsize=15)plt.yticks(fontproperties='Times New Roman', size=12, weight='bold') # 设置大小及加粗plt.xticks(fontproperties='Times New Roman', size=12, weight='bold')plt.legend(loc='lower right', fontsize=15)#保存save_root_path = root_path + 'figure/'if not os.path.exists(save_root_path):os.makedirs(save_path)save_path = save_root_path + str(i) + '_loss_acc.png'plt.savefig(save_path, dpi=1080)
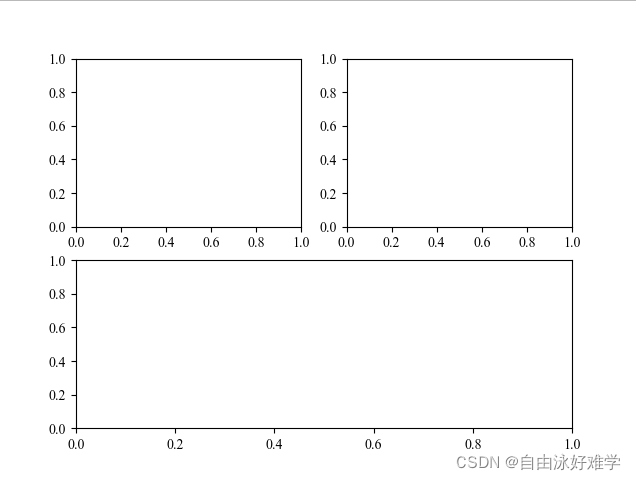
只需要加一行代码并且给子图分别加上名字:
fig = plt.figure(figsize=(11, 4))
fig_1 = plt.subplot(1, 2, 1)
fig_2 = plt.subplot(1, 2, 2)
ps:这里子图2图注换到了右下角,与本分享讨论的问题无关,可忽略~~
改后代码:里面参数可以自己设置
fig = plt.figure(figsize=(11, 4))plt.title("第" + str(i) + "折")fig_1 = plt.subplot(1, 2, 1)plt.rcParams['font.sans-serif'] = ['SimHei']plt.rcParams['axes.unicode_minus'] = Falseplt.rcParams['figure.dpi'] = 1080plt.rcParams['figure.figsize'] = (8.0, 16.0)plt.plot(x, trian_loss, marker = '.', color = 'red', label = "第" + str(i) + "折的训练损失")plt.plot(x, test_loss, marker = '.', color = 'green', label = "第" + str(i) + "折的验证损失")plt.xlabel('epoch', fontsize=15)plt.ylabel('loss', fontsize=15)plt.yticks(fontproperties='Times New Roman', size=12, weight='bold') # 设置大小及加粗plt.xticks(fontproperties='Times New Roman', size=12, weight='bold')plt.legend(loc='upper right', fontsize=15)#第二个acc图fig_2 = plt.subplot(1, 2, 2)plt.rcParams['font.sans-serif'] = ['SimHei']plt.rcParams['axes.unicode_minus'] = Falseplt.rcParams['figure.dpi'] = 1080plt.rcParams['figure.figsize'] = (8.0, 16.0)plt.plot(x, train_acc, marker='.', color='red', label="第" + str(i) + "折的训练正确率")plt.plot(x, test_acc, marker='.', color='green', label="第" + str(i) + "折的验证准确率")plt.xlabel('epoch', fontsize=15)plt.ylabel('acc', fontsize=15)plt.yticks(fontproperties='Times New Roman', size=12, weight='bold') # 设置大小及加粗plt.xticks(fontproperties='Times New Roman', size=12, weight='bold')plt.legend(loc='lower right', fontsize=15)#保存save_root_path = root_path + 'figure/'if not os.path.exists(save_root_path):os.makedirs(save_path)save_path = save_root_path + str(i) + '_loss_acc.png'plt.savefig(save_path, dpi=1080)
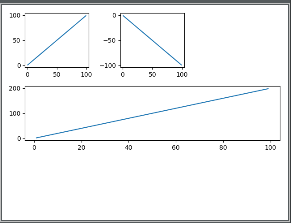
现在效果: