替代Excel三维地图依据经纬度坐标的绘制热力地图的方式
- 背景
- pyecharts绘制
背景
由于某人访问了某地,即便是调整电脑中的区域为别的国家或者地区时候,excel三维地图选择时候依然会弹出很抱歉,三维地图当前不在你的国家/地区使用。这个“当前”不知道要持续多久,所以需要找到一个方式替代excel进行三维地图的绘制。

pyecharts绘制
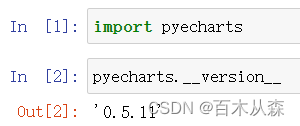
需要版本在0.5x,而不是最新版的1.x版本
使用的测试数据集为:
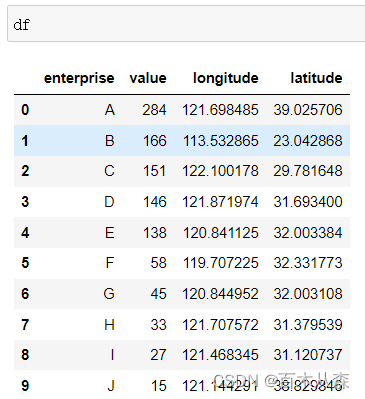
绘制地图的代码如下
from pyecharts import Geo, Stylestyle = Style(title_color= "#fff",title_pos = "center",width = 1200,height = 600,background_color = "#404a59")
geo_cities_coords={df.iloc[i]['enterprise']:[df.iloc[i]['longitude'],df.iloc[i]['latitude']] for i in range(len(df))} #根据文件大小生成字典
attr=list(df['enterprise'])
values=list(df['value'])
piece=[
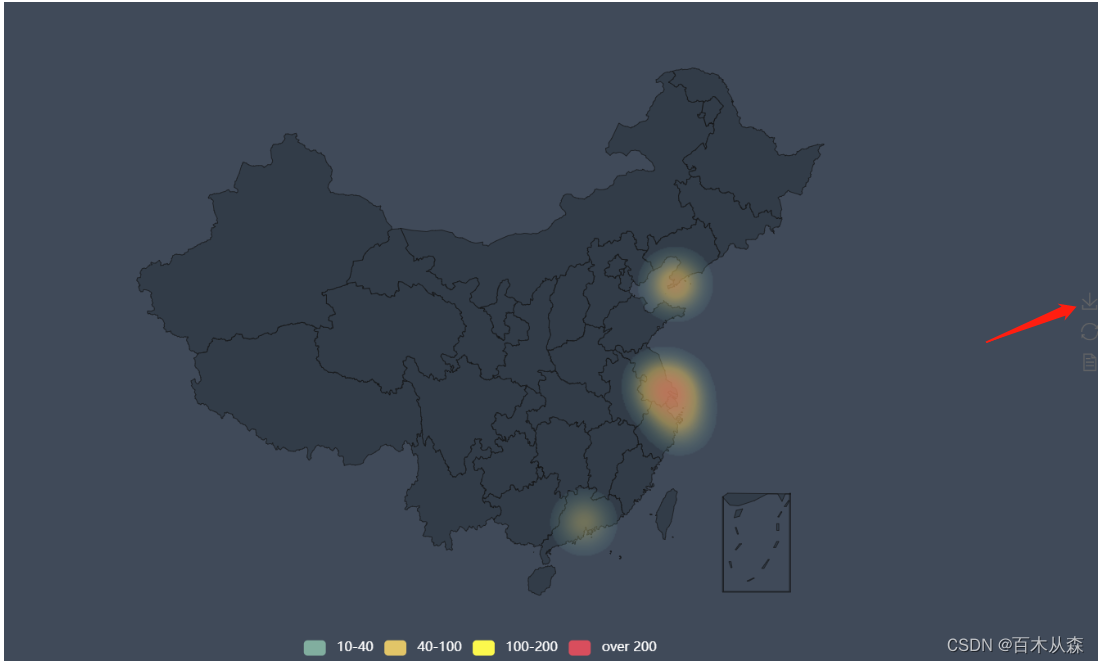
# {'max': 5,'label': '5以下','color':'#50A3BA'}, #有上限无下限,label和color自定义{'min': 10, 'max': 40,'label': '10-40','color':'#81AE9F'},{'min': 40, 'max': 100,'label': '40-100','color':'#E2C568'},{'min': 100, 'max': 200,'label': '100-200','color':'#FCF84D'},{'min': 200, 'label': 'over 200','color':'#D94E5D'}#有下限无上限
]
geo = Geo(**style.init_style)
geo.add("",attr=attr,value=values,symbol_size= 5,visual_text_color= "#fff",is_piecewise = True,type='heatmap',is_visualmap= True,maptype = 'china',visual_orient="horizontal",visual_range_text=["", ""],pieces=piece, #注意,要想pieces生效,必须is_piecewise = True,visual_pos="center",geo_cities_coords=geo_cities_coords)
geo
输出的图形文件如下:右侧有下载按钮,可以点击下载图形也可以直接截图保存本地