想给服务添加一个监控,看看网上各位前辈的,基本都是基于springboot1.x的,springboot升级到2.0以后和1.x还是有很多不一样的,那么2.0以后怎么使用admin监控呢?
先看下图的managment.security.enable,现在已经是过时API了,那么我们必须要更新知识库了。

总体思路
和之前的思路一样,分为服务端和客户端。
服务端配置pom
客户端添加监控url配置
server端
1、创建项目,引入依赖,我的完整pom如下
<dependencies><!--表示为web工程--><dependency><groupId>org.springframework.boot</groupId><artifactId>spring-boot-starter-web</artifactId></dependency><!--暴露各种指标--><dependency><groupId>org.springframework.boot</groupId><artifactId>spring-boot-starter-actuator</artifactId></dependency><dependency><groupId>org.springframework.cloud</groupId><artifactId>spring-cloud-starter-netflix-eureka-server</artifactId></dependency><dependency><groupId>de.codecentric</groupId><artifactId>spring-boot-admin-server</artifactId></dependency><dependency><groupId>de.codecentric</groupId><artifactId>spring-boot-admin-server-ui</artifactId></dependency><dependency><groupId>org.springframework.boot</groupId><artifactId>spring-boot-starter-webflux</artifactId></dependency><dependency><groupId>org.jolokia</groupId><artifactId>jolokia-core</artifactId></dependency><dependency><groupId>org.springframework.boot</groupId><artifactId>spring-boot-starter-actuator</artifactId></dependency><dependency><groupId>junit</groupId><artifactId>junit</artifactId><version>4.11</version><scope>test</scope></dependency></dependencies>2、配置yml
server:port: 8888
eureka:instance:hostname: localhostprefer-ip-address: truelease-renewal-interval-in-seconds: 10client:registry-fetch-interval-seconds: 5registerWithEureka: falsefetchRegistry: falseserviceUrl:defaultZone: http://localhost:8761/eureka/
management:endpoints:web:exposure:include: "*"endpoint:health:show-details: always
spring:application:name: spring-boot-admin-server
3、启用服务监控
@Configuration
@EnableAutoConfiguration
@EnableAdminServer
public class ActuatorApplication {public static void main(String[] args) {SpringApplication.run(ActuatorApplication.class, args);}
}
client端
在需要监控的项目中添加以下配置
1、添加pom依赖
<dependency><groupId>de.codecentric</groupId><artifactId>spring-boot-admin-starter-client</artifactId></dependency><dependency><groupId>org.springframework.boot</groupId><artifactId>spring-boot-starter-actuator</artifactId></dependency><dependency><groupId>org.jolokia</groupId><artifactId>jolokia-core</artifactId></dependency>2、添加yml配置
spring:application:name: boot-serviceboot:admin:client:url: http://localhost:8888查看监控
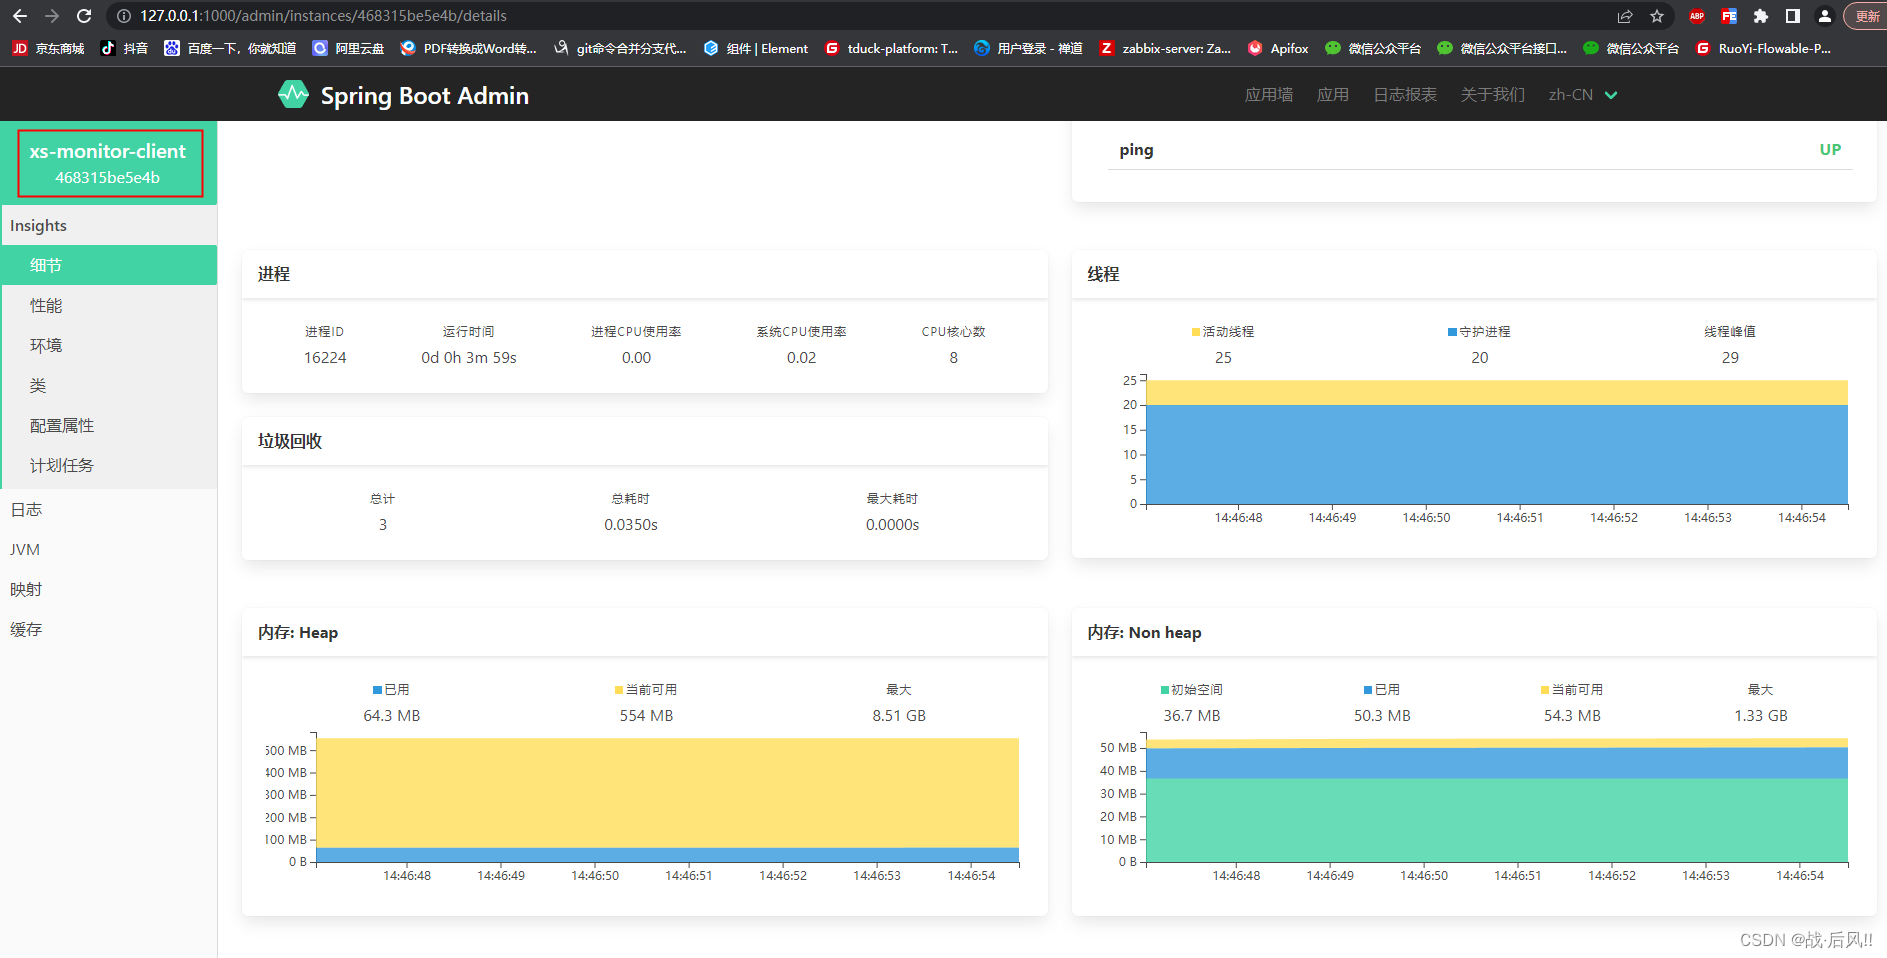
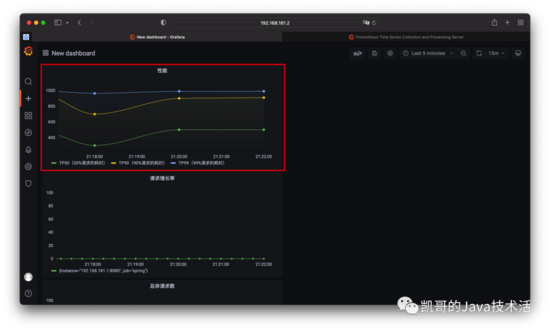
先启动刚才创建的服务监控项目,然后再分别启动需要监控的项目,然后访问http://localhost:8888(根据你的实际情况),访问结果如下

一眼就看到一个不正常的服务,我们点进去看一下出了什么问题,因为我的服务确实在正常运行,可以正常访问

结果就很明显了,一看network error,明显是网络不通,可是服务在正常运行,那么基本就是权限的问题了,因为我的eboot-admin添加了shiro的权限拦截,因此上面的/actuator/**都被拦截了,我们在shiro中将该路径放行
filterChainDefinitionMap.put("/actuator/**", "anon");再次访问,结果如下


服务出现问题,applications会有如下提示,一看offline就······

至此,springboot2.0的服务监控已经搞定。同时actuator也可以配合security做权限控制,但是我们监控的这些服务大部分可能都是在内网环境使用,后期我会加上带权限的监控,所有源码已上传到gitee,【戳我获取源码】,后期新增功能和代码会随时上传,需要的小伙伴随时获取哦
当然,如果能帮我点个star就更好了\^_\^