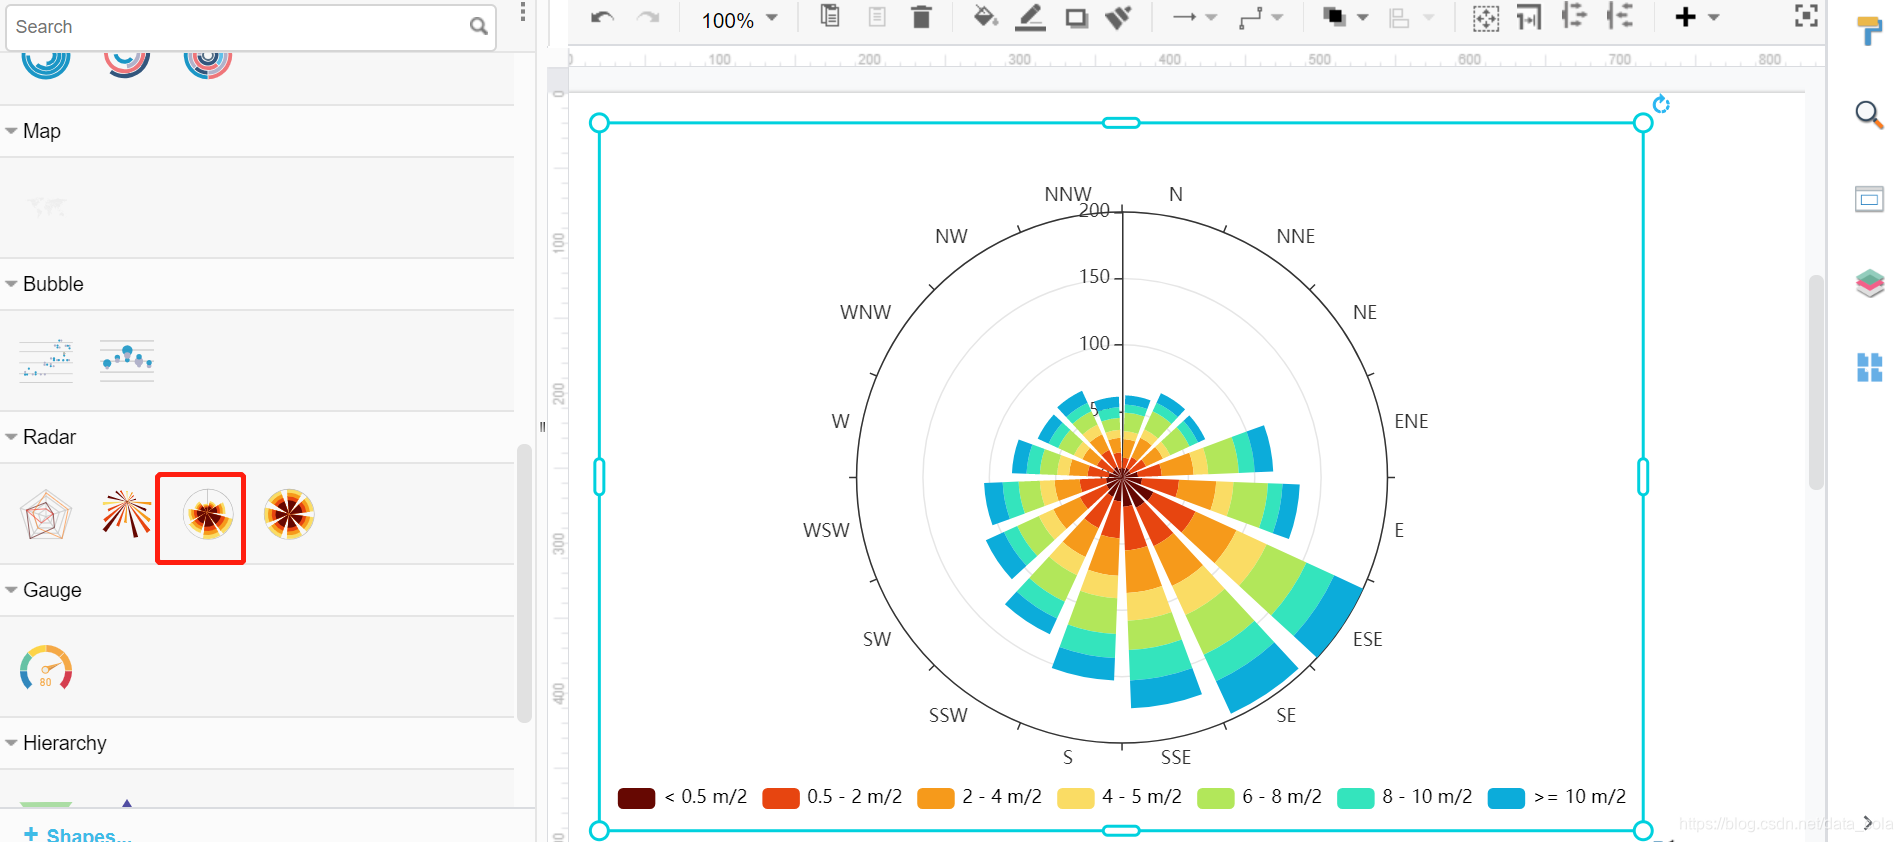
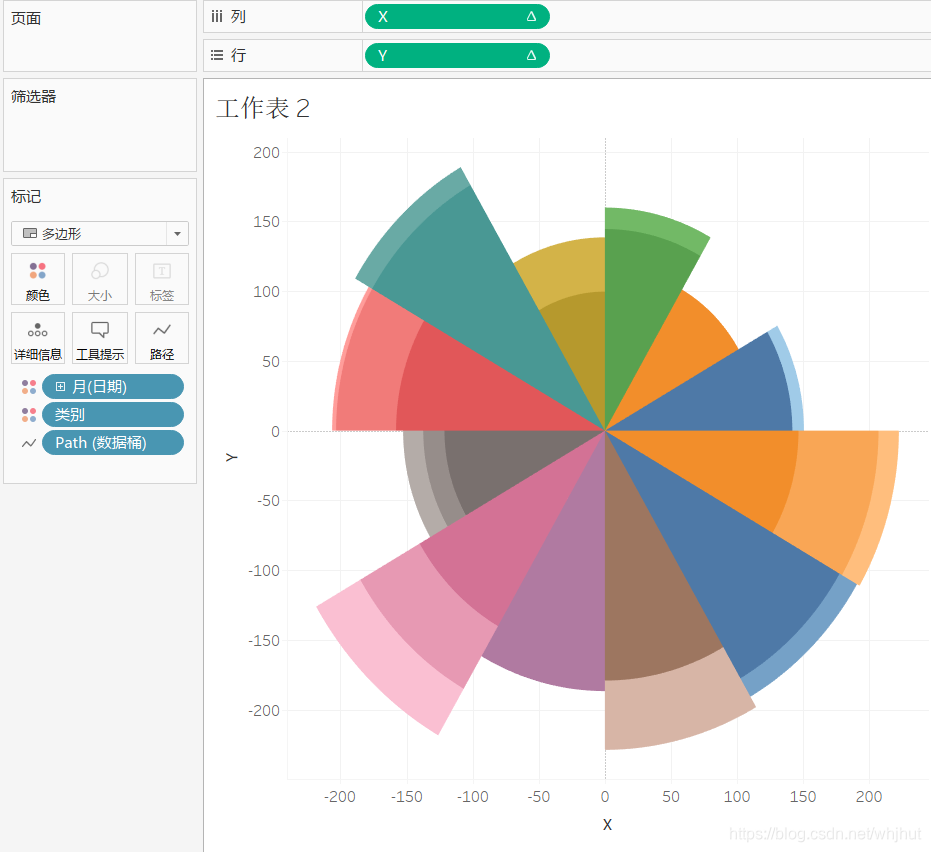
具体实现的效果图:
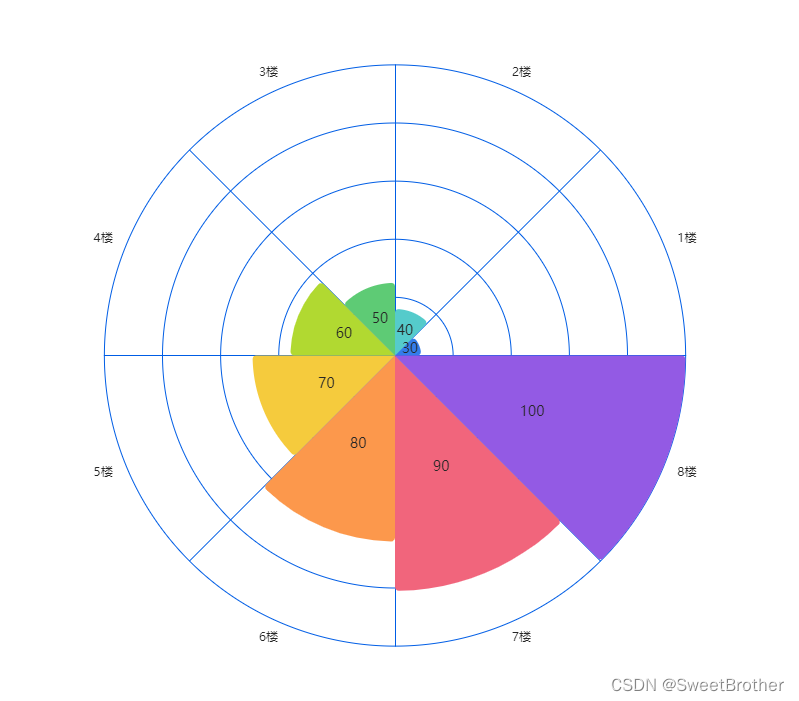
使用的图表插件是echarts,具体的完整代码如下:
import * as echarts from 'echarts';var chartDom = document.getElementById('main');
var myChart = echarts.init(chartDom);
var option;var arr = [{ name: '1楼', value: 30 },{ name: '2楼', value: 40 },{ name: '3楼', value: 50 },{ name: '4楼', value: 60 },{ name: '5楼', value: 70 },{ name: '6楼', value: 80 },{ name: '7楼', value: 90 },{ name: '8楼', value: 100 }
];
var dataArr = arr.map((e, index) => {return {value: e.value,score: 100,name: e.name,itemStyle: { opacity: 0 },label: { show: false },status: index,index: index};
});
var series = [];
arr.forEach((e, index) => {var newArr = JSON.parse(JSON.stringify(dataArr));newArr[index].itemStyle.opacity = 1;newArr[index].label.show = true;series.push({type: 'pie',data: newArr,radius: [0, (e.value / 100) * 75 + '%'], //预警环(红)startAngle: 0,roseType: 'area',clockwise: false,avoidLabelOverlap: true,itemStyle: {borderRadius: 4,borderWidth: 2},//   hoverAnimation: false,label: {fontSize: 14,// edgeDistance:'15%',show: true, // 开启显示position: 'inside', // 在上方显示// 数值样式color: '#262626',formatter: '{c}'},emptyCircleStyle: {borderWidth: 0},minShowLabelAngle: 0.001,color: ['rgba(51,125,234,1)','rgba(85,203,203,1)','rgba(94,203,117,1)','rgba(177,217,49,1)','rgba(245,203,61,1)','rgba(252,152,76,1)','rgba(241,101,124,1)','rgba(147,90,228,1)','rgba(67,70,215,1)','rgba(26,61,108,1)','rgba(50, 197, 255, 1)','rgba(200, 109, 255, 1)','rgba(96, 136, 184, 1)','rgba(125, 149, 226, 1)','rgba(79, 160, 226, 1)','rgba(28, 215, 215, 1)']});
});
option = {radar: [{indicator: [{ max: 100, text: '1楼', color: '#262626' },{ max: 100, text: '2楼', color: '#262626' },{ max: 100, text: '3楼', color: '#262626' },{ max: 100, text: '4楼', color: '#262626' },{ max: 100, text: '5楼', color: '#262626' },{ max: 100, text: '6楼', color: '#262626' },{ max: 100, text: '7楼', color: '#262626' },{ max: 100, text: '8楼', color: '#262626' }],center: ['50%', '50%'],radius: [0, '75%'], //预警环(红)startAngle: 360 / arr.length / 2,splitNumber: 5,shape: 'circle',splitArea: {areaStyle: {color: ['#ffffff'],shadowBlur: 0}},axisLine: {show: false,lineStyle: {color: '#005DE5'}},axisName: {show: true},splitLine: {show: false,lineStyle: {color: '#005DE5'}},axisLabel: {show: false,hideOverlap: false,verticalAlign: 'middle'}},{indicator: [{ max: 100, text: '', color: '#262626' },{ max: 100, text: '', color: '#262626' },{ max: 100, text: '', color: '#262626' },{ max: 100, text: '', color: '#262626' },{ max: 100, text: '', color: '#262626' },{ max: 100, text: '', color: '#262626' },{ max: 100, text: '', color: '#262626' },{ max: 100, text: '', color: '#262626' }],center: ['50%', '50%'],radius: [0, '75%'], //预警环(红)startAngle: 0,splitNumber: 5,shape: 'circle',splitArea: {areaStyle: {color: ['#ffffff'],shadowBlur: 0}},axisLine: {lineStyle: {color: '#005DE5'}},axisName: {show: false},splitLine: {lineStyle: {color: '#005DE5'}},axisLabel: {hideOverlap: false,verticalAlign: 'middle'}}],toolbox: {show: true,feature: {mark: { show: true },dataView: { show: true, readOnly: false },restore: { show: true },saveAsImage: { show: true }}},series: series
};option && myChart.setOption(option);