通过Prometheus监控redis集群
一、promethus安装
下载地址:
https://github.com/prometheus/prometheus/releases
1、下载
wget https://github.com/prometheus/prometheus/releases/download/v2.32.1/prometheus-2.32.1.linux-amd64.tar.gz
2、安装、配置
tar -zxvf prometheus-2.32.1.linux-amd64.tar.gz -C /usr/local/
3、编写systemctl启动脚本
vim /usr/lib/systemd/system/prometheus.service
[Unit]
Description=Prometheus Node Exporter
After=network.target[Service]
ExecStart=/usr/local/prometheus-2.32.1.linux-amd64/prometheus --config.file=/usr/local/prometheus-2.32.1.linux-amd64/prometheus.yml --web.read-timeout=5m  --web.max-connections=10 --storage.tsdb.retention=15d --storage.tsdb.path=/usr/local/prometheus-2.32.1.linux-amd64/data --query.max-concurrency=20 --query.timeout=2m
User=root
[Install]
WantedBy=multi-user.target
启动参数说明:
–config.file=/etc/prometheus.yml 指定配置文件–web.read-timeout=5m 请求链接的最大等待时间,防止太多的空闲链接占用资源–web.max-connections=512 针对prometheus,获取数据源的时候,建立的网络链接数,做一个最大数字的限制,防止链接数过多造成资源过大的消耗–storage.tsdb.retention=15d 重要参数,prometheus 开始采集监控数据后,会存在内存和硬盘中;对于保存期限的设置。时间过长,硬盘和内存都吃不消;时间太短,要查历史数据就没了。企业15天最为合适。–storage.tsdb.path="/prometheus/data" 存储数据路径,不要随便定义–query.max-concurrency=20 用户查询最大并发数–query.timeout=2m 慢查询强制终止4、启动
# 重载配置
systemctl daemon-reload#设置开机自启动
systemctl enable prometheus#启动
systemctl start prometheus查看启动状态
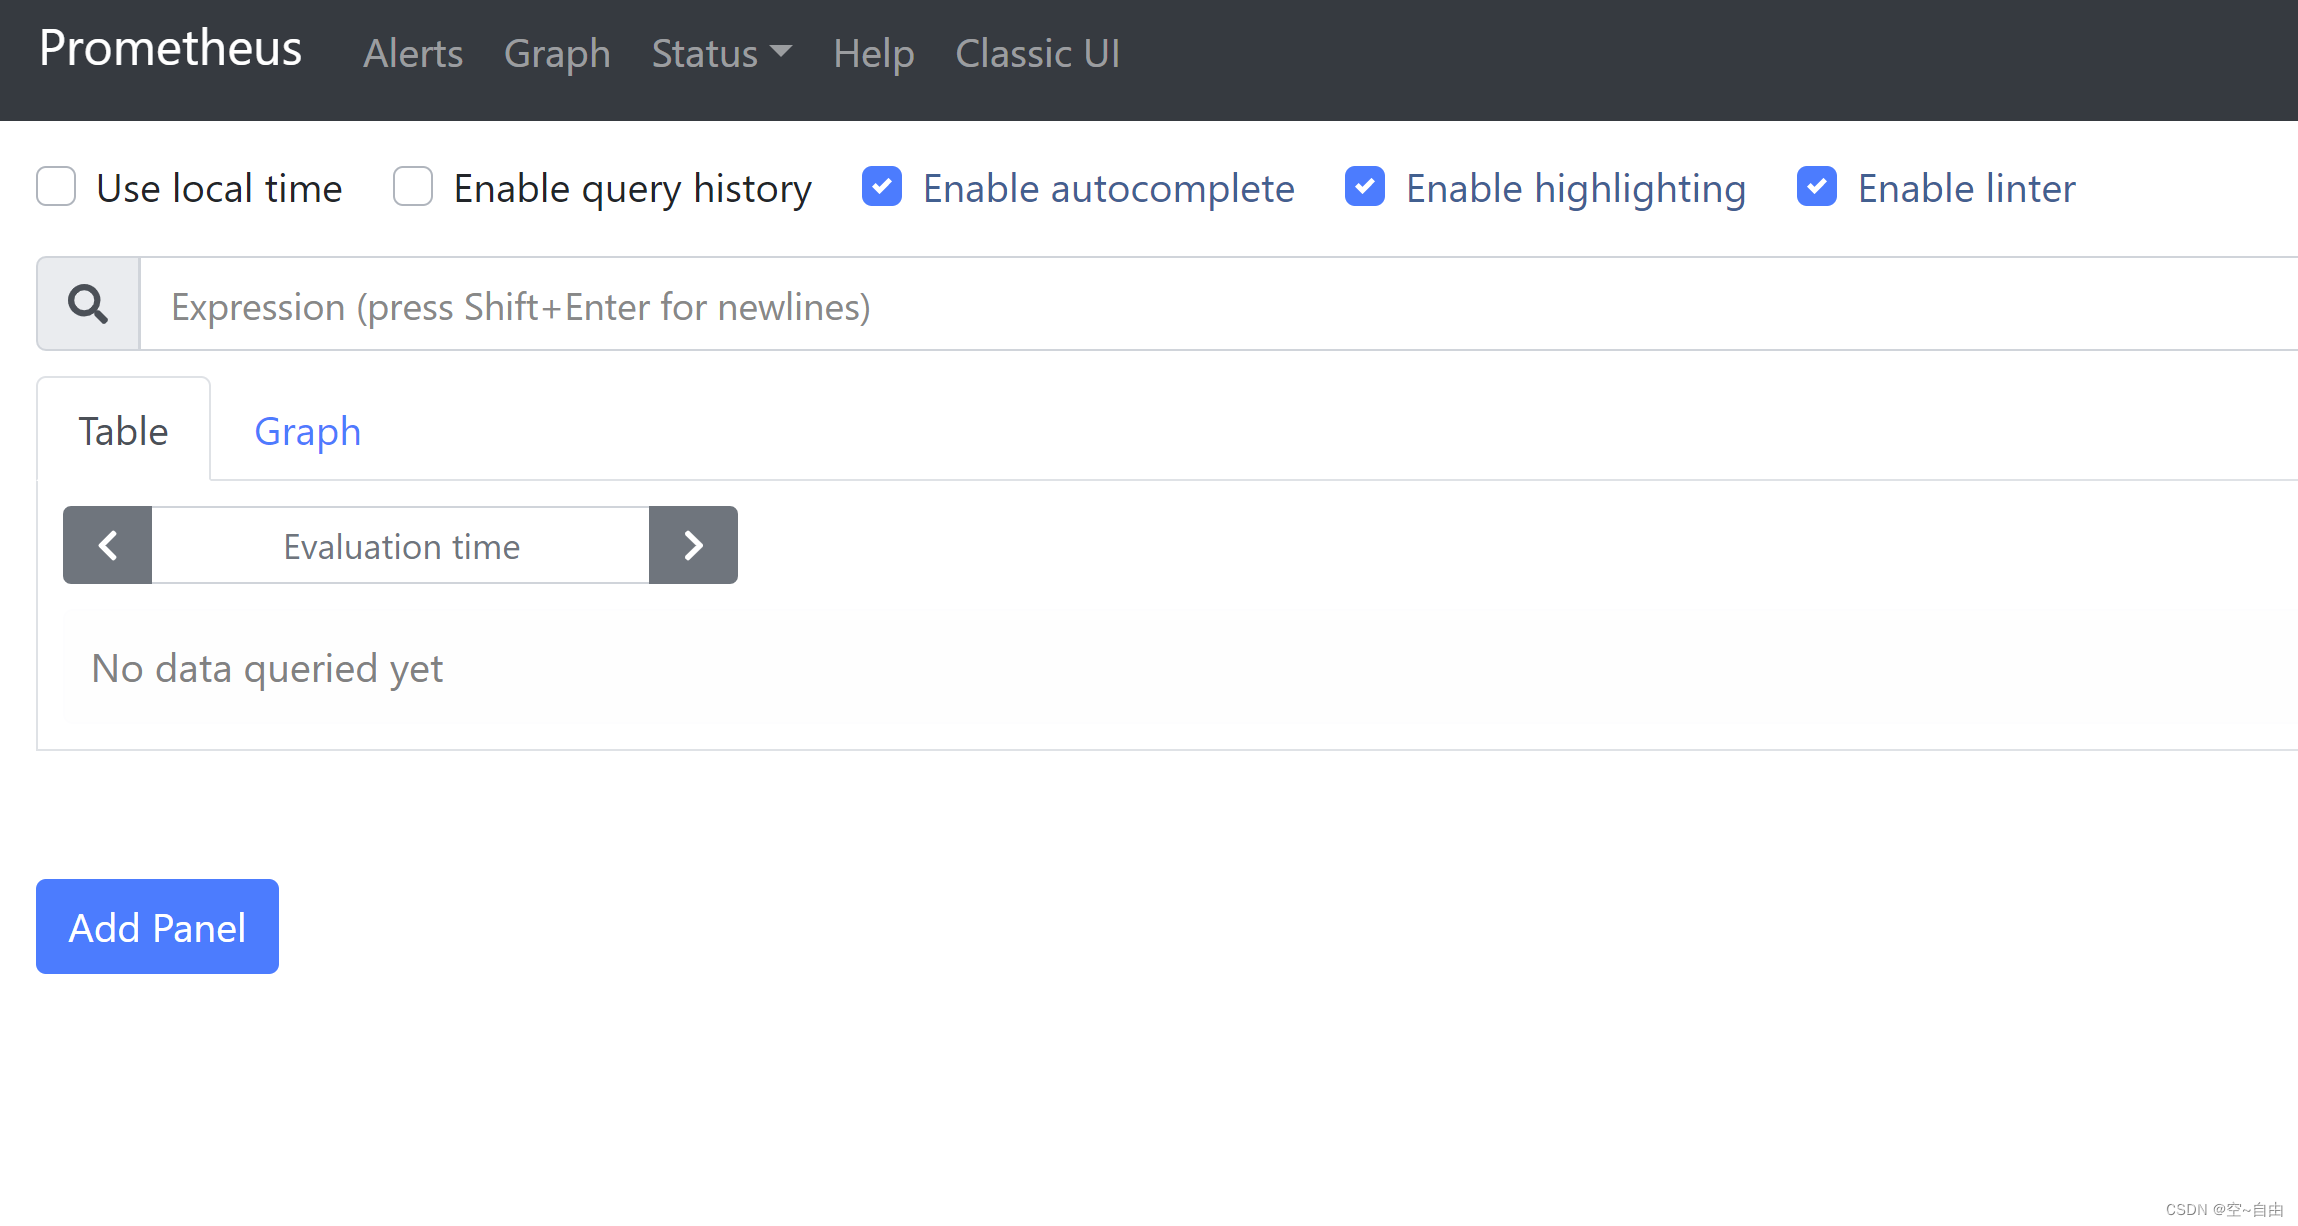
systemctl status prometheusPrometheus内置了一个web界面,我们可通过http://ip:9090进行访问
二 、搭建redis_exporter
1、下载https://github.com/oliver006/redis_exporter/releases/download/v1.39.0/redis_exporter-v1.39.0.linux-amd64.tar.gz
2、解压
tar -zxvf redis_exporter-v1.39.0.linux-amd64.tar.gz -C /usr/local/
3、创建启动脚本
cd /usr/local/redis_exporter-v1.39.0.linux-amd64
mkdir bin
cd bin
vim start.sh
#!/bin/bash
workhome=$(cd $(dirname $0)/../; pwd)
nohup ${workhome}/redis_exporter -redis.password pwd888 -web.listen-address 0.0.0.0:9122 &
chmod 777 start.sh
4、启动服务
/usr/local/redis_exporter-v1.39.0.linux-amd64/bin/start.sh
5、在prometheus.yml中加入job
vim /usr/local/prometheus-2.32.1.linux-amd64/prometheus.yml ,添加如下信息
- job_name: 'redis_exporter_targets'static_configs:- targets:- redis://localhost:9001- redis://localhost:9002- redis://localhost:9003- redis://localhost:9004- redis://localhost:9005- redis://localhost:9006params:check-keys: ["metrics:*"]metrics_path: /scraperelabel_configs:- source_labels: [__address__]target_label: __param_target- source_labels: [__param_target]target_label: instance- target_label: __address__replacement: 172.128.81.16:9122- job_name: 'redis_exporter'static_configs:- targets:- 172.128.81.16:9122
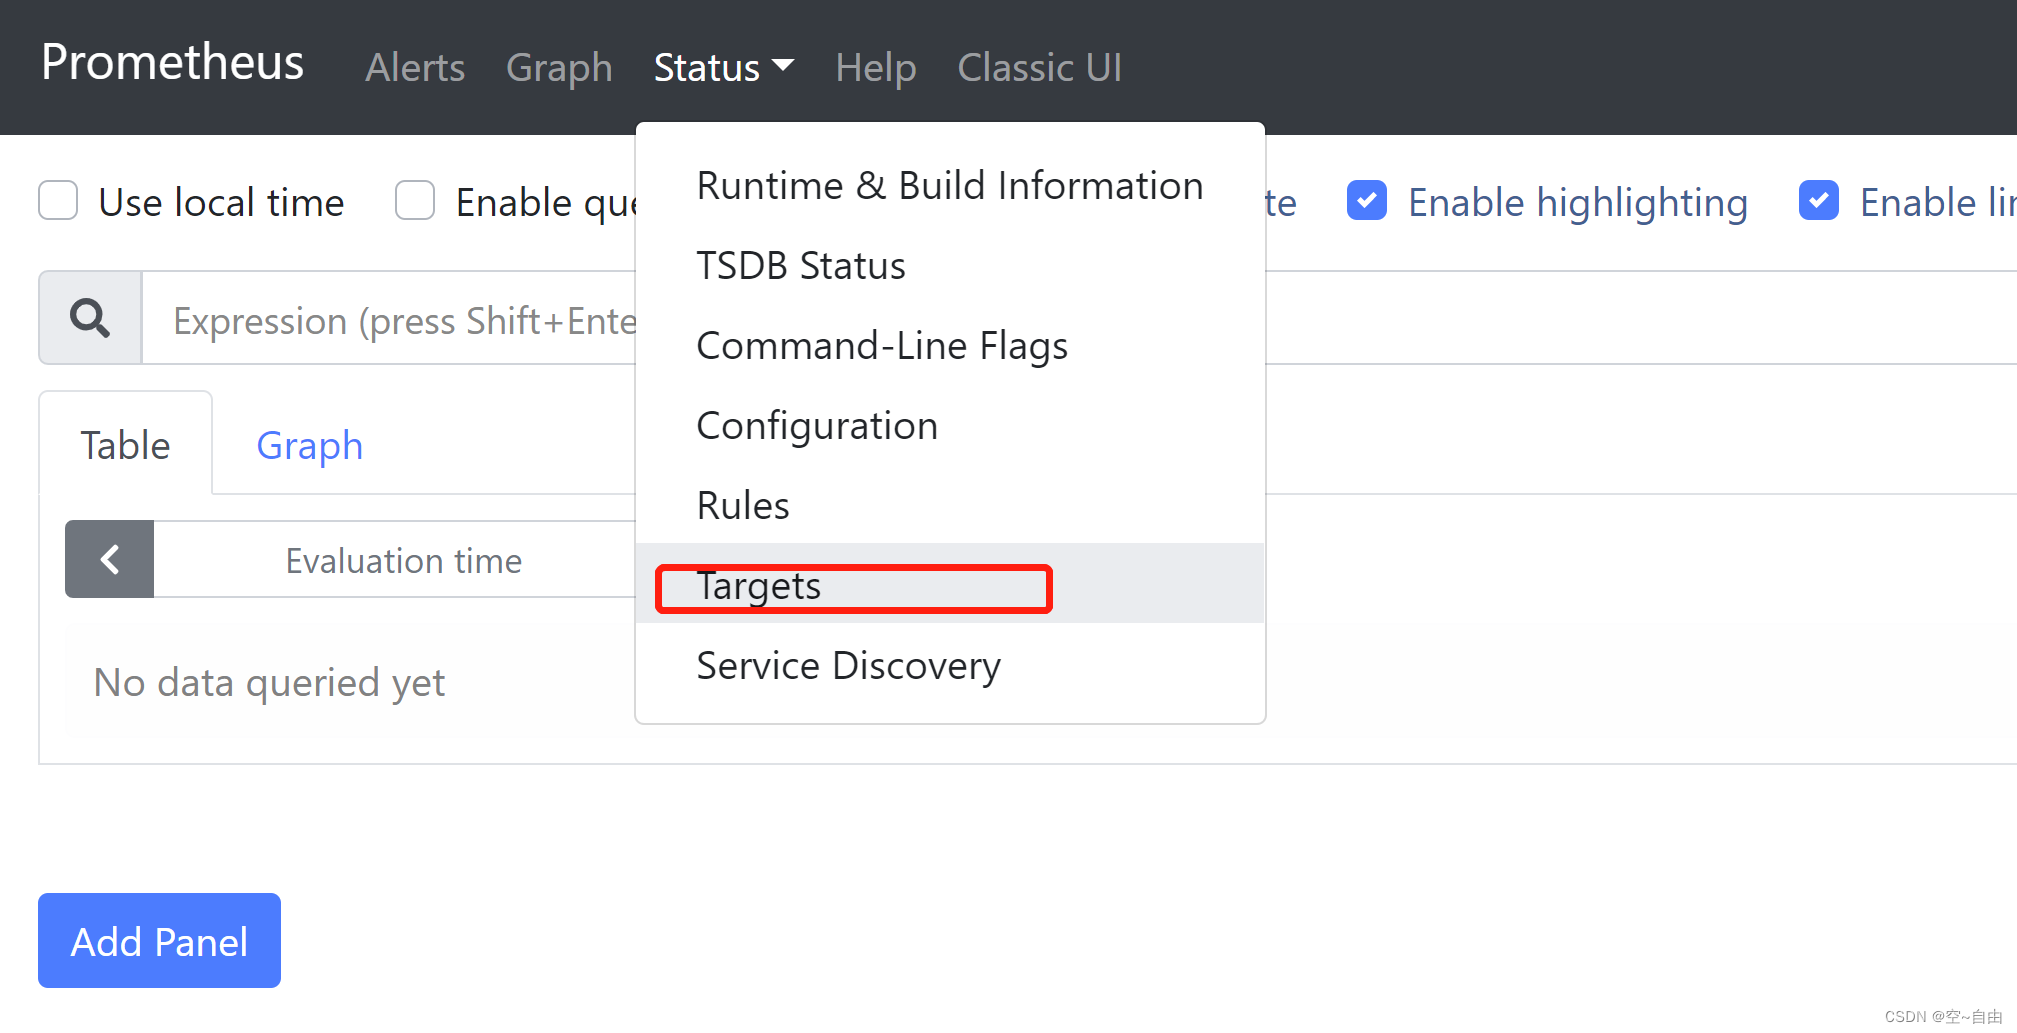
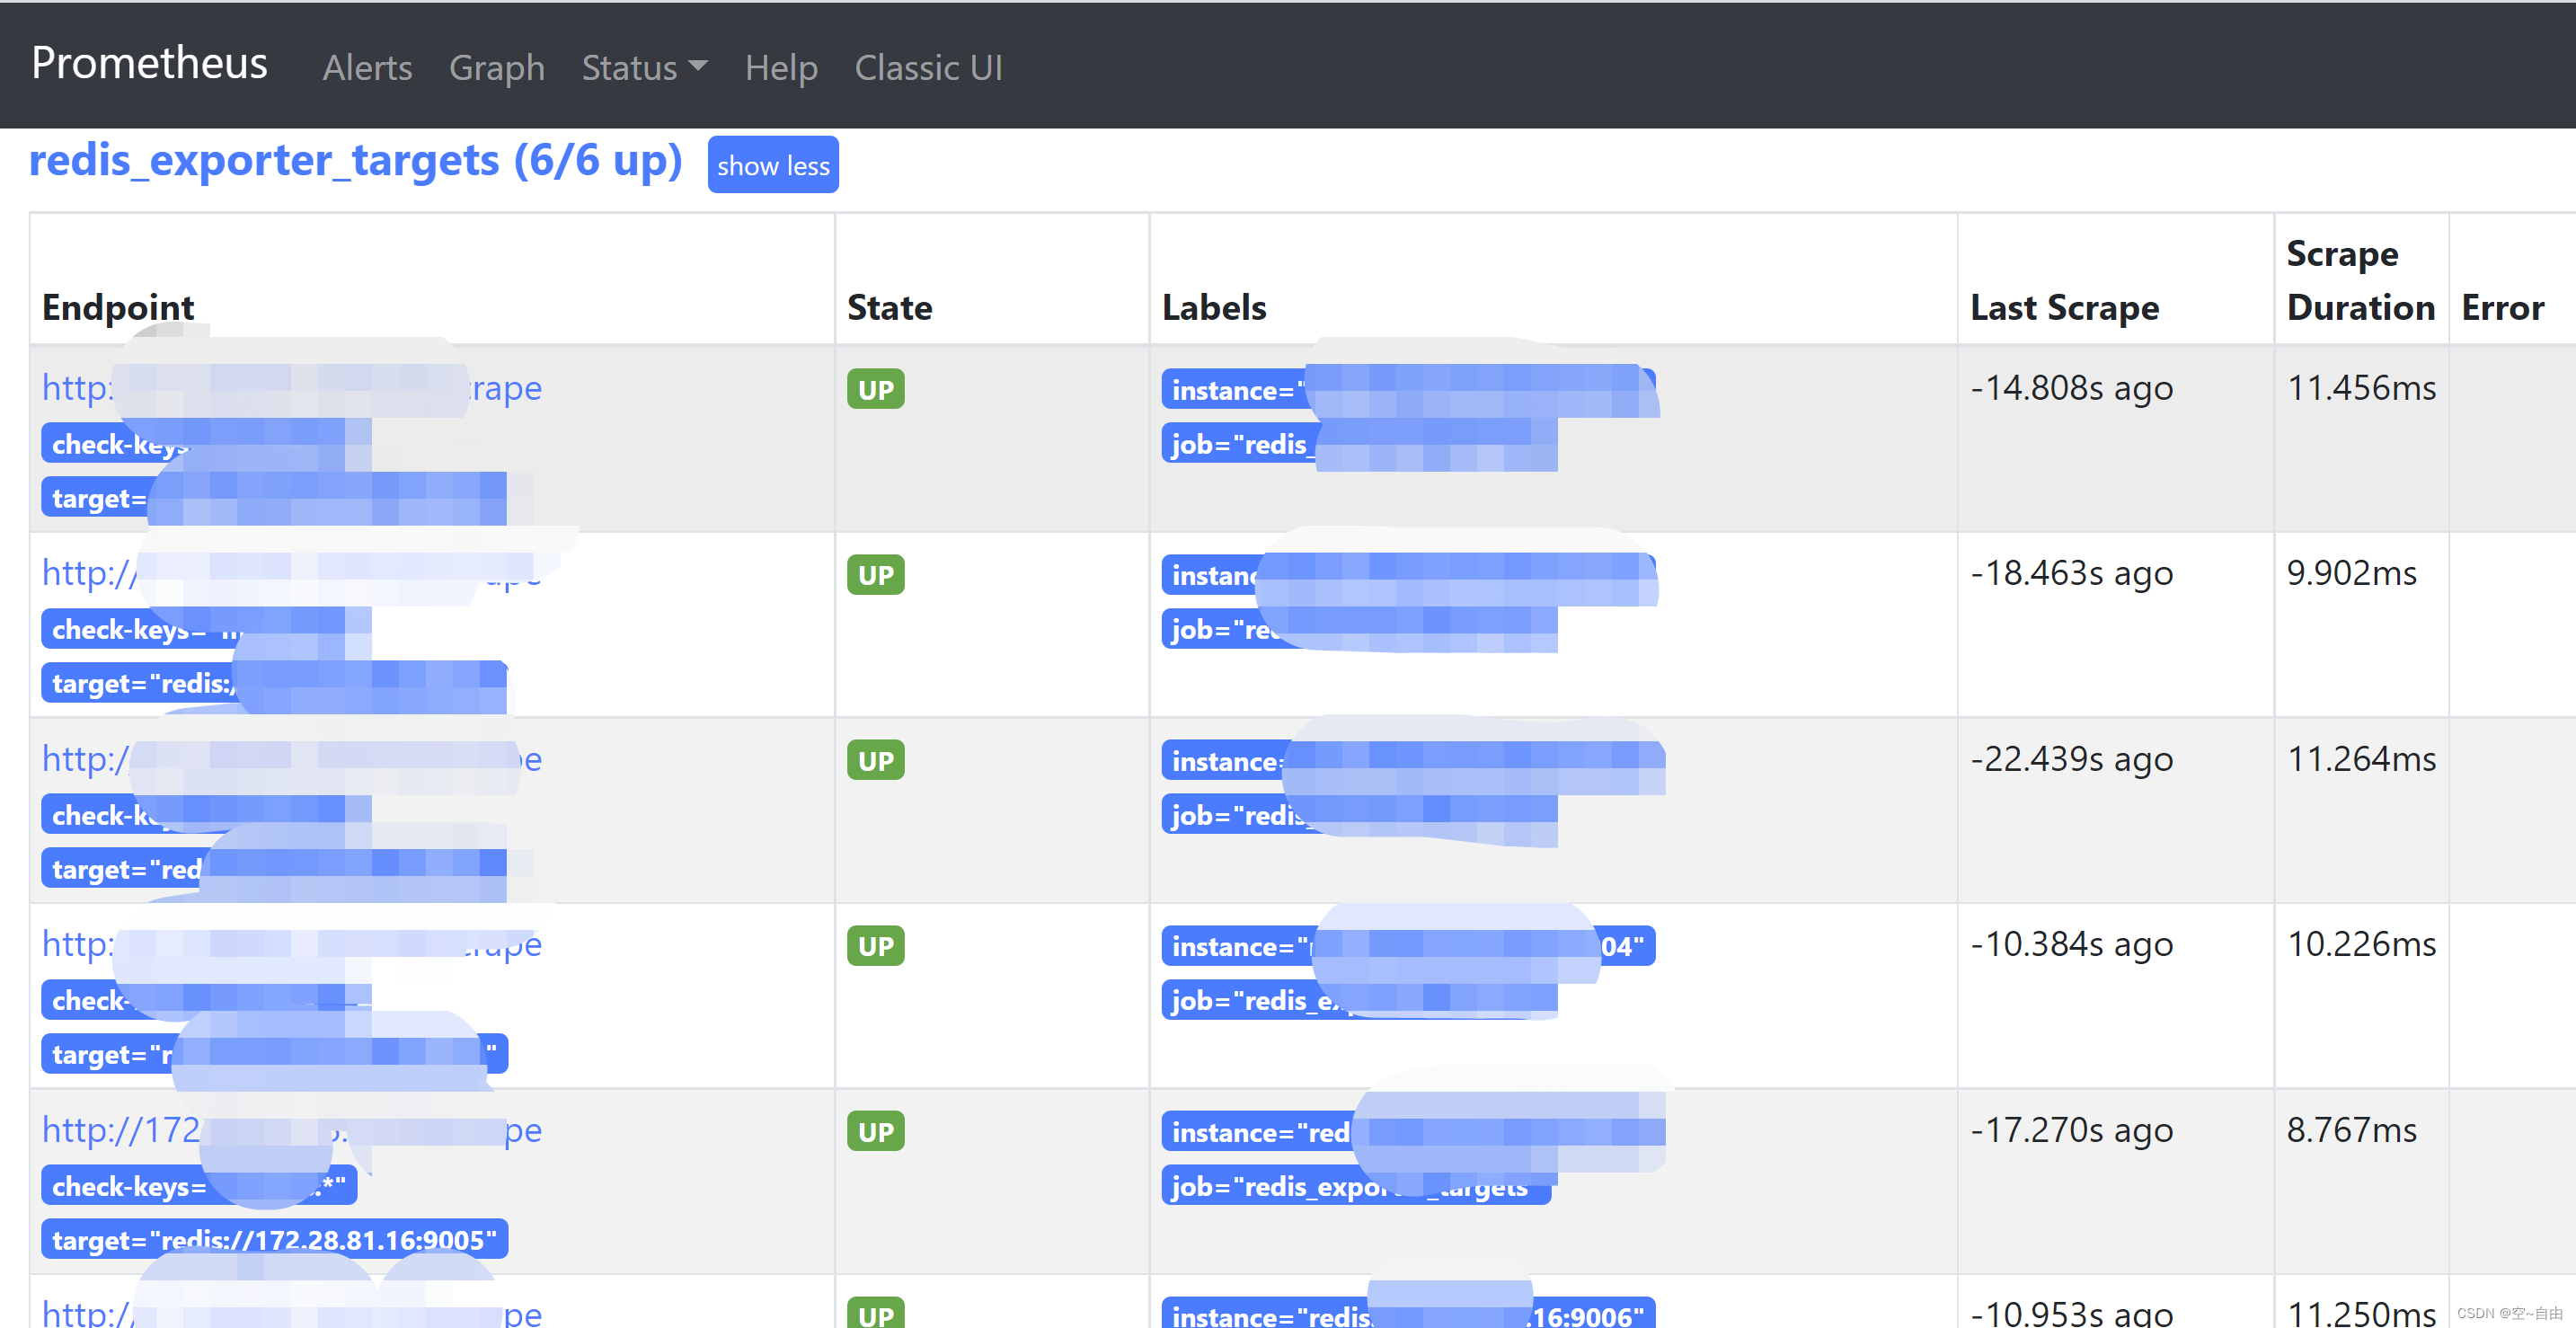
重启后,可以看到redis集群的状态均为UP
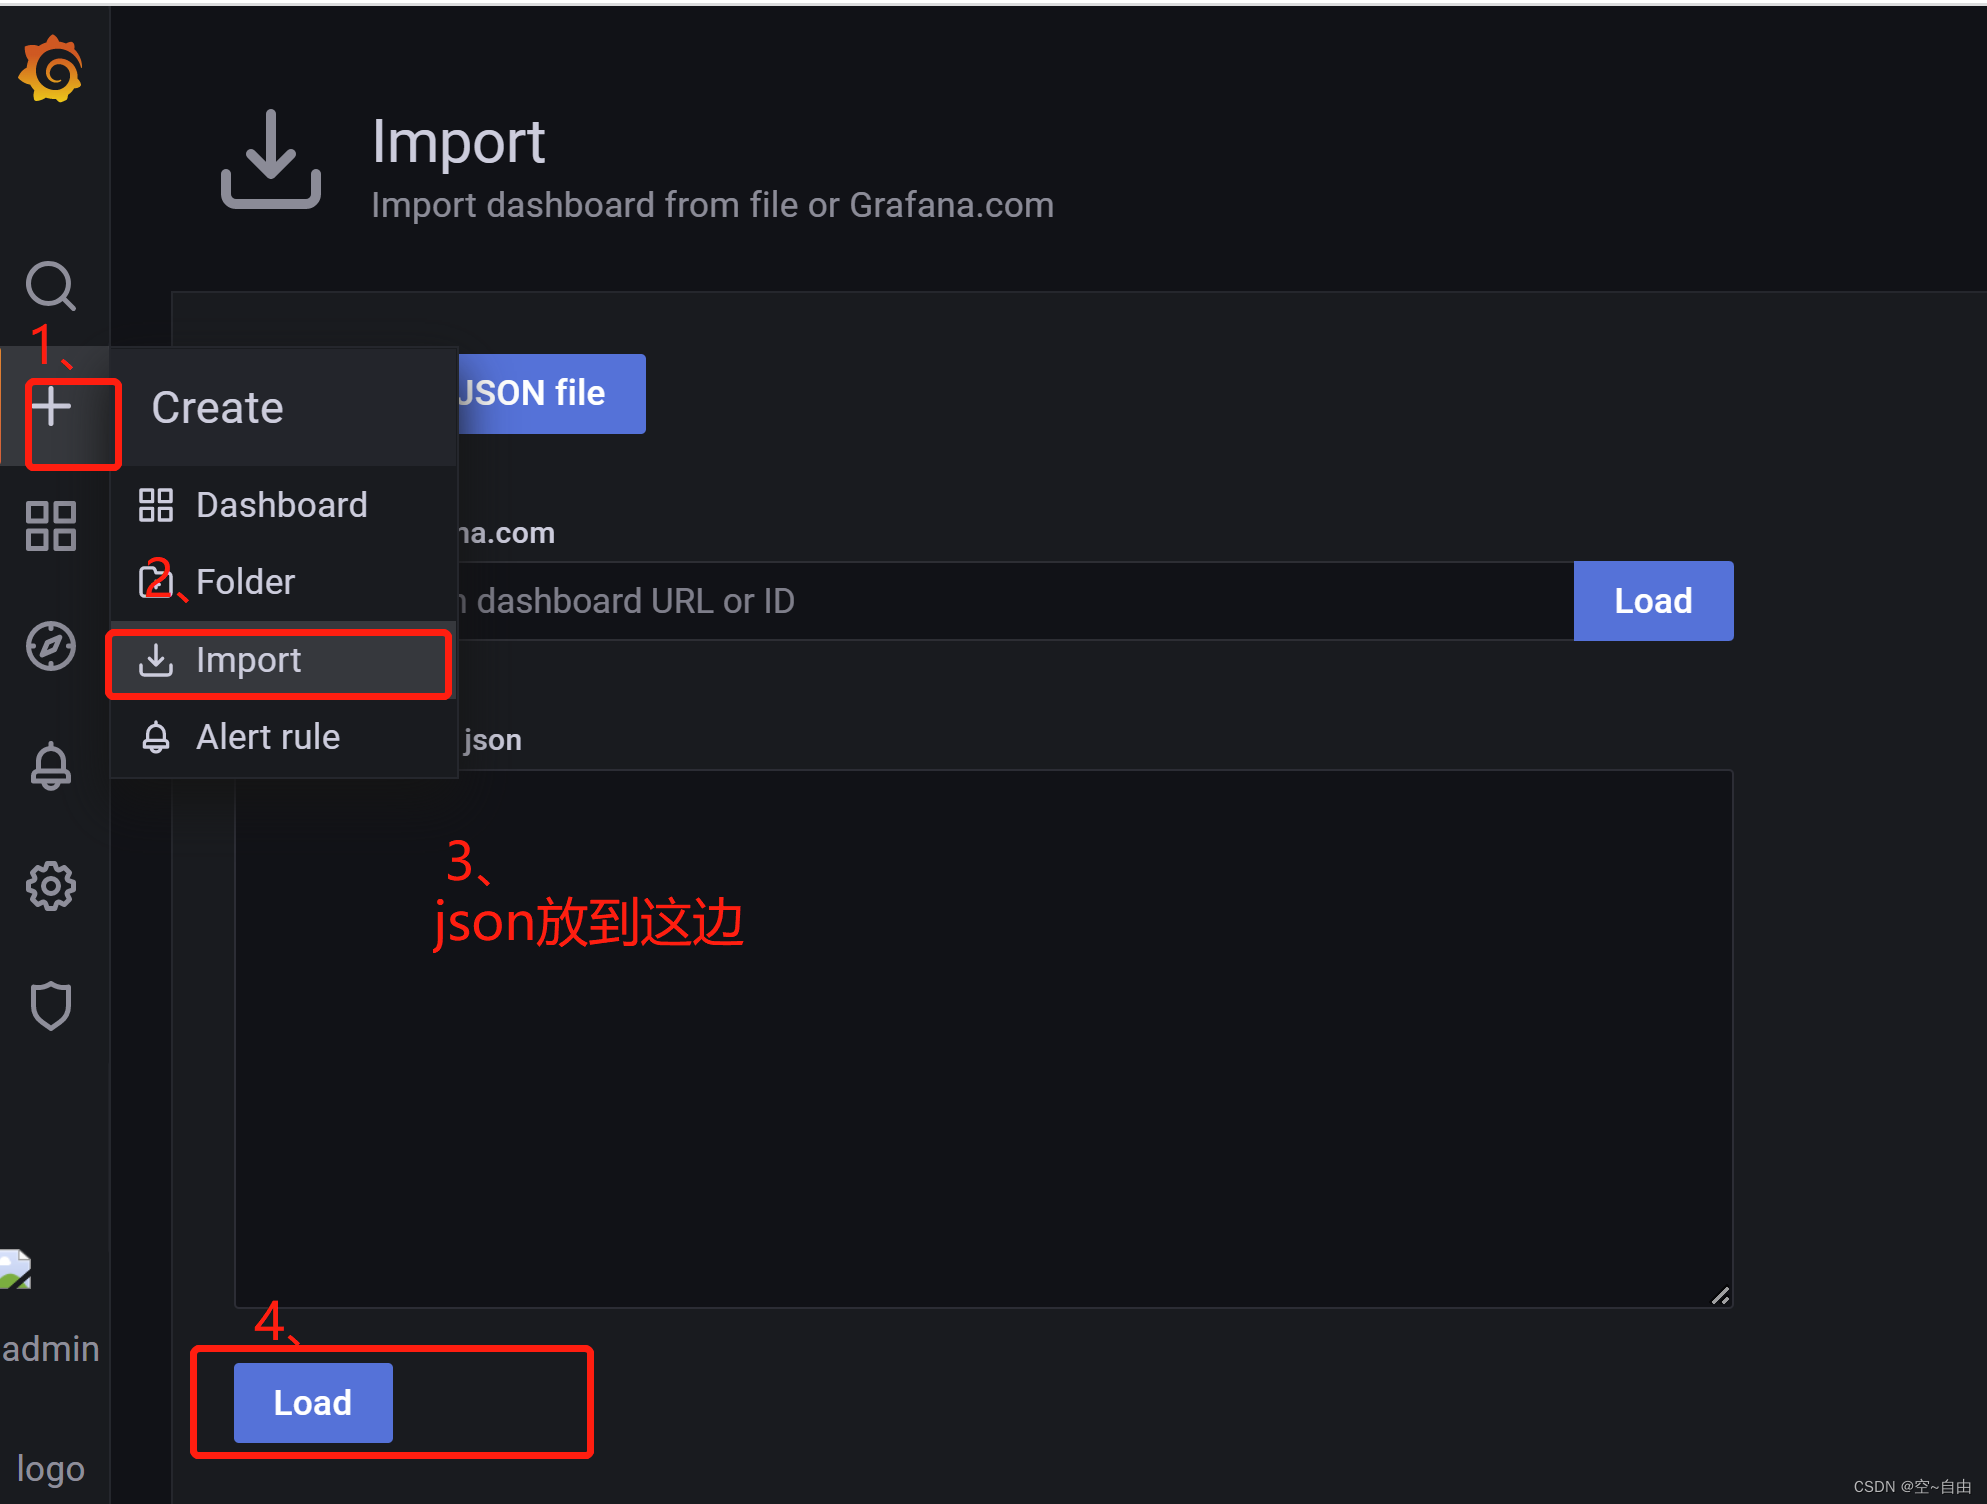
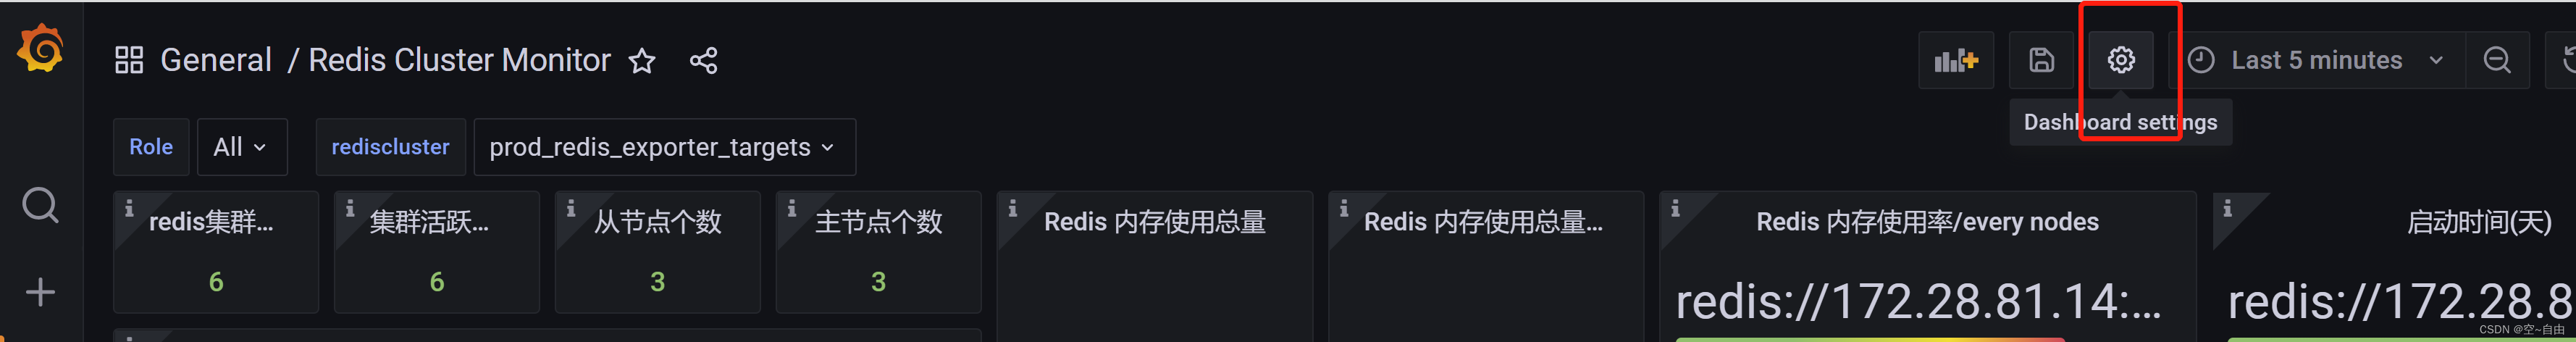
如果有安装granfana的,可以通过grafana对应的redis模板监控
使用如下模板
{ "annotations": { "list": [ { "builtIn": 1, "datasource": "-- Grafana --", "enable": true, "hide": true, "iconColor": "rgba(0, 211, 255, 1)", "name": "Annotations & Alerts", "type": "dashboard" } ] }, "editable": true, "gnetId": null, "graphTooltip": 0, "id": 12, "iteration": 1597660467403, "links": [], "panels": [ { "cacheTimeout": null, "colorBackground": false, "colorValue": true, "colors": [ "#299c46", "rgba(237, 129, 40, 0.89)", "#d44a3a" ], "datasource": null, "description": "redis集群节点数", "fieldConfig": { "defaults": { "custom": {} }, "overrides": [] }, "format": "none", "gauge": { "maxValue": 100, "minValue": 0, "show": false, "thresholdLabels": false, "thresholdMarkers": true }, "gridPos": { "h": 2, "w": 2, "x": 0, "y": 0 }, "id": 36, "interval": null, "links": [], "mappingType": 1, "mappingTypes": [ { "name": "value to text", "value": 1 }, { "name": "range to text", "value": 2 } ], "maxDataPoints": 100, "nullPointMode": "connected", "nullText": null, "postfix": "", "postfixFontSize": "50%", "prefix": "", "prefixFontSize": "50%", "rangeMaps": [ { "from": "null", "text": "N/A", "to": "null" } ], "sparkline": { "fillColor": "rgba(31, 118, 189, 0.18)", "full": false, "lineColor": "rgb(31, 120, 193)", "show": false, "ymax": null, "ymin": null }, "tableColumn": "", "targets": [ { "expr": "count(redis_instance_info{job=~\"$rediscluster\"})", "interval": "", "legendFormat": "", "refId": "A" } ], "thresholds": "", "timeFrom": null, "timeShift": null, "title": "redis集群节点数", "type": "singlestat", "valueFontSize": "100%", "valueMaps": [ { "op": "=", "text": "N/A", "value": "null" } ], "valueName": "current" }, { "cacheTimeout": null, "colorBackground": false, "colorValue": true, "colors": [ "#299c46", "rgba(237, 129, 40, 0.89)", "#d44a3a" ], "datasource": null, "description": "集群活跃节点数量", "fieldConfig": { "defaults": { "custom": {} }, "overrides": [] }, "format": "none", "gauge": { "maxValue": 100, "minValue": 0, "show": false, "thresholdLabels": false, "thresholdMarkers": true }, "gridPos": { "h": 2, "w": 2, "x": 2, "y": 0 }, "id": 37, "interval": null, "links": [], "mappingType": 1, "mappingTypes": [ { "name": "value to text", "value": 1 }, { "name": "range to text", "value": 2 } ], "maxDataPoints": 100, "nullPointMode": "connected", "nullText": null, "postfix": "", "postfixFontSize": "50%", "prefix": "", "prefixFontSize": "50%", "rangeMaps": [ { "from": "null", "text": "N/A", "to": "null" } ], "sparkline": { "fillColor": "rgba(31, 118, 189, 0.18)", "full": false, "lineColor": "rgb(31, 120, 193)", "show": false, "ymax": null, "ymin": null }, "tableColumn": "", "targets": [ { "expr": "count(redis_up{job=~\"$rediscluster\"}>0)", "interval": "", "legendFormat": "", "refId": "A" } ], "thresholds": "", "timeFrom": null, "timeShift": null, "title": "集群活跃节点数", "type": "singlestat", "valueFontSize": "100%", "valueMaps": [ { "op": "=", "text": "N/A", "value": "null" } ], "valueName": "current" }, { "cacheTimeout": null, "colorBackground": false, "colorValue": true, "colors": [ "#299c46", "rgba(237, 129, 40, 0.89)", "#d44a3a" ], "datasource": null, "description": "从节点数量", "fieldConfig": { "defaults": { "custom": {} }, "overrides": [] }, "format": "none", "gauge": { "maxValue": 100, "minValue": 0, "show": false, "thresholdLabels": false, "thresholdMarkers": true }, "gridPos": { "h": 2, "w": 2, "x": 4, "y": 0 }, "id": 12, "interval": null, "links": [], "mappingType": 1, "mappingTypes": [ { "name": "value to text", "value": 1 }, { "name": "range to text", "value": 2 } ], "maxDataPoints": 100, "nullPointMode": "connected", "nullText": null, "postfix": "", "postfixFontSize": "50%", "prefix": "", "prefixFontSize": "50%", "rangeMaps": [ { "from": "null", "text": "N/A", "to": "null" } ], "sparkline": { "fillColor": "rgba(31, 118, 189, 0.18)", "full": false, "lineColor": "rgb(31, 120, 193)", "show": false, "ymax": null, "ymin": null }, "tableColumn": "", "targets": [ { "expr": "count(redis_instance_info{job=~\"$rediscluster\", role=\"slave\"})", "interval": "", "legendFormat": "", "refId": "A" } ], "thresholds": "", "timeFrom": null, "timeShift": null, "title": "从节点个数", "type": "singlestat", "valueFontSize": "100%", "valueMaps": [ { "op": "=", "text": "N/A", "value": "null" } ], "valueName": "current" }, { "cacheTimeout": null, "colorBackground": false, "colorPrefix": false, "colorValue": true, "colors": [ "#299c46", "rgba(237, 129, 40, 0.89)", "#d44a3a" ], "datasource": null, "description": "主节点数量", "fieldConfig": { "defaults": { "custom": {} }, "overrides": [] }, "format": "none", "gauge": { "maxValue": 100, "minValue": 0, "show": false, "thresholdLabels": false, "thresholdMarkers": true }, "gridPos": { "h": 2, "w": 2, "x": 6, "y": 0 }, "id": 10, "interval": null, "links": [], "mappingType": 1, "mappingTypes": [ { "name": "value to text", "value": 1 }, { "name": "range to text", "value": 2 } ], "maxDataPoints": 100, "nullPointMode": "connected", "nullText": null, "postfix": "", "postfixFontSize": "50%", "prefix": "", "prefixFontSize": "50%", "rangeMaps": [ { "from": "null", "text": "N/A", "to": "null" } ], "sparkline": { "fillColor": "rgba(31, 118, 189, 0.18)", "full": false, "lineColor": "rgb(31, 120, 193)", "show": false, "ymax": null, "ymin": null }, "tableColumn": "", "targets": [ { "expr": "count(redis_instance_info{job=~\"$rediscluster\", role=\"master\"})", "interval": "", "legendFormat": "", "refId": "A" } ], "thresholds": "", "timeFrom": null, "timeShift": null, "title": "主节点个数", "type": "singlestat", "valueFontSize": "100%", "valueMaps": [ { "op": "=", "text": "N/A", "value": "null" } ], "valueName": "current" }, { "datasource": null, "description": "Redis 内存使用大小值", "fieldConfig": { "defaults": { "custom": {}, "links": [], "mappings": [], "thresholds": { "mode": "absolute", "steps": [ { "color": "green", "value": null } ] }, "unit": "decbytes" }, "overrides": [] }, "gridPos": { "h": 8, "w": 3, "x": 8, "y": 0 }, "id": 18, "options": { "colorMode": "value", "graphMode": "area", "justifyMode": "auto", "orientation": "auto", "reduceOptions": { "calcs": [ "mean" ], "fields": "", "values": false }, "textMode": "auto" }, "pluginVersion": "7.1.3", "targets": [ { "expr": "sum(redis_memory_used_bytes{job=~\"$rediscluster\"})", "interval": "5s", "legendFormat": "{{addr}}", "refId": "A" } ], "timeFrom": null, "timeShift": null, "title": "Redis 内存使用总量", "type": "stat" }, { "datasource": null, "description": "Redis 内存使用大小值", "fieldConfig": { "defaults": { "custom": {}, "links": [], "mappings": [], "thresholds": { "mode": "absolute", "steps": [ { "color": "green", "value": null }, { "color": "#EAB839", "value": 60 }, { "color": "red", "value": 80 } ] }, "unit": "percent" }, "overrides": [] }, "gridPos": { "h": 8, "w": 3, "x": 11, "y": 0 }, "id": 47, "options": { "orientation": "auto", "reduceOptions": { "calcs": [ "mean" ], "fields": "", "values": false }, "showThresholdLabels": false, "showThresholdMarkers": true }, "pluginVersion": "7.1.3", "targets": [ { "expr": "sum(redis_memory_used_bytes{job=~\"$rediscluster\"}) / sum(redis_config_maxmemory{job=~\"$rediscluster\"}) * 100", "interval": "5s", "legendFormat": "{{addr}}", "refId": "A" } ], "timeFrom": null, "timeShift": null, "title": "Redis 内存使用总量百分比", "type": "gauge" }, { "datasource": null, "description": "Redis 内存使用率", "fieldConfig": { "defaults": { "custom": { "align": null }, "links": [], "mappings": [], "max": 100, "thresholds": { "mode": "percentage", "steps": [ { "color": "green", "value": null }, { "color": "yellow", "value": 60 }, { "color": "red", "value": 80 } ] }, "unit": "percent" }, "overrides": [] }, "gridPos": { "h": 17, "w": 5, "x": 14, "y": 0 }, "id": 20, "maxPerRow": 4, "options": { "displayMode": "gradient", "orientation": "auto", "reduceOptions": { "calcs": [ "mean" ], "fields": "", "values": false }, "showUnfilled": true }, "pluginVersion": "7.1.3", "repeat": null, "repeatDirection": "h", "targets": [ { "expr": "(redis_memory_used_bytes{job=~\"$rediscluster\"} / redis_config_maxmemory{job=~\"$rediscluster\"}) * 100", "interval": "5s", "legendFormat": "{{instance}}", "refId": "A" } ], "timeFrom": null, "timeShift": null, "title": "Redis 内存使用率/every nodes", "type": "bargauge" }, { "cacheTimeout": null, "datasource": null, "description": "启动时间(天)", "fieldConfig": { "defaults": { "custom": { "align": null }, "mappings": [ { "id": 0, "op": "=", "text": "N/A", "type": 1, "value": "null" } ], "nullValueMode": "connected", "thresholds": { "mode": "absolute", "steps": [ { "color": "green", "value": null }, { "color": "#EAB839", "value": 365 } ] }, "unit": "short" }, "overrides": [] }, "gridPos": { "h": 17, "w": 5, "x": 19, "y": 0 }, "id": 42, "interval": null, "links": [], "maxDataPoints": 100, "options": { "displayMode": "gradient", "orientation": "horizontal", "reduceOptions": { "calcs": [ "lastNotNull" ], "fields": "", "values": false }, "showUnfilled": true }, "pluginVersion": "7.1.3", "targets": [ { "expr": "redis_uptime_in_seconds{job=~\"$rediscluster\"}/60/60/24", "interval": "", "legendFormat": "{{instance}}", "refId": "A" } ], "timeFrom": null, "timeShift": null, "title": "启动时间(天)", "transparent": true, "type": "bargauge" }, { "aliasColors": {}, "bars": false, "dashLength": 10, "dashes": false, "datasource": null, "description": "Redis 内存使用大小值", "fieldConfig": { "defaults": { "custom": {}, "links": [] }, "overrides": [] }, "fill": 1, "fillGradient": 0, "gridPos": { "h": 6, "w": 8, "x": 0, "y": 2 }, "hiddenSeries": false, "id": 39, "legend": { "alignAsTable": true, "avg": false, "current": true, "max": false, "min": false, "rightSide": true, "show": true, "sort": "current", "sortDesc": true, "total": false, "values": true }, "lines": true, "linewidth": 1, "nullPointMode": "null", "percentage": false, "pluginVersion": "7.1.3", "pointradius": 2, "points": false, "renderer": "flot", "seriesOverrides": [], "spaceLength": 10, "stack": false, "steppedLine": false, "targets": [ { "expr": "redis_memory_used_bytes{job=~\"$rediscluster\"} ", "interval": "5s", "legendFormat": "{{instance}}", "refId": "A" } ], "thresholds": [], "timeFrom": null, "timeRegions": [], "timeShift": null, "title": "已用内存/every nodes", "tooltip": { "shared": true, "sort": 0, "value_type": "individual" }, "type": "graph", "xaxis": { "buckets": null, "mode": "time", "name": null, "show": true, "values": [] }, "yaxes": [ { "format": "bytes", "label": null, "logBase": 1, "max": null, "min": null, "show": true }, { "decimals": null, "format": "short", "label": "", "logBase": 1, "max": null, "min": null, "show": true } ], "yaxis": { "align": false, "alignLevel": null } }, { "aliasColors": {}, "bars": false, "dashLength": 10, "dashes": false, "datasource": null, "description": "各个节点内存碎片率", "fieldConfig": { "defaults": { "custom": {}, "links": [] }, "overrides": [] }, "fill": 1, "fillGradient": 0, "gridPos": { "h": 9, "w": 6, "x": 0, "y": 8 }, "hiddenSeries": false, "id": 28, "legend": { "alignAsTable": true, "avg": false, "current": true, "max": false, "min": false, "rightSide": true, "show": true, "sort": "current", "sortDesc": true, "total": false, "values": true }, "lines": true, "linewidth": 1, "nullPointMode": "null", "percentage": false, "pluginVersion": "7.1.3", "pointradius": 2, "points": false, "renderer": "flot", "seriesOverrides": [], "spaceLength": 10, "stack": false, "steppedLine": false, "targets": [ { "expr": "redis_mem_fragmentation_ratio{job=~\"$rediscluster\"}", "interval": "", "legendFormat": "{{instance}}", "refId": "A" } ], "thresholds": [], "timeFrom": null, "timeRegions": [], "timeShift": null, "title": "内存碎片率/every nodes", "tooltip": { "shared": true, "sort": 0, "value_type": "individual" }, "type": "graph", "xaxis": { "buckets": null, "mode": "time", "name": null, "show": true, "values": [] }, "yaxes": [ { "format": "short", "label": null, "logBase": 1, "max": null, "min": null, "show": true }, { "format": "short", "label": null, "logBase": 1, "max": null, "min": null, "show": true } ], "yaxis": { "align": false, "alignLevel": null } }, { "datasource": null, "description": "各个节点内存碎片率", "fieldConfig": { "defaults": { "custom": { "align": null }, "links": [], "mappings": [], "thresholds": { "mode": "absolute", "steps": [ { "color": "green", "value": null }, { "color": "#EAB839", "value": 1 }, { "color": "red", "value": 5 } ] } }, "overrides": [] }, "gridPos": { "h": 9, "w": 8, "x": 6, "y": 8 }, "id": 50, "options": { "colorMode": "value", "graphMode": "area", "justifyMode": "auto", "orientation": "auto", "reduceOptions": { "calcs": [ "mean" ], "fields": "", "values": false }, "textMode": "auto" }, "pluginVersion": "7.1.3", "targets": [ { "expr": "delta(redis_slowlog_last_id{job=~\"$rediscluster\"}[5m]) ", "interval": "", "legendFormat": "{{instance}}", "refId": "A" } ], "timeFrom": null, "timeShift": null, "title": "每个节点慢日志 every 5min", "type": "stat" }, { "datasource": null, "description": "Redus Cluster OPS指标", "fieldConfig": { "defaults": { "custom": {}, "links": [], "mappings": [], "thresholds": { "mode": "absolute", "steps": [ { "color": "green", "value": null } ] } }, "overrides": [] }, "gridPos": { "h": 5, "w": 6, "x": 0, "y": 17 }, "id": 16, "options": { "colorMode": "value", "graphMode": "area", "justifyMode": "auto", "orientation": "auto", "reduceOptions": { "calcs": [ "mean" ], "fields": "", "values": false }, "textMode": "auto" }, "pluginVersion": "7.1.3", "targets": [ { "expr": "sum(irate(redis_commands_processed_total{job=~\"$rediscluster\"}[1m]))", "format": "time_series", "instant": false, "interval": "5s", "legendFormat": "{{alias}}", "refId": "A" } ], "timeFrom": null, "timeShift": null, "title": "QPS total", "type": "stat" }, { "aliasColors": {}, "bars": false, "dashLength": 10, "dashes": false, "datasource": null, "description": "Redus Cluster OPS指标", "fieldConfig": { "defaults": { "custom": {}, "links": [], "mappings": [], "thresholds": { "mode": "absolute", "steps": [ { "color": "green", "value": null }, { "color": "red", "value": 80 } ] } }, "overrides": [] }, "fill": 1, "fillGradient": 0, "gridPos": { "h": 5, "w": 9, "x": 6, "y": 17 }, "hiddenSeries": false, "id": 38, "legend": { "alignAsTable": true, "avg": false, "current": true, "max": true, "min": false, "rightSide": true, "show": true, "sort": "current", "sortDesc": true, "total": false, "values": true }, "lines": true, "linewidth": 1, "nullPointMode": "null", "percentage": false, "pluginVersion": "7.1.3", "pointradius": 2, "points": false, "renderer": "flot", "seriesOverrides": [], "spaceLength": 10, "stack": false, "steppedLine": false, "targets": [ { "expr": "irate(redis_commands_processed_total{job=~\"$rediscluster\"}[1m])", "format": "time_series", "instant": false, "interval": "5s", "legendFormat": "{{instance}}", "refId": "A" } ], "thresholds": [], "timeFrom": null, "timeRegions": [], "timeShift": null, "title": "QPS /every nodes", "tooltip": { "shared": true, "sort": 0, "value_type": "individual" }, "type": "graph", "xaxis": { "buckets": null, "mode": "time", "name": null, "show": true, "values": [] }, "yaxes": [ { "format": "short", "label": null, "logBase": 1, "max": null, "min": null, "show": true }, { "format": "short", "label": null, "logBase": 1, "max": null, "min": null, "show": true } ], "yaxis": { "align": false, "alignLevel": null } }, { "aliasColors": {}, "bars": false, "dashLength": 10, "dashes": false, "datasource": null, "description": "Command Calls / sec", "fieldConfig": { "defaults": { "custom": {}, "links": [], "mappings": [], "thresholds": { "mode": "absolute", "steps": [ { "color": "green", "value": null }, { "color": "red", "value": 80 } ] } }, "overrides": [] }, "fill": 1, "fillGradient": 0, "gridPos": { "h": 5, "w": 9, "x": 15, "y": 17 }, "hiddenSeries": false, "id": 46, "legend": { "alignAsTable": true, "avg": false, "current": true, "max": false, "min": false, "rightSide": true, "show": true, "sort": "current", "sortDesc": true, "total": false, "values": true }, "lines": true, "linewidth": 1, "nullPointMode": "null", "percentage": false, "pluginVersion": "7.1.3", "pointradius": 2, "points": false, "renderer": "flot", "seriesOverrides": [], "spaceLength": 10, "stack": false, "steppedLine": false, "targets": [ { "expr": "topk(10, irate(redis_commands_total{job=~\"$rediscluster\"} [5m]))", "format": "time_series", "instant": false, "interval": "5s", "legendFormat": "{{instance}} {{ cmd }}", "refId": "A" } ], "thresholds": [], "timeFrom": null, "timeRegions": [], "timeShift": null, "title": "Command Calls / sec", "tooltip": { "shared": true, "sort": 0, "value_type": "individual" }, "type": "graph", "xaxis": { "buckets": null, "mode": "time", "name": null, "show": true, "values": [] }, "yaxes": [ { "format": "short", "label": null, "logBase": 1, "max": null, "min": null, "show": true }, { "format": "short", "label": null, "logBase": 1, "max": null, "min": null, "show": true } ], "yaxis": { "align": false, "alignLevel": null } }, { "datasource": null, "description": "各个节点活跃连接数", "fieldConfig": { "defaults": { "custom": { "align": null }, "links": [], "mappings": [], "thresholds": { "mode": "absolute", "steps": [ { "color": "green", "value": null } ] } }, "overrides": [] }, "gridPos": { "h": 5, "w": 6, "x": 0, "y": 22 }, "id": 49, "options": { "colorMode": "value", "graphMode": "area", "justifyMode": "auto", "orientation": "auto", "reduceOptions": { "calcs": [ "mean" ], "fields": "", "values": false }, "textMode": "auto" }, "pluginVersion": "7.1.3", "targets": [ { "expr": "sum(redis_connected_clients{job=~\"$rediscluster\"})", "interval": "", "legendFormat": "{{instance}}", "refId": "A" } ], "timeFrom": null, "timeShift": null, "title": "当前连接总数", "type": "stat" }, { "aliasColors": {}, "bars": false, "dashLength": 10, "dashes": false, "datasource": null, "description": "各个节点活跃连接数", "fieldConfig": { "defaults": { "custom": { "align": null }, "links": [], "mappings": [], "thresholds": { "mode": "absolute", "steps": [ { "color": "green", "value": null }, { "color": "red", "value": 80 } ] } }, "overrides": [] }, "fill": 1, "fillGradient": 0, "gridPos": { "h": 5, "w": 10, "x": 6, "y": 22 }, "hiddenSeries": false, "id": 26, "legend": { "alignAsTable": true, "avg": false, "current": true, "max": true, "min": false, "rightSide": true, "show": true, "total": false, "values": true }, "lines": true, "linewidth": 1, "nullPointMode": "null", "percentage": false, "pluginVersion": "7.1.3", "pointradius": 2, "points": false, "renderer": "flot", "seriesOverrides": [], "spaceLength": 10, "stack": false, "steppedLine": false, "targets": [ { "expr": "redis_connected_clients{job=~\"$rediscluster\"}", "interval": "", "legendFormat": "{{instance}}", "refId": "A" } ], "thresholds": [], "timeFrom": null, "timeRegions": [], "timeShift": null, "title": "client every nodes", "tooltip": { "shared": true, "sort": 0, "value_type": "individual" }, "type": "graph", "xaxis": { "buckets": null, "mode": "time", "name": null, "show": true, "values": [] }, "yaxes": [ { "format": "short", "label": null, "logBase": 1, "max": null, "min": null, "show": true }, { "format": "short", "label": null, "logBase": 1, "max": null, "min": null, "show": true } ], "yaxis": { "align": false, "alignLevel": null } }, { "aliasColors": {}, "bars": false, "dashLength": 10, "dashes": false, "datasource": null, "description": "Network I/O", "fieldConfig": { "defaults": { "custom": {}, "links": [] }, "overrides": [] }, "fill": 1, "fillGradient": 0, "gridPos": { "h": 5, "w": 8, "x": 16, "y": 22 }, "hiddenSeries": false, "id": 45, "legend": { "alignAsTable": true, "avg": false, "current": true, "max": true, "min": false, "rightSide": true, "show": true, "sort": "current", "sortDesc": true, "total": false, "values": true }, "lines": true, "linewidth": 1, "nullPointMode": "null", "percentage": false, "pluginVersion": "7.1.3", "pointradius": 2, "points": false, "renderer": "flot", "seriesOverrides": [], "spaceLength": 10, "stack": false, "steppedLine": false, "targets": [ { "expr": "rate(redis_net_input_bytes_total{job=~\"$rediscluster\"}[5m])", "interval": "", "legendFormat": "{{instance}}", "refId": "A" }, { "expr": "rate(redis_net_output_bytes_total{job=~\"$rediscluster\"}[5m])", "interval": "", "legendFormat": "{{instance}}", "refId": "B" } ], "thresholds": [], "timeFrom": null, "timeRegions": [], "timeShift": null, "title": "Network I/O", "tooltip": { "shared": true, "sort": 0, "value_type": "individual" }, "type": "graph", "xaxis": { "buckets": null, "mode": "time", "name": null, "show": true, "values": [] }, "yaxes": [ { "format": "bytes", "label": null, "logBase": 1, "max": null, "min": null, "show": true }, { "format": "short", "label": null, "logBase": 1, "max": null, "min": null, "show": true } ], "yaxis": { "align": false, "alignLevel": null } }, { "datasource": null, "description": "", "fieldConfig": { "defaults": { "custom": { "align": null }, "links": [], "mappings": [], "thresholds": { "mode": "absolute", "steps": [ { "color": "green", "value": null } ] } }, "overrides": [] }, "gridPos": { "h": 6, "w": 8, "x": 0, "y": 27 }, "id": 22, "options": { "colorMode": "value", "graphMode": "area", "justifyMode": "auto", "orientation": "auto", "reduceOptions": { "calcs": [ "mean" ], "fields": "", "values": false }, "textMode": "auto" }, "pluginVersion": "7.1.3", "targets": [ { "expr": "sum(redis_db_keys{job=~\"$rediscluster\"})", "format": "time_series", "interval": "", "intervalFactor": 1, "legendFormat": "total key", "refId": "A" }, { "expr": "sum (redis_db_keys{job=~\"$rediscluster\"}) - sum (redis_db_keys_expiring{job=~\"$rediscluster\"}) ", "format": "time_series", "interval": "", "intervalFactor": 1, "legendFormat": "no expir key", "refId": "B" } ], "timeFrom": null, "timeShift": null, "title": "total keys", "type": "stat" }, { "datasource": null, "description": "", "fieldConfig": { "defaults": { "custom": { "align": null }, "links": [], "mappings": [], "thresholds": { "mode": "absolute", "steps": [ { "color": "green", "value": null }, { "color": "yellow", "value": 70 }, { "color": "dark-red", "value": 90 } ] }, "unit": "percent" }, "overrides": [] }, "gridPos": { "h": 6, "w": 3, "x": 8, "y": 27 }, "id": 48, "options": { "orientation": "auto", "reduceOptions": { "calcs": [ "mean" ], "fields": "", "values": false }, "showThresholdLabels": false, "showThresholdMarkers": true }, "pluginVersion": "7.1.3", "targets": [ { "expr": "100-((sum (redis_db_keys_expiring{job=~\"$rediscluster\"}) /sum (redis_db_keys{job=~\"$rediscluster\"}))*100)", "format": "time_series", "interval": "", "intervalFactor": 1, "legendFormat": "", "refId": "B" } ], "timeFrom": null, "timeShift": null, "title": "未设置过期时间key百分比", "type": "gauge" }, { "aliasColors": {}, "bars": false, "dashLength": 10, "dashes": false, "datasource": null, "description": "各个节点以及集群的 KEYS 总数", "fieldConfig": { "defaults": { "custom": {}, "links": [] }, "overrides": [] }, "fill": 1, "fillGradient": 0, "gridPos": { "h": 6, "w": 13, "x": 11, "y": 27 }, "hiddenSeries": false, "id": 41, "legend": { "alignAsTable": true, "avg": false, "current": true, "max": false, "min": false, "rightSide": true, "show": true, "sort": "current", "sortDesc": true, "total": false, "values": true }, "lines": true, "linewidth": 1, "nullPointMode": "null", "percentage": false, "pluginVersion": "7.1.3", "pointradius": 2, "points": false, "renderer": "flot", "seriesOverrides": [], "spaceLength": 10, "stack": false, "steppedLine": false, "targets": [ { "expr": "redis_db_keys{job=~\"$rediscluster\"}", "interval": "", "legendFormat": "{{instance}}", "refId": "A" } ], "thresholds": [], "timeFrom": null, "timeRegions": [], "timeShift": null, "title": "KEYS 每节点", "tooltip": { "shared": true, "sort": 0, "value_type": "individual" }, "type": "graph", "xaxis": { "buckets": null, "mode": "time", "name": null, "show": true, "values": [] }, "yaxes": [ { "format": "short", "label": null, "logBase": 1, "max": null, "min": null, "show": true }, { "format": "short", "label": null, "logBase": 1, "max": null, "min": null, "show": true } ], "yaxis": { "align": false, "alignLevel": null } }, { "datasource": null, "description": "Hitsper Sec", "fieldConfig": { "defaults": { "custom": { "align": null }, "links": [], "mappings": [], "thresholds": { "mode": "absolute", "steps": [ { "color": "green", "value": null } ] } }, "overrides": [] }, "gridPos": { "h": 10, "w": 24, "x": 0, "y": 33 }, "id": 43, "options": { "colorMode": "value", "graphMode": "area", "justifyMode": "auto", "orientation": "auto", "reduceOptions": { "calcs": [ "mean" ], "fields": "", "values": false }, "textMode": "auto" }, "pluginVersion": "7.1.3", "targets": [ { "expr": "irate(redis_keyspace_hits_total{job=~\"$rediscluster\"}[5m])", "interval": "", "legendFormat": "{{instance}}", "refId": "A" } ], "timeFrom": null, "timeShift": null, "title": "Hitsper Sec", "type": "stat" }, { "datasource": null, "description": "Hits / Misses per Sec", "fieldConfig": { "defaults": { "custom": {}, "links": [], "mappings": [], "thresholds": { "mode": "absolute", "steps": [ { "color": "green", "value": null }, { "color": "#EAB839", "value": 80 }, { "color": "red", "value": 200 } ] } }, "overrides": [] }, "gridPos": { "h": 11, "w": 24, "x": 0, "y": 43 }, "id": 44, "options": { "colorMode": "value", "graphMode": "area", "justifyMode": "auto", "orientation": "auto", "reduceOptions": { "calcs": [ "mean" ], "fields": "", "values": false }, "textMode": "auto" }, "pluginVersion": "7.1.3", "targets": [ { "expr": "irate(redis_keyspace_misses_total{job=~\"$rediscluster\"}[5m])", "interval": "", "legendFormat": "{{instance}}", "refId": "A" } ], "timeFrom": null, "timeShift": null, "title": "Misses per Sec", "type": "stat" } ], "refresh": false, "schemaVersion": 26, "style": "dark", "tags": [], "templating": { "list": [ { "allValue": null, "current": { "selected": true, "text": "All", "value": [ "$__all" ] }, "datasource": "Prometheus", "definition": "label_values(redis_instance_info{job=~\"$rediscluster\"},role)", "hide": 0, "includeAll": true, "label": "Role", "multi": true, "name": "role", "options": [], "query": "label_values(redis_instance_info{job=~\"$rediscluster\"},role)", "refresh": 1, "regex": "", "skipUrlSync": false, "sort": 0, "tagValuesQuery": "", "tags": [], "tagsQuery": "", "type": "query", "useTags": false }, { "allValue": null, "current": { "selected": true, "text": "All", "value": [ "$__all" ] }, "datasource": "Prometheus", "definition": "label_values(redis_instance_info{alias=~\"$cluster\",role=~\"$role\"},addr)", "hide": 2, "includeAll": true, "label": "instance", "multi": true, "name": "instance", "options": [], "query": "label_values(redis_instance_info{alias=~\"$cluster\",role=~\"$role\"},addr)", "refresh": 1, "regex": "", "skipUrlSync": false, "sort": 0, "tagValuesQuery": "", "tags": [], "tagsQuery": "", "type": "query", "useTags": false }, { "allValue": null, "current": { "selected": true, "text": "All", "value": [ "$__all" ] }, "datasource": "Prometheus", "definition": "label_values(redis_instance_info{job=~\"$rediscluster\",role=\"master\"},addr)", "hide": 2, "includeAll": true, "label": "master", "multi": true, "name": "master", "options": [], "query": "label_values(redis_instance_info{job=~\"$rediscluster\",role=\"master\"},addr)", "refresh": 1, "regex": "", "skipUrlSync": false, "sort": 0, "tagValuesQuery": "", "tags": [], "tagsQuery": "", "type": "query", "useTags": false }, { "allValue": null, "current": { "selected": true, "text": "redis_exporter_targets-SIT-vm01", "value": "redis_exporter_targets-SIT-vm01" }, "datasource": "Prometheus", "definition": "label_values(job)", "hide": 0, "includeAll": false, "label": null, "multi": false, "name": "rediscluster", "options": [ { "selected": false, "text": "redis_exporter_targets-DEV-vm01", "value": "redis_exporter_targets-DEV-vm01" }, { "selected": false, "text": "redis_exporter_targets-DEV-vm02", "value": "redis_exporter_targets-DEV-vm02" }, { "selected": false, "text": "redis_exporter_targets-DEV-vm03", "value": "redis_exporter_targets-DEV-vm03" }, { "selected": false, "text": "redis_exporter_targets-SIT-docker01", "value": "redis_exporter_targets-SIT-docker01" }, { "selected": true, "text": "redis_exporter_targets-SIT-vm01", "value": "redis_exporter_targets-SIT-vm01" }, { "selected": false, "text": "redis_exporter_targets-SIT01", "value": "redis_exporter_targets-SIT01" } ], "query": "label_values(job)", "refresh": 0, "regex": "", "skipUrlSync": false, "sort": 0, "tagValuesQuery": "", "tags": [], "tagsQuery": "", "type": "query", "useTags": false } ] }, "time": { "from": "now-5m", "to": "now" }, "timepicker": { "refresh_intervals": [ "5s", "10s", "30s", "1m", "5m", "15m", "30m", "1h", "2h", "1d" ] }, "timezone": "", "title": "Redis Cluster Monitor", "uid": "rakSCeSMk", "version": 82}将上面模板 导入
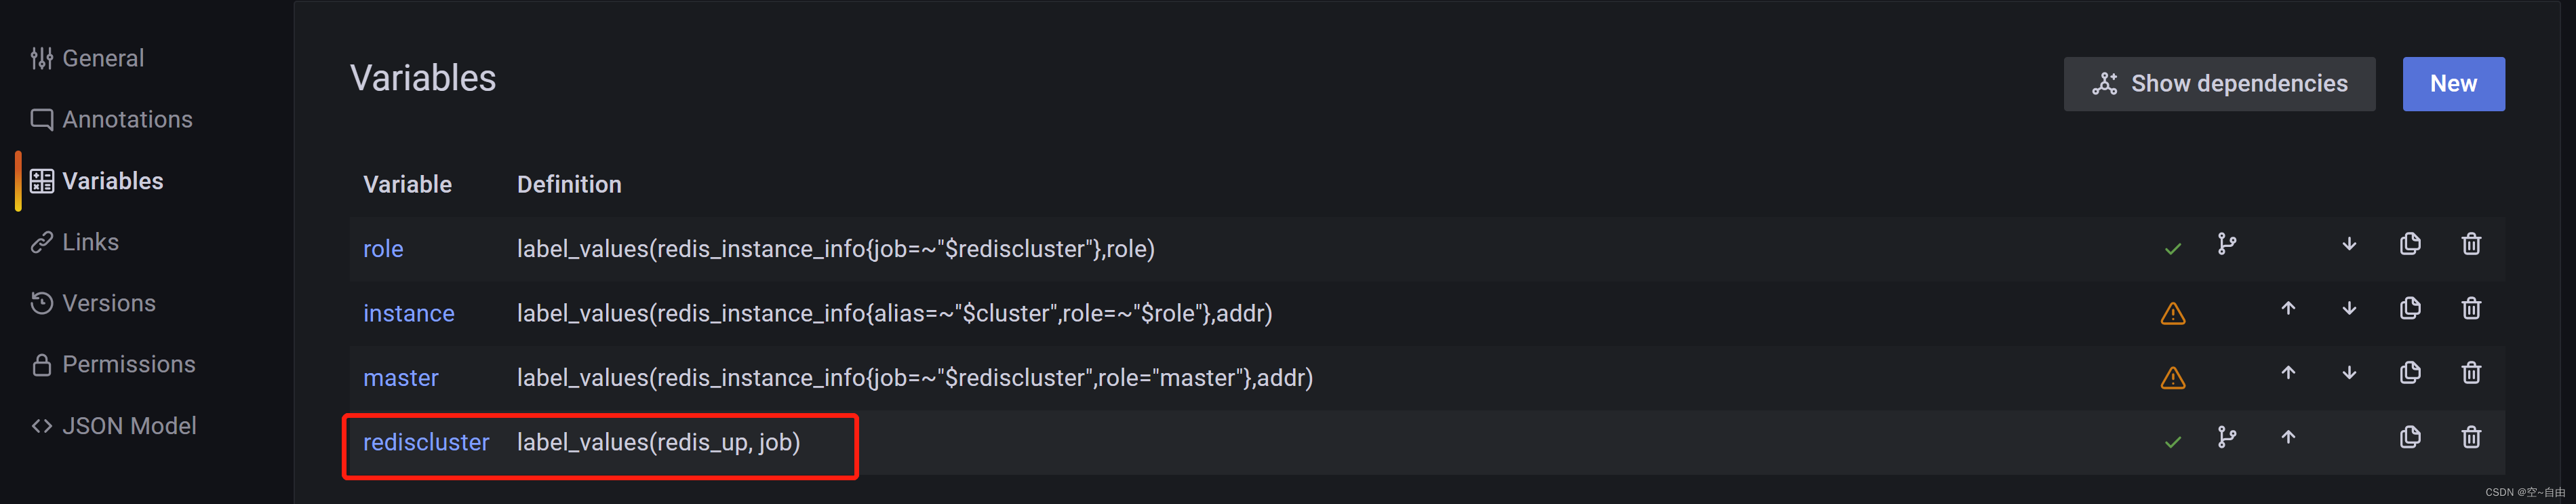
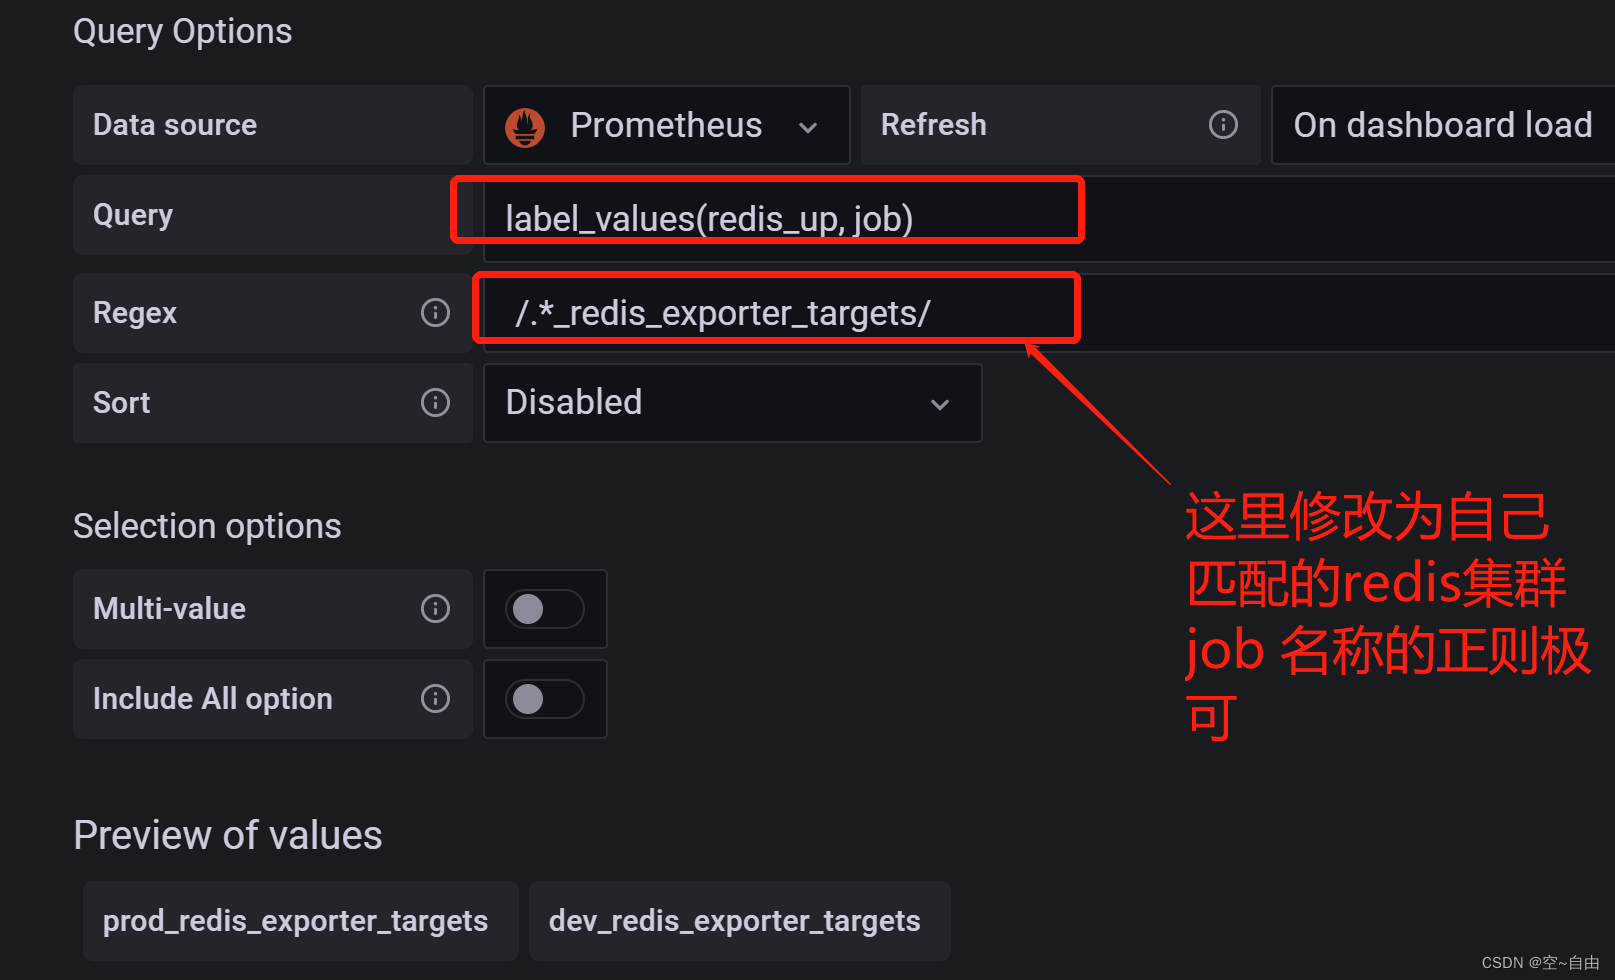
然后修改修改clusternode变量
保存,即可查看整体监控效果
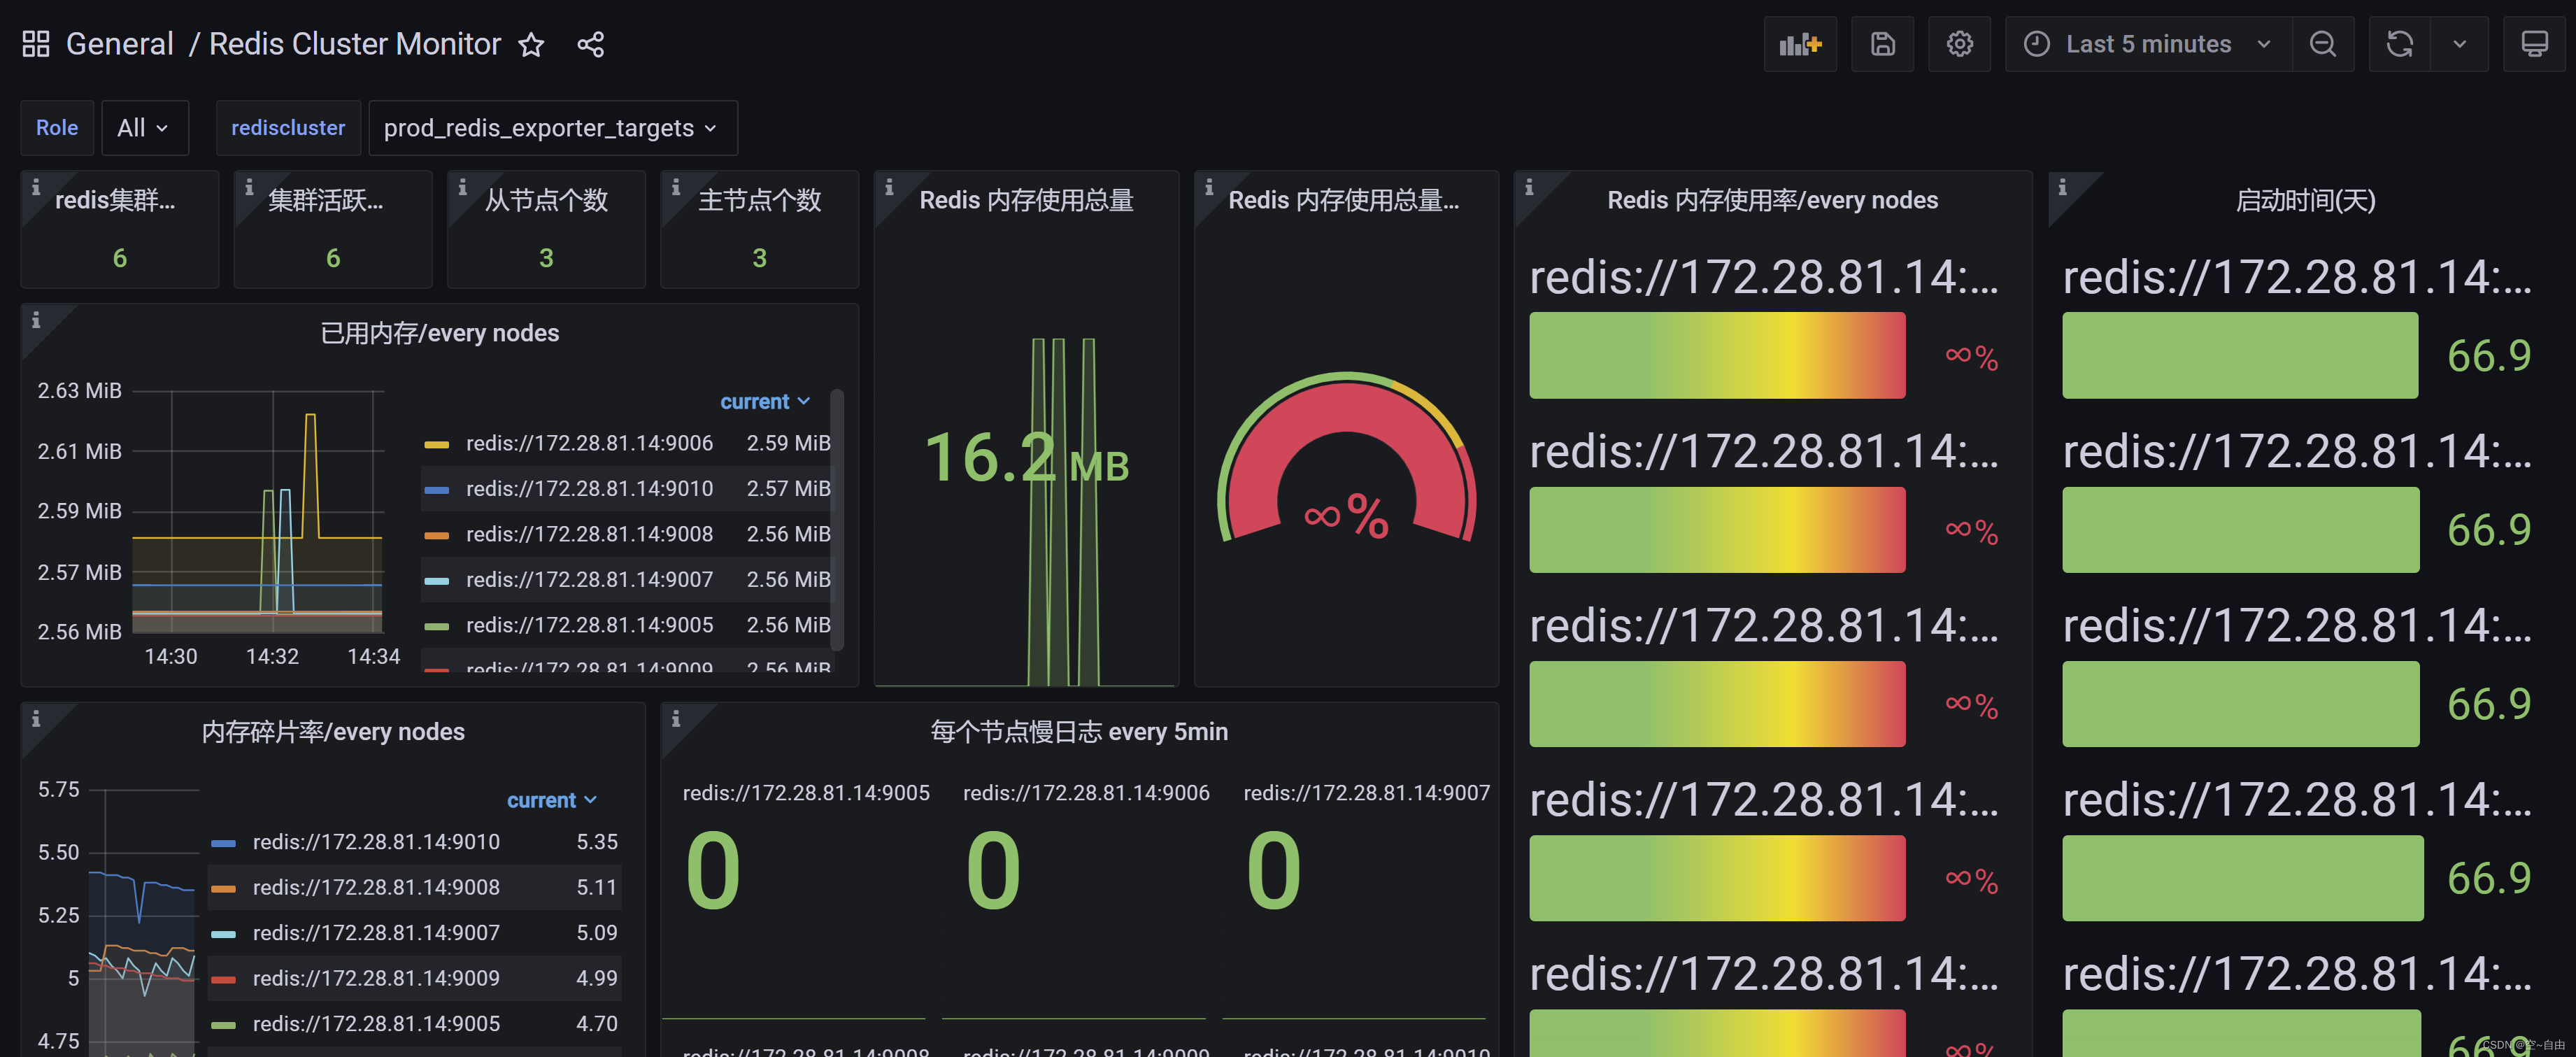
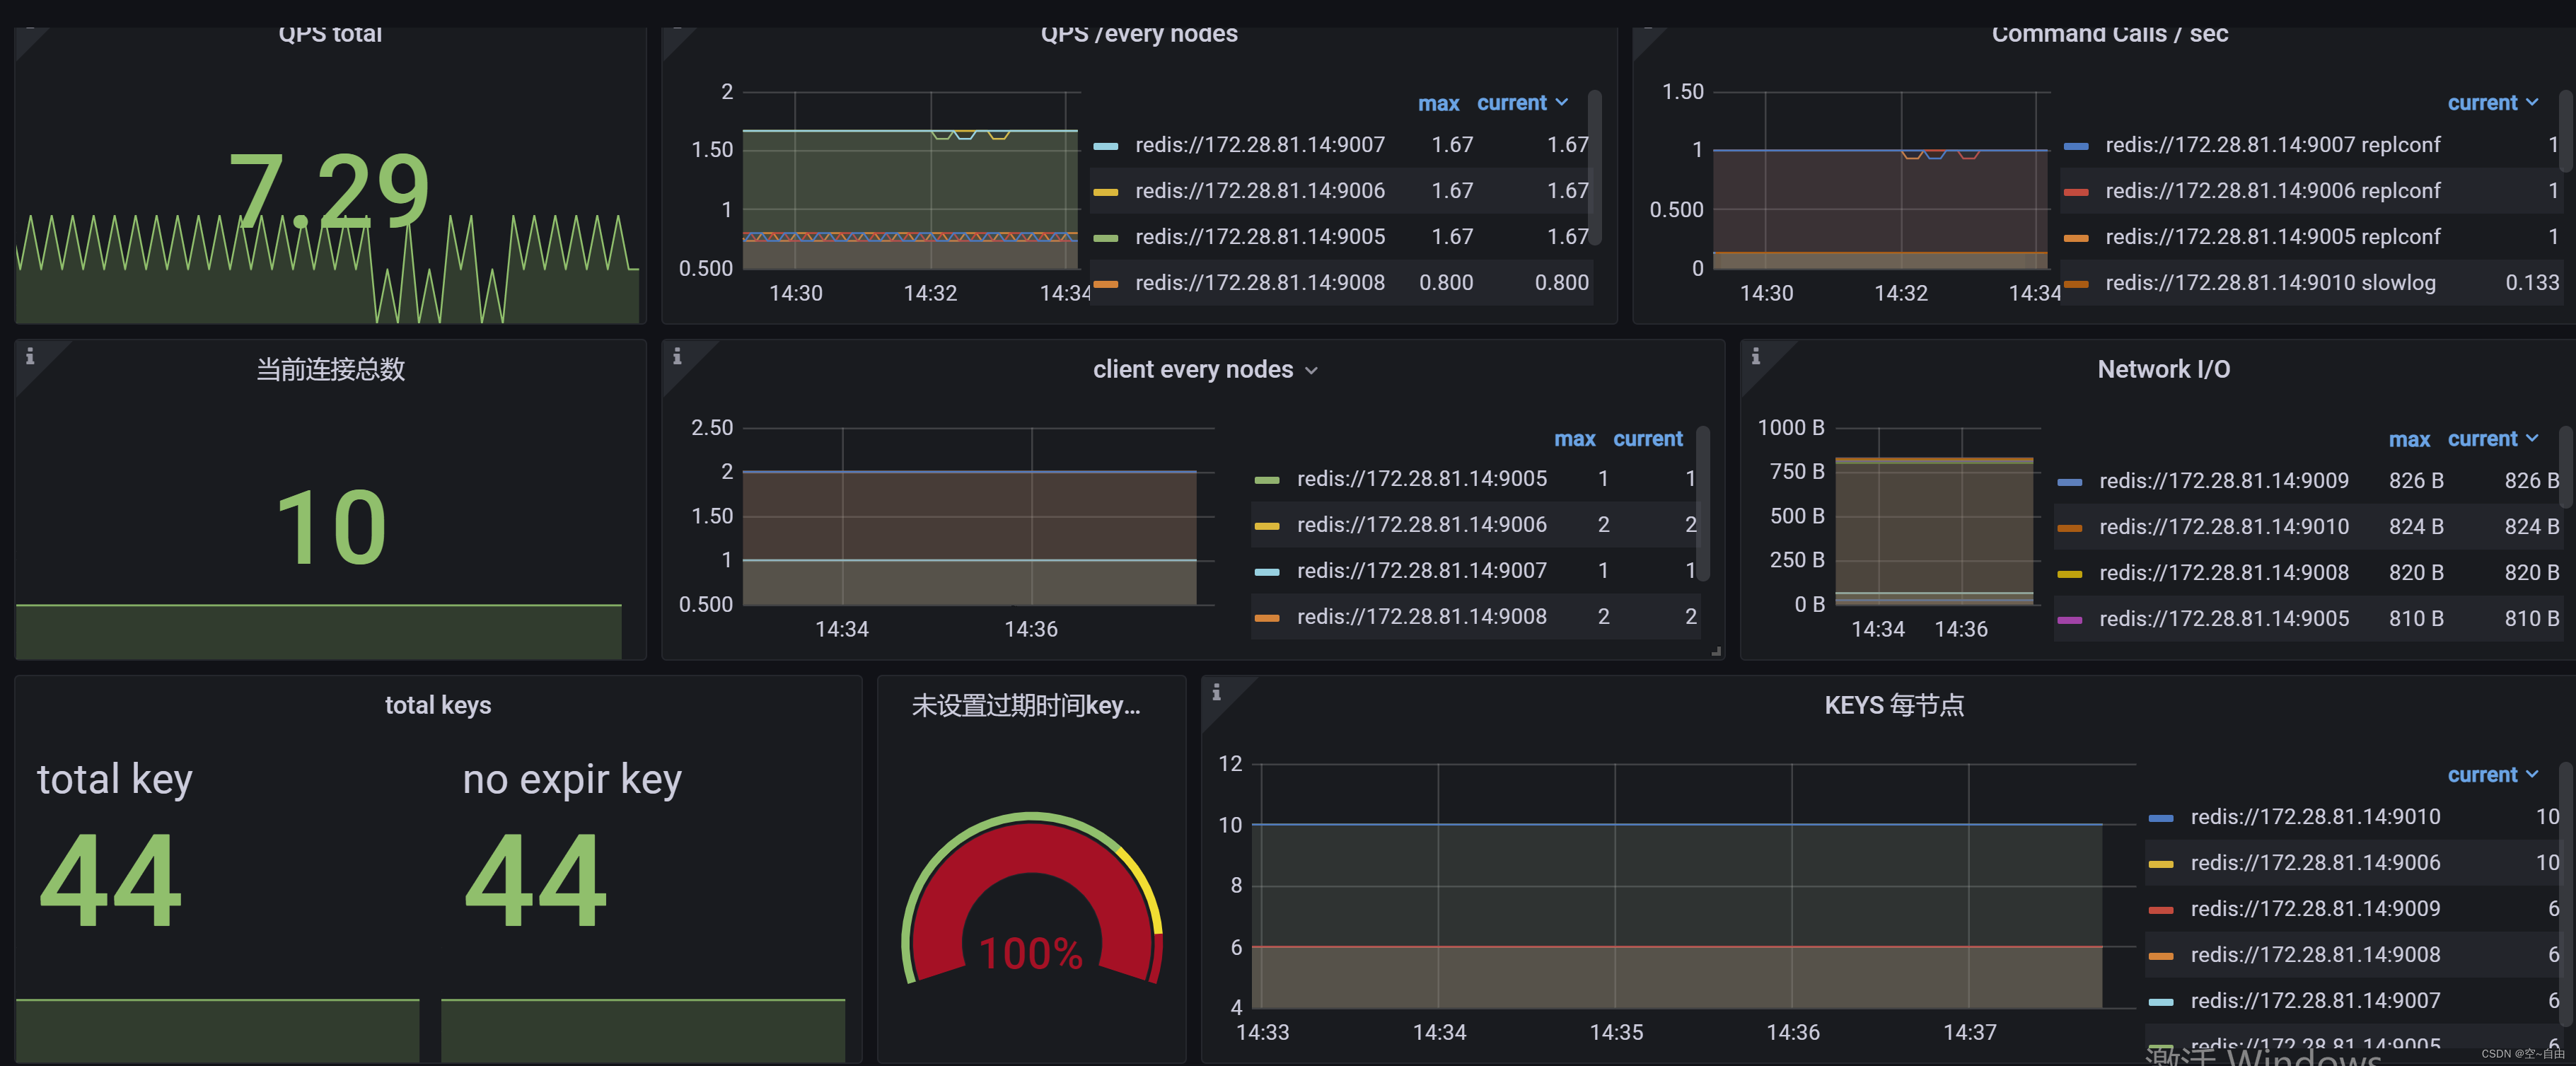
支持查看整体和每个集群的慢日志、QPS、内存使用率、客户端连接数、不通操作QPS、集群整体健康状况、网络IO、总key,未设置失效时间key、内存碎片、缓存命中/未命中数等。


![Java之美[从菜鸟到高手演变]之设计模式](https://img-my.csdn.net/uploads/201211/29/1354159363_7245.PNG)