AI Earth地球科学云平台开发者模式提供了丰富的遥感数据和函数计算能力,下面介绍结合AIE Notebook,实现遥感数据的百分比线性灰度拉伸。
本期开发者实践案例——遥感影像百分比线性拉伸
灰度拉伸 (GrayScale Stretch) 是遥感影像处理过程中的重要步骤,其目的是将遥感影像的原始像元值区间通过某种对应关系映射到另一个像元值区间,如映射到RGB图像的 [0, 255] 或 [0, 65535] 区间,映射到 [0, 1] 的归一化区间等。通过对遥感图像进行合理的灰度拉伸预处理,可有效提高后续如特征提取等处理流程的效果,也有助于获得良好的图像可视化结果。
/ 直接线性拉伸 /
在介绍百分比线性灰度拉伸之前,先介绍最基本的直接线性拉伸。直接线性拉伸是最常见的图像增强方法,不依赖于外部参数输入,实现步骤如下:
Step 1:获取待拉伸图像的最大灰度值和最小灰度值;
Step 2:使用图像灰度最值对所有像元对灰度进行归一化(0~1);
Step 3:将归一化后的像元值重新转换到0~255或者0~65535区间;
直接线性拉伸的操作如下:
01/ 平台初始化和数据导入
import aie
aie.Authenticate()
aie.Initialize()#准备数据
def s2_collection(start_date, end_date, region):s2 = aie.ImageCollection('SENTINEL_MSIL2A') \.filterBounds(region) \.filterDate(start_date, end_date) \.filter('eo:cloud_cover<20')mosaic_image = s2.median().clip(region)return s2, mosaic_image#获取区域:浙江省
region = aie.FeatureCollection('China_Province') \.filter(aie.Filter.eq('province', '浙江省')) \.geometry()#获取遥感数据
s2, s2_mosaic = s2_collection('2021-04-01', '2022-08-30', region)
02/ 获取灰度值范围
获取待拉伸图像的的最小和最大灰度值,哨兵2号B4/B3/B2分别对应R/G/B通道。
#直接线性拉伸
def get_actual_min_max(image, bands, region, scale):minValue = image.select(bands).reduceRegion(aie.Reducer.min(), region, scale)maxValue = image.select(bands).reduceRegion(aie.Reducer.max(), region, scale)return minValue.getInfo(), maxValue.getInfo()#获取待拉伸图像的最小、最大灰度值
show_bands = ['B4', 'B3', 'B2']
min_value, max_value = get_actual_min_max(s2_mosaic, show_bands, region, 1000)
03/ 可视化
使用addLayer方法中的vis_params参数,其中min和max作为Image拉伸渲染的最小值和最大值,遥感影像的原始数据位于这两个参数之间的数据会被线性映射到0~255之间,小于min的被映射为0,大于max的被映射为255。目前该参数支持单波段或3波段。
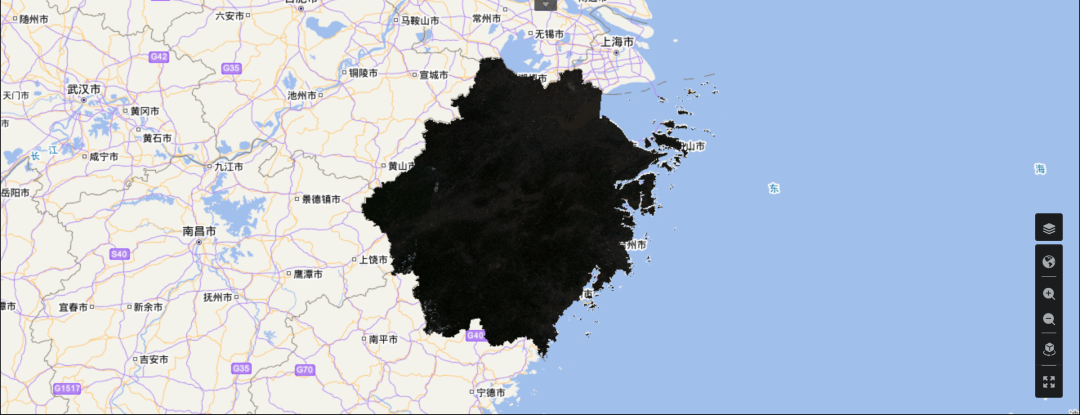
04/ 拉伸效果分析
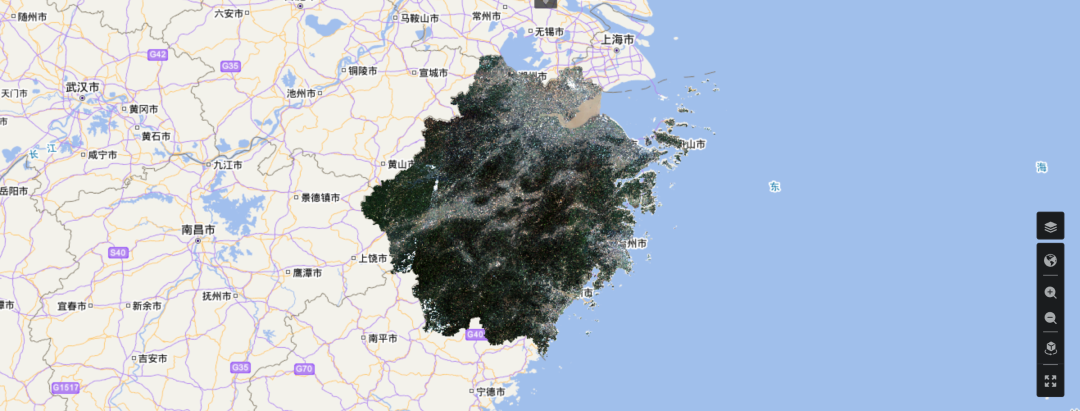
是否感觉有点不对劲儿,怎么图像这么暗?
对遥感影像原始数据进行直方图分析可以发现问题所在。
import matplotlib.pyplot as plt
histogram = s2_mosaic.select(show_bands).reduceRegion(aie.Reducer.histogram(2000), None, scale)
for band in show_bands:band_range = histogram.getInfo()[band+'_range']band_counts = histogram.getInfo()[band+'_counts']plt.plot(band_range, band_counts)plt.xlabel(band + '_range')plt.ylabel(band + '_counts')plt.show()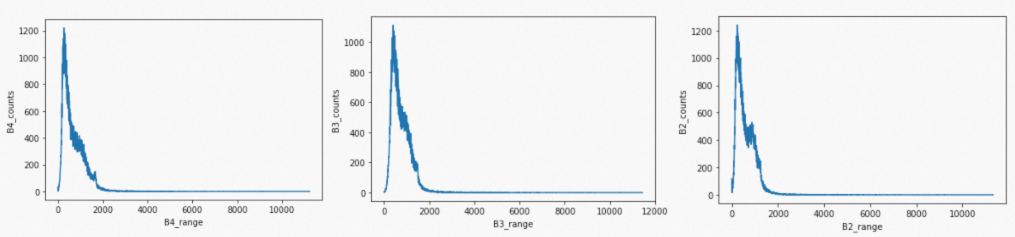
从直方图数据可以发现,原始数据的区间虽然很大(0~12000),但是绝大多数像元的数据都位于0~2000左右,导致直接线性拉伸后的图像对比度差,不利于可视化和后续处理。
/ 百分比线性拉伸 /
百分比线性拉伸是直接线性拉伸的进一步改进,直接线性拉伸是对所有灰度值进行拉伸,而百分比线性拉伸则只对一定灰度值区间进行拉伸。例如ENVI的2%线性灰度拉伸,就是针对低灰度值设置2%,高灰度值设置98%,即只对该区间进行拉伸。实现步骤如下:
Step 1:计算待拉伸图像的灰度直方图;
Step 2:对灰度直方图进行遍历,当低灰度像元累计数量达到2%时,将该灰度值设定为起始灰度值;继续对像元数量进行累加,当像元数量累加到98%时,将该灰度值设置为终止灰度值;
Step 3:使用获取得到的起始灰度值和终止灰度值对所有像元灰度值进行归一化;
Step 4:将归一化后对像元值重新转换到0~255或者0~65535区间,如果转换后的值超过映射区间,则设置对应的最大值或者最小值。
01/ 获取灰度值范围
import numpy as npdef get_percent_min_max_hist(band_range, band_counts, min_percent, max_percent):key = np.array(band_counts)accSum = np.cumsum(key)accPercent = accSum / accSum[-1]pmin = np.searchsorted(accPercent, min_percent)min_hist = band_range[pmin + 1]pmax = np.searchsorted(accPercent, max_percent)max_hist = band_range[pmax]return min_hist, max_hist  #百分比线性拉伸获取起始灰度值和终止灰度值
def get_percent_min_max(image, bands, scale, min_percent, max_percent):min_value = {}max_value = {}histogram = image.select(bands).reduceRegion(aie.Reducer.histogram(2000), None, scale)for band in bands:print('start band ' + band + ' ...')band_range = histogram.getInfo()[band+'_range']band_counts = histogram.getInfo()[band+'_counts']temp_min, temp_max = get_percent_min_max_hist(band_range, band_counts, min_percent, max_percent)min_value[band+'_min'] = temp_minmax_value[band+'_max'] = temp_maxprint('end band ' + band + ' ! min=' + str(temp_min) + ', max=' + str(temp_max))return min_value, max_value#获取待拉伸图像的最小、最大灰度值
show_bands = ['B4', 'B3', 'B2']
min_value, max_value = get_percent_min_max(s2_mosaic, show_bands, 1000, 0.02, 0.98)
02/ 效果分析
使用百分比线性灰度拉伸后的遥感影像可视化效果比直接线性拉伸有明显提升。

直接线性拉伸效果
百分比线性灰度拉伸后效果
百分比线性灰度拉伸的完整代码:
import aie
aie.Authenticate()
aie.Initialize()#准备数据
def s2_collection(start_date, end_date, region):s2 = aie.ImageCollection('SENTINEL_MSIL2A') \.filterBounds(region) \.filterDate(start_date, end_date) \.filter('eo:cloud_cover<20')mosaic_image = s2.median().clip(region)return s2, mosaic_image#获取区域:浙江省
region = aie.FeatureCollection('China_Province') \.filter(aie.Filter.eq('province', '浙江省')) \.geometry()#获取遥感数据
s2, s2_mosaic = s2_collection('2021-04-01', '2022-08-30', region)import numpy as npdef get_percent_min_max_hist(band_range, band_counts, min_percent, max_percent):key = np.array(band_counts)accSum = np.cumsum(key)accPercent = accSum / accSum[-1]pmin = np.searchsorted(accPercent, min_percent)min_hist = band_range[pmin + 1]pmax = np.searchsorted(accPercent, max_percent)max_hist = band_range[pmax]return min_hist, max_hist  #百分比线性拉伸获取起始灰度值和终止灰度值
def get_percent_min_max(image, bands, scale, min_percent, max_percent):min_value = {}max_value = {}histogram = image.select(bands).reduceRegion(aie.Reducer.histogram(2000), None, scale)for band in bands:print('start band ' + band + ' ...')band_range = histogram.getInfo()[band+'_range']band_counts = histogram.getInfo()[band+'_counts']temp_min, temp_max = get_percent_min_max_hist(band_range, band_counts, min_percent, max_percent)min_value[band+'_min'] = temp_minmax_value[band+'_max'] = temp_maxprint('end band ' + band + ' ! min=' + str(temp_min) + ', max=' + str(temp_max))return min_value, max_value#获取待拉伸图像的最小、最大灰度值
show_bands = ['B4', 'B3', 'B2']
min_value, max_value = get_percent_min_max(s2_mosaic, show_bands, 1000, 0.02, 0.98)#可视化
vis_params = {'bands': ['B4', 'B3', 'B2'],   'min': [min_value['B4_min'], min_value['B3_min'], min_value['B2_min']],'max': [max_value['B4_max'], max_value['B3_max'], max_value['B2_max']]
}map = aie.Map(center=region.getCenter(),height=800,zoom=6
)
map.addLayer(s2_mosaic,vis_params,'sample image',bounds=region.getBounds()
)
map