% % 使用指定函数对下述两变量进行曲线拟合
% % y=a+k1*exp(m*t)+k2*exp(-m*t);
% % 离散点: t=[0,4,8,40],
% % y=[20.09,64.52,85.83,126.75];
% % t-自变量 y-因变量 a,m,k1,k2为常数
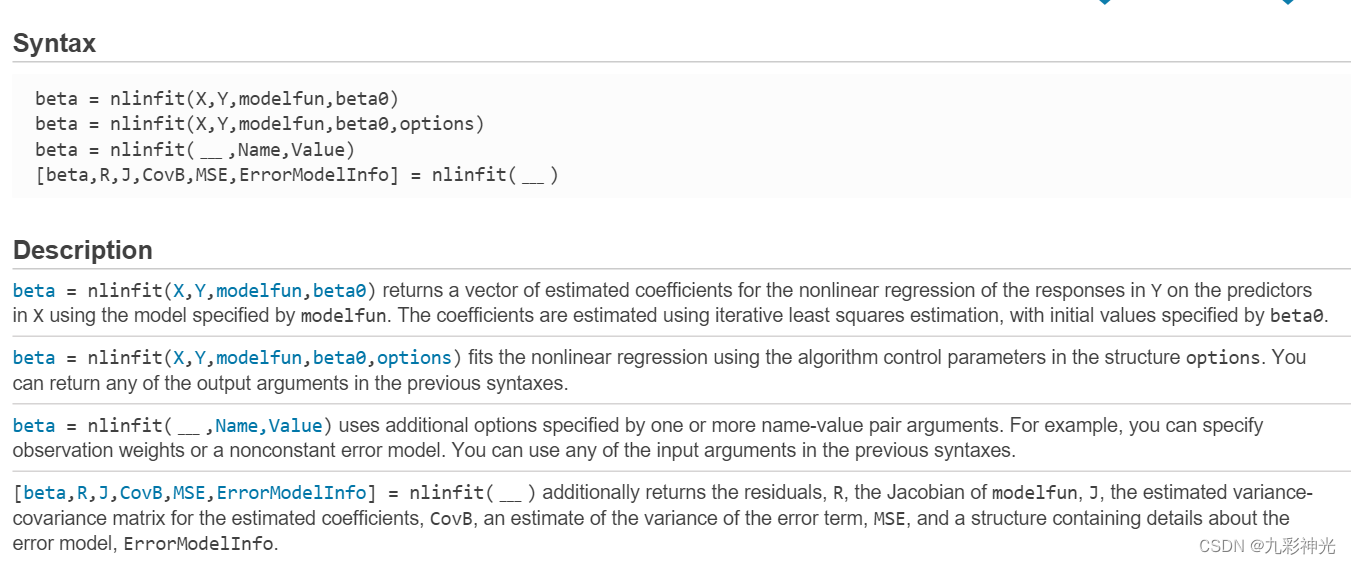
% % 用非线性回归nlinfit,如果数据点多些,效果会更好。
脚本:
clc;clear; t=[0 4 8 40];
y=[20.09 64.52 85.83 126.75];
beta=nlinfit(t,y,@myfunc2,[1 1 1 1])
a=beta(1)
k1=beta(2)
k2=beta(3)
m=beta(4)
tt=0:1:40
yy=a+k1*exp(m*tt)+k2*exp(-m*tt)
plot(t,y,'o',tt,yy)
函数:
function y1=myfunc2(const,t)
a=const(1);
k1=const(2);
k2=const(3);
m=const(4);
y1=a+k1*exp(m*t)+k2*exp(-m*t); %这些系数的顺序依次由外到内,从左至右
图像: 
% clc;clear;
% t=[0 4 8 40];
% y=[20.09 64.52 85.83 126.75];
% myfunc=inline('beta(1)+beta(2)*exp(beta(4)*t)+beta(3)*exp(-beta(4)*t)','beta','t');
% beta=nlinfit(t,y,myfunc,[1 1 1 1]);
% a=beta(1),k1=beta(2),k2=beta(3),m=beta(4) ;
% %test the model
% tt=0:1:40 ;
% yy=a+k1*exp(m*tt)+k2*exp(-m*tt);
% plot(t,y,'o',tt,yy,'r')


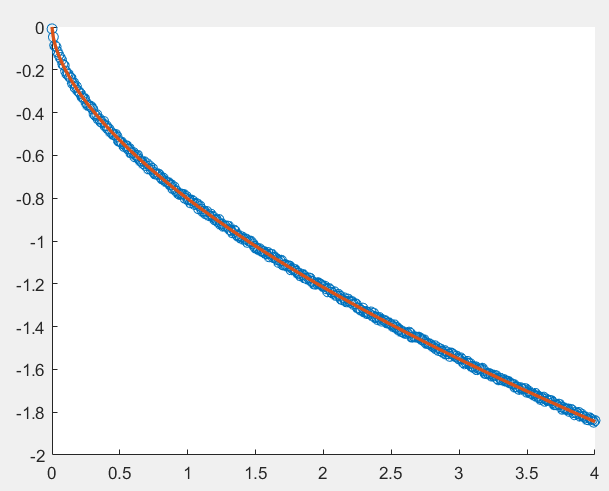


![[MATLAB]非线性回归--自配函数(nlinfit)](https://img-blog.csdnimg.cn/20200401160325946.png?x-oss-process=image/watermark,type_ZmFuZ3poZW5naGVpdGk,shadow_10,text_aHR0cHM6Ly9ibG9nLmNzZG4ubmV0L20wXzM3MTQ5MDYy,size_16,color_FFFFFF,t_70)