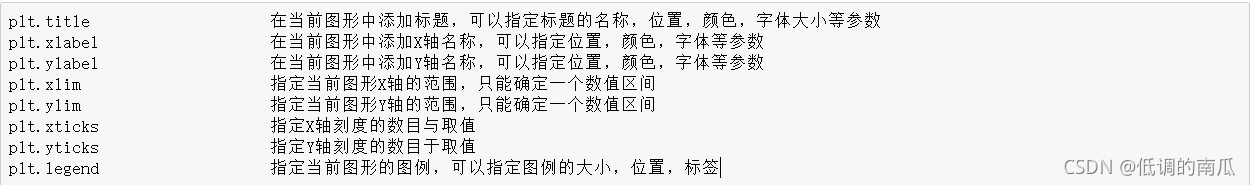
绘图时设置坐标轴属性
data = np.arange(0,1,0.01)
plt.title('my lines example')
plt.xlabel('x')
plt.ylabel('y')
plt.xlim(0,1)
plt.ylim(0,1)
plt.xticks([0,0.2,0.4,0.6,0.8,1])
plt.yticks([0,0.2,0.4,0.6,0.8,1])
plt.tick_params(labelsize = 12)
plt.plot(data,data**2)
plt.plot(data,data**3)
plt.legend(['y = x^2','y = x^3'])
plt.show()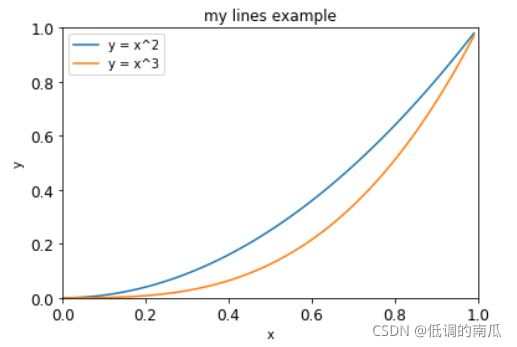
包含子图绘制的基础语法
data = np.arange(0,np.pi * 2,0.01)
fig1 = plt.figure(figsize=(9,7),dpi=90)
ax1 = fig.add_subplot(1,2,1)
plt.title('line example')
plt.xlabel('x')
plt.ylabel('y')
plt.xlim(0,1)
plt.ylim(0,1)
plt.xticks([0,0.2,0.4,0.6,0.8,1])
plt.yticks([0,0.2,0.4,0.6,0.8,1])
plt.plot(data,data**2)
plt.plot(data,data**3)
plt.legend(['y = x^2','y = x^3'])
ax1 = fig1.add_subplot(1,2,2)
plt.title('sin-cos')
plt.xlabel('x')
plt.ylabel('y')
plt.xlim(0,np.pi*2)
plt.ylim(-1,1)
plt.xticks([0,np.pi/2,np.pi,np.pi*(3/2),np.pi*2])
plt.yticks([-1,-0.5,0,0.5,1])
plt.plot(data,np.sin(data))
plt.plot(data,np.cos(data))
plt.legend(['sin','cos'])
plt.show()
关于plt.legend()参数 loc说明
0:'best'       1:'upper right'     2:'upper left'    3:'lower left'     4:'lower right'    5:'right'    6:'center left'
7:'center right'     8:'lower center'   9:'upper center'      10:'center'plt.legend(loc = 'best,frameon = False)
#去掉图里边框,推荐使用
plt.legend(loc = 'best,edgecolor = 'blue)
#设置图例边框颜色
plt.legend(loc = 'best,facecolor = 'blue)
#设置图例背景颜色,若无边框,参数无效
绘图显示和保存函数
plt.savefig
#保存绘制的图片,可以指定图片的分辨率,边缘的颜色等参数
plt.show
#在本机显示图形
figure.savefig()选项及说明
fname
#包含文件路径或python文件型对象的字符串。图片格式是从文件扩展名中推断出来的(例如PDF格式的.pdf)
dpi
#设置每英寸点数的分辨率,默认为100
facecolor.edegecolor
#子图之外的图形的背景颜色,默认是‘w'(白色)
format
#文件格式('png','pdf','svg','ps'等)
bbox_inches
#要保存的图片范围,设置为'tight'则去除图片周围的空白
查看matplotlib的rc参数
print(plt.rcParams())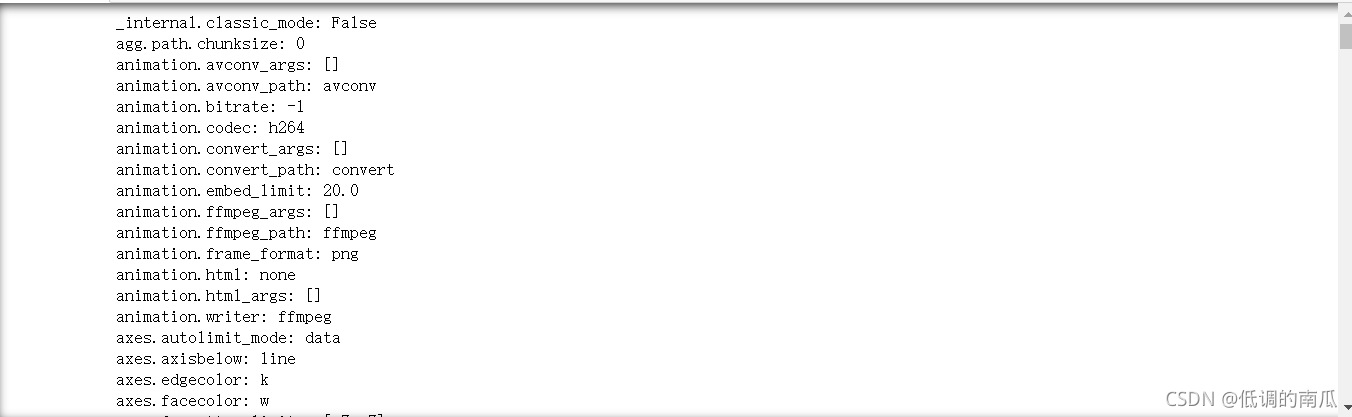
全局参数定制
rc参数 解释 取值
lines.linewidth 线条宽度 取0~10的数值,默认为1.5
lines.linestyle 线条样式 取“-”,“--”,“-.”,“:”4种,默认为“-”
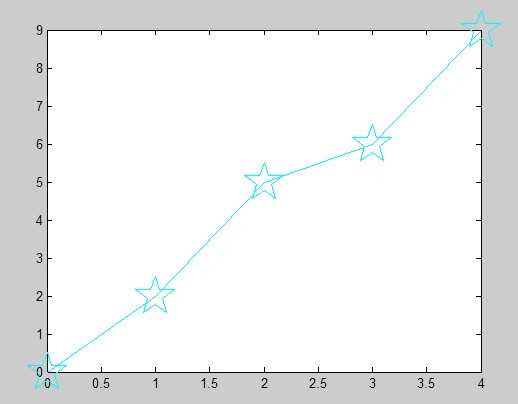
lines.maker 线条上点的形状 可取“o”,“D”等20种,默认为None
lines.markersize 点的大小 取0~10的数值,默认为1线条样式lines.linestyle的取值
linestyle取值 意义
- 实线
-- 长虚线
-. 点线
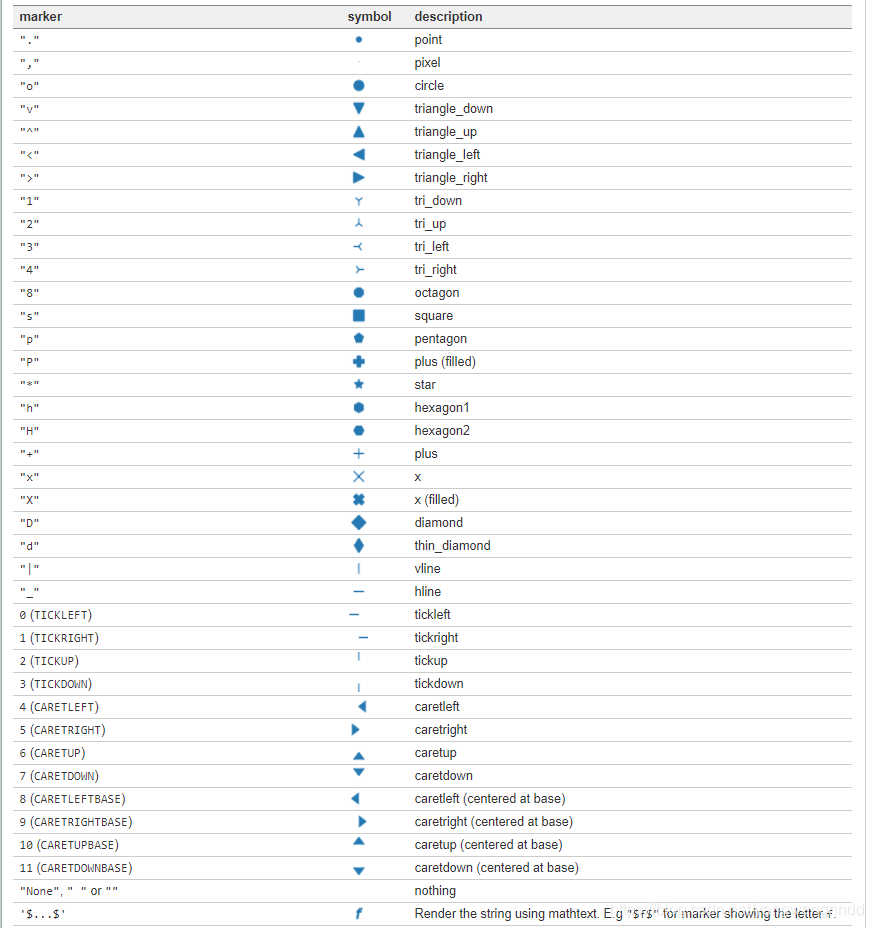
: 短虚线lines.marker参数的取值
marker取值 意义
'o' 圆圈
'D' 菱形
'h' 六边形1
'H' 六边形2
'-' 水平线
'8' 八边形
'p' 五边形
',' 像素
'+' 加号
'None' 无
'.' 点
's' 正方形
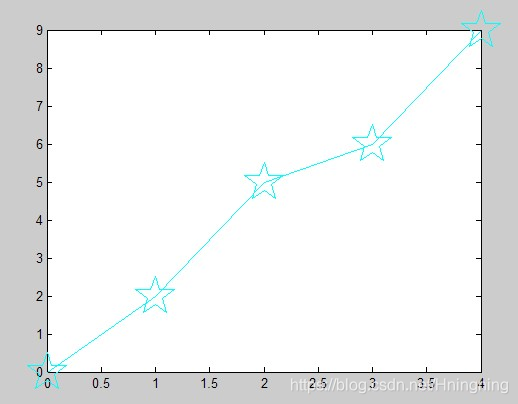
'*' 星号
'd' 小菱形
'v' 一角朝下的三角形
'<' 一角朝左的三角形
'>' 一角朝右的三角形
'^' 一角朝上的三角形
'|' 竖线
'x' Xrc参数设置示例 1
fig,ax = plt.subplots()
#配置中文显示
plt.rcParams['font.family'] = ['SimHei']
plt.rcParams['axes.unicode_minus'] = False
def f(t):return np.cos(2 * np.pi * t)
x1 = np.arange(0.0,4.0,0.5)
x2 = np.arange(0.0,4.0,0.01)
plt.figure(1)
plt.subplot(2,2,1)
plt.plot(x1,f(x1),'bo',x2,f(x2),'k')
plt.title('子图1')
plt.subplot(2,2,2)
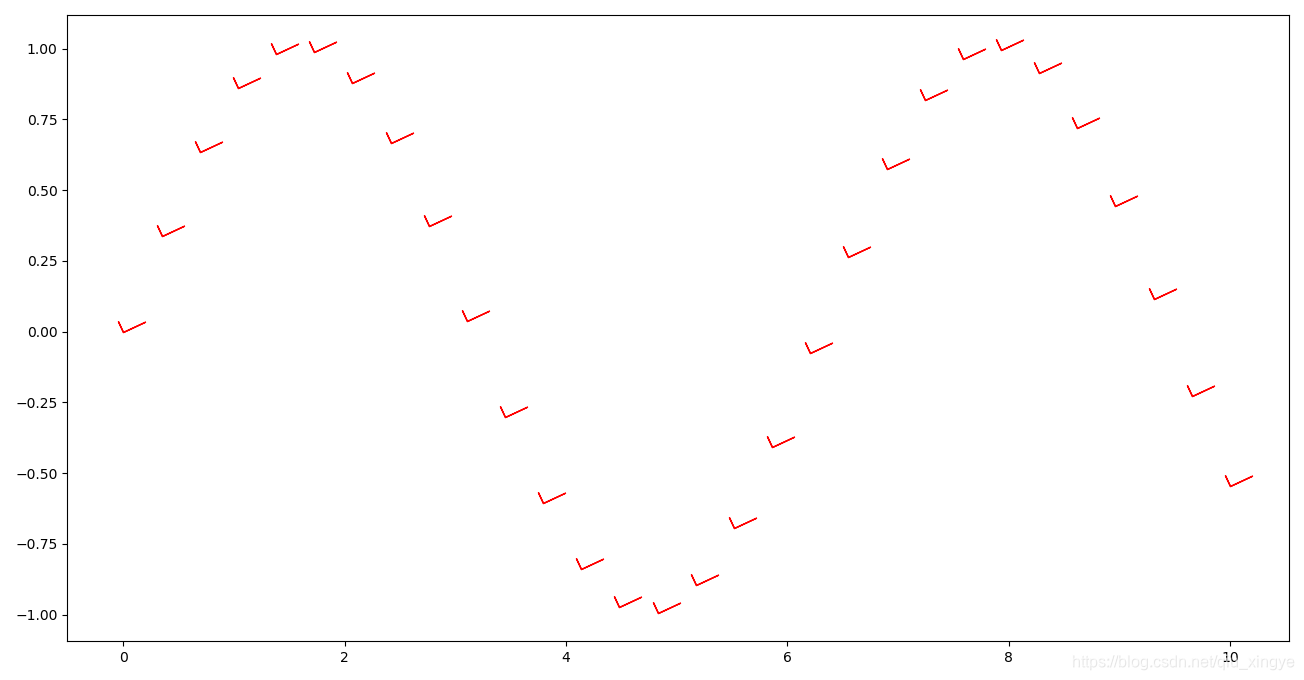
plt.plot(np.cos(2 * np.pi * x2),'r--')
plt.title('子图2')
plt.show()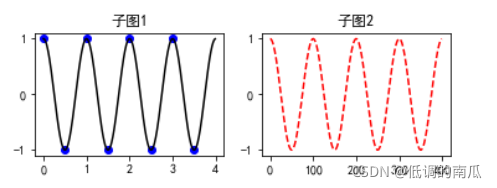
rc参数设置示例2
fig = plt.figure()
ax = fig.add_subplot(1,1,1)
ax.plot(np.random.randn(30).cumsum(),color = 'k',linestyle = 'dashed',marker = 'o',label = 'one')
ax.plot(np.random.randn(30).cumsum(),color = 'k',linestyle = 'dashed',marker = '+',label = 'two')
ax.plot(np.random.randn(30).cumsum(),color = 'k',linestyle = 'dashed',marker = 'v',label = 'three')
ax.legend(loc = 'best') 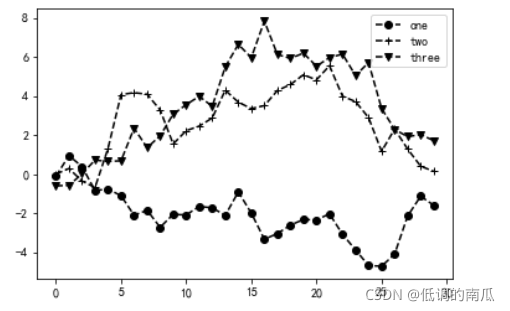
用set_xticks设置刻度
ax.set_xticks([0,5,10,15,20,25,30,35])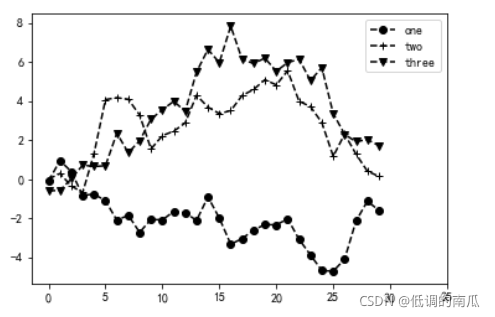
用set_sticklabels改变刻度
ax.set_xticklabels(['x1','x2','x3','x4','x5'],rotation = 30,fontsize = 'large')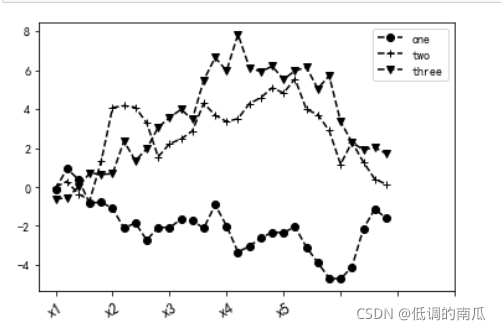
其中rotation参数表示X坐标标签的旋转角度;fontsize为字号,可以取值为“xx-small","x=small","small","mediaum" ,"large","x-large","xx-large","larger","smaller","None"


![[MATLAB学习笔记] MATLAB里 ‘Markersize’ 设置的值是‘Marker_size’](https://img-blog.csdnimg.cn/img_convert/e8db4ee41707913d00e19d99fbc196c3.png)