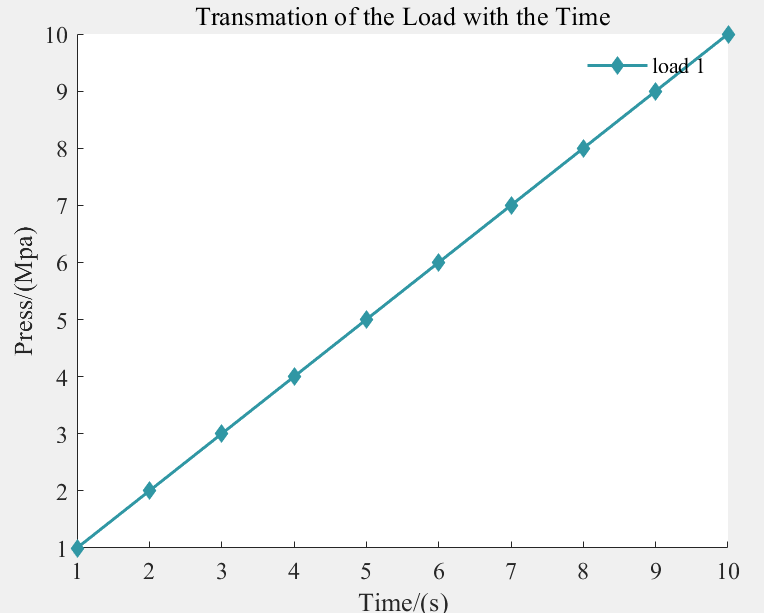
MATLAB 绘制折线图
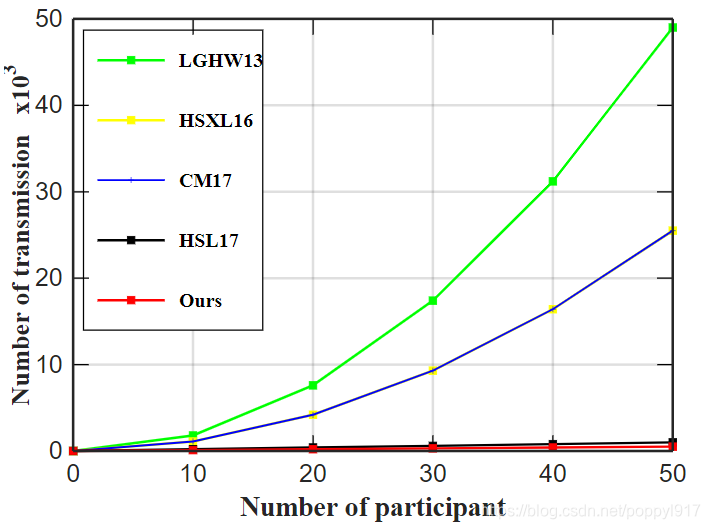
想要绘制出如上图所示折线图,首先,先展示代码:
x=0:10:50;
a=[0, 1.80,7.60,17.40,31.20,49.00]
plot(x,a,'s-g','MarkerSize',2,'MarkerFaceColor','g','MarkerEdgeColor','g','LineWidth',2);
grid
b=[0,1.10,4.20,9.30,16.40,25.50];
hold on
plot(x,b,'s-y','MarkerSize',2,'MarkerFaceColor','y','MarkerEdgeColor','y','LineWidth',2);
c=[0,1.10,4.20,9.30,16.40,25.50];
hold on
plot(x,c,'+-b','MarkerSize',1.5,'MarkerFaceColor','b','MarkerEdgeColor','b','LineWidth',1.5);
d=[0,0.20,0.40,0.60,0.80,1.00]
hold on
plot(x,d,'s-k','MarkerSize',2,'MarkerFaceColor','k','MarkerEdgeColor','k','LineWidth',2);
e=[0,0.10,0.20,0.30,0.40,0.50]
hold on
plot(x,e,'s-r','MarkerSize',2,'MarkerFaceColor','r','MarkerEdgeColor','r','LineWidth',2)
xlabel('Number of participant','fontsize',22,'FontWeight','bold','FontName','Times New Roman')
ylabel('Number of transmission   x10^3','fontsize',21,'FontWeight','bold','FontName','Times New Roman')
h=legend('LGHW13','HSXL16','CM17','HSL17','Ours',loc = 0)
set(h,'Fontsize',16,'FontWeight','bold','FontName','Times New Roman');
set(gca,'FontSize',20,'LineWid',2);%设置坐标轴字体打下以及网格粗细
- 设置x轴的数值:0到50 ,间隔为10
- a相当于第一个函数y值,b第二个函数y值,依次类推。
- grid 是绘制后面的格子,grid on 有格子,grid off 没有格子
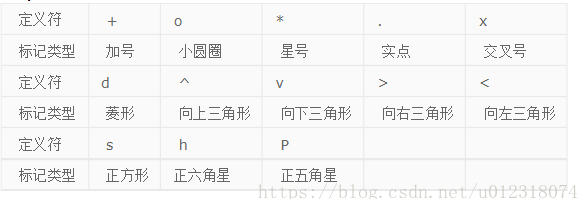
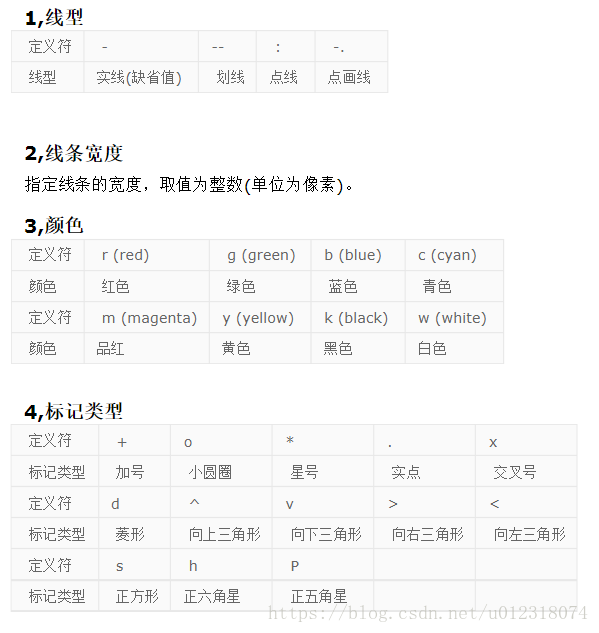
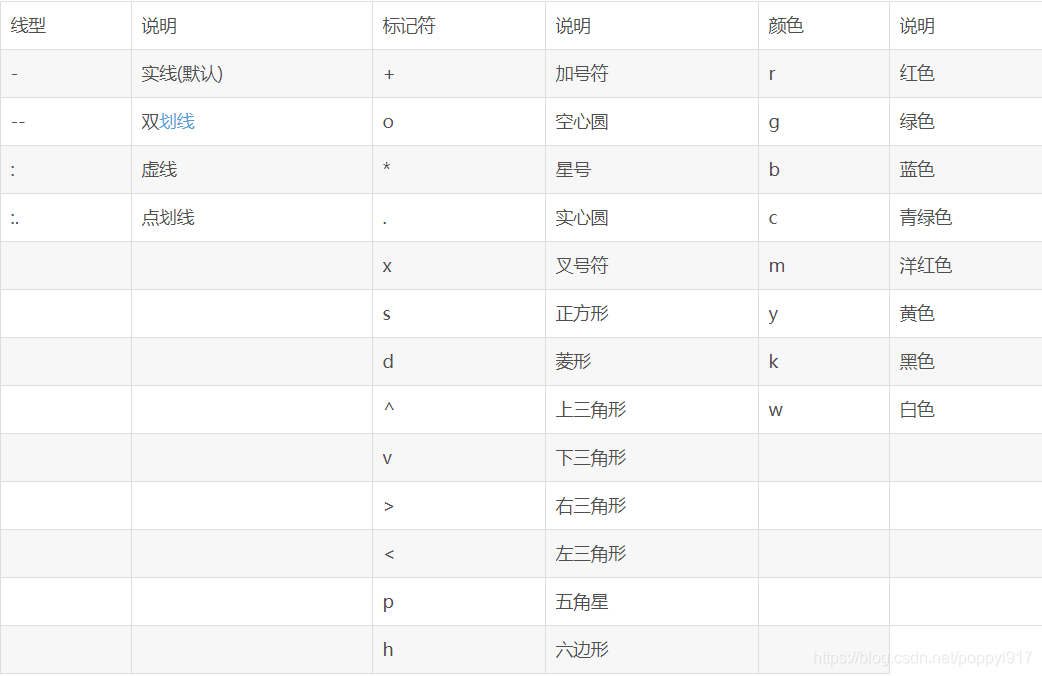
- plot 是开始绘制,前两个参数是x 和y, 第三个参数是曲线的样式颜色,第四个是说曲线上的方块圆等的大小,下一个是说标志点的内填充颜色,下一个是边缘填充颜色。
- xlabel 是设置x坐标轴标题的,包括文字的内容,大小,样式等等。
- ylabel 是设置y坐标轴标题的,
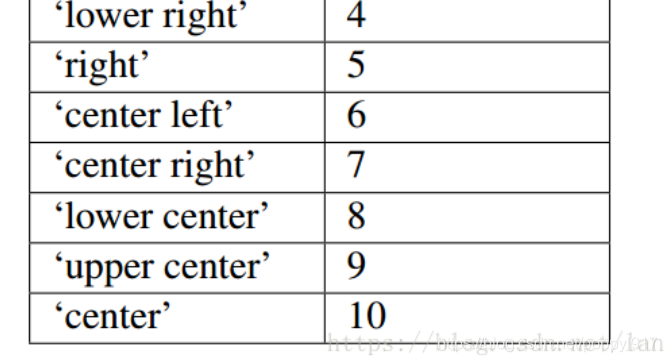
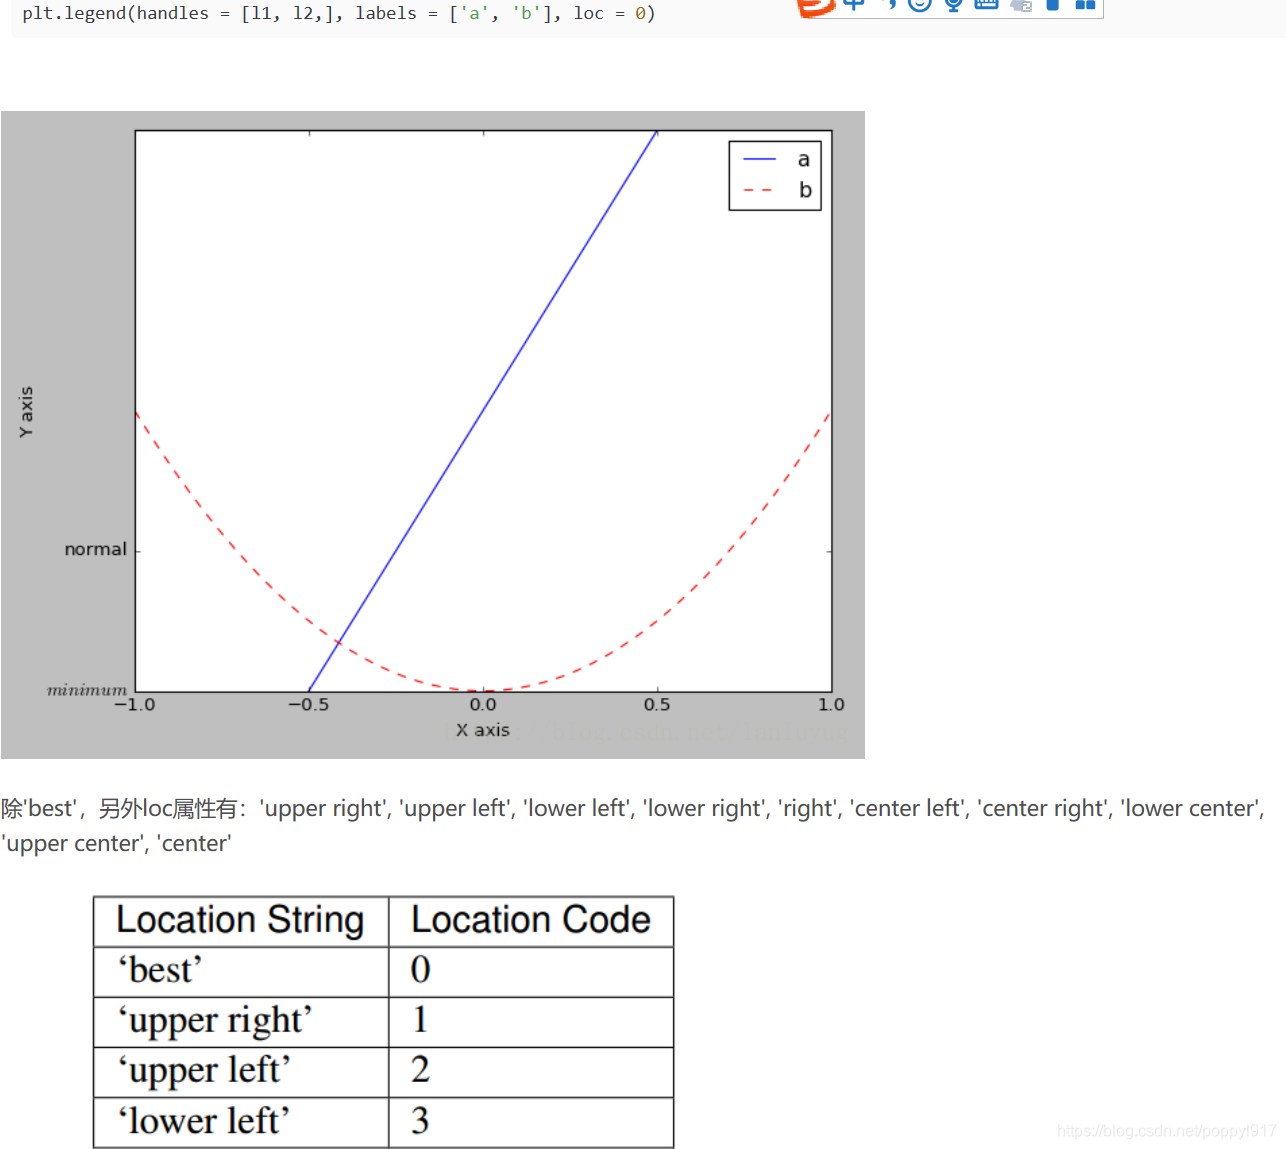
- 设置legend图例 ,其中的loc表示图例的位置,这个需要自己试试。
'best'         : 0, (only implemented for axes legends)(自适应方式)
'upper right'  : 1,
'upper left'   : 2,
'lower left'   : 3,
'lower right'  : 4,
'right'        : 5,
'center left'  : 6,
'center right' : 7,
'lower center' : 8,
'upper center' : 9,
'center'       : 10,
---------------------
原文:https://blog.csdn.net/You_are_my_dream/article/details/53440964 - 图例中一行set是对图例中文字的说明。
- 最后一行是设置坐标轴上刻度字体大小,LineWid 是设置网格的粗细。
附上论文中两图代码,以供回忆
x=0:10:50;
a=[0,
1.80,
7.60,
17.40,
31.20,
49.00]
plot(x,a,'s-g','MarkerSize',2,'MarkerFaceColor','g','MarkerEdgeColor','g','LineWidth',2);grid
b=[0,
1.10,
4.20,
9.30,
16.40,
25.50];
hold on
plot(x,b,'s-y','MarkerSize',2,'MarkerFaceColor','y','MarkerEdgeColor','y','LineWidth',2);
c=[0,
1.10,
4.20,
9.30,
16.40,
25.50
];
hold on
plot(x,c,'+-b','MarkerSize',1.5,'MarkerFaceColor','b','MarkerEdgeColor','b','LineWidth',1.5);
d=[0,
0.20,
0.40,
0.60,
0.80,
1.00
]
hold on
plot(x,d,'s-k','MarkerSize',2,'MarkerFaceColor','k','MarkerEdgeColor','k','LineWidth',2);
e=[0,
0.10,
0.20,
0.30,
0.40,
0.50
]
hold onplot(x,e,'s-r','MarkerSize',2,'MarkerFaceColor','r','MarkerEdgeColor','r','LineWidth',2)
xlabel('Number of participant','fontsize',22,'FontWeight','bold','FontName','Times New Roman')
ylabel('Number of transmission   x10^3','fontsize',21,'FontWeight','bold','FontName','Times New Roman')
h=legend('LGHW13','HSXL16','CM17','HSL17','Ours','FontSize',12,loc = 0)
set(h,'Fontsize',16,'FontWeight','bold','FontName','Times New Roman');
set(gca,'FontSize',20,'LineWid',2);%设置坐标轴字体打下以及网格粗细x=0:10:50;
a=[0,
1.80,
7.60,
17.40,
31.20,
49.00]
plot(x,a,'s-g','MarkerSize',2,'MarkerFaceColor','g','MarkerEdgeColor','g','LineWidth',2);
grid on
b=[0,
1.10,
4.20,
9.30,
16.40,
25.50];
hold on
plot(x,b,'s-y','MarkerSize',2,'MarkerFaceColor','y','MarkerEdgeColor','y','LineWidth',2);
c=[0,
1.10,
4.20,
9.30,
16.40,
25.50
];
hold on
plot(x,c,'+-b','MarkerSize',1.5,'MarkerFaceColor','b','MarkerEdgeColor','b','LineWidth',1.5);
d=[0,
0.20,
0.40,
0.60,
0.80,
1.00]
hold on
plot(x,d,'s-k','MarkerSize',2,'MarkerFaceColor','k','MarkerEdgeColor','k','LineWidth',2);
e=[0.5
0.055
0.105
0.155
0.205
0.255]
hold on
plot(x,e,'s-r','MarkerSize',2,'MarkerFaceColor','r','MarkerEdgeColor','r','LineWidth',2)
xlabel('Number of participant','fontsize',22,'FontWeight','bold','FontName','Times New Roman')
ylabel('Number of measurement x10^3','fontsize',21,'FontWeight','bold','FontName','Times New Roman')
h=legend('LGHW13','HSXL16','CM17','HSL17','Ours','FontSize',12,loc = 0)
set(h,'Fontsize',16,'FontWeight','bold','FontName','Times New Roman');
set(gca,'FontSize',20,'LineWid',2);修改后的第二个x=0:10:50;
a=[0,
1.80,
7.60,
17.40,
31.20,
49.00]
plot(x,a,'s-g','MarkerSize',2,'MarkerFaceColor','g','MarkerEdgeColor','g','LineWidth',2);
grid on
b=[0,
1.10,
4.20,
9.30,
16.40,
25.50];
hold on
plot(x,b,'s-m','MarkerSize',2,'MarkerFaceColor','m','MarkerEdgeColor','m','LineWidth',2);
c=[0,
1.10,
4.20,
9.30,
16.40,
25.50
];
hold on
plot(x,c,'+-b','MarkerSize',1.5,'MarkerFaceColor','b','MarkerEdgeColor','b','LineWidth',1.5);
d=[0,
0.20,
0.40,
0.60,
0.80,
1.00]
hold on
plot(x,d,'s-c','MarkerSize',2,'MarkerFaceColor','c','MarkerEdgeColor','c','LineWidth',2);
e=[0.5
0.055
0.105
0.155
0.205
0.255]
hold on
plot(x,e,'s-r','MarkerSize',2,'MarkerFaceColor','r','MarkerEdgeColor','r','LineWidth',2)
xlabel('Number of participant','fontsize',22,'FontWeight','bold','FontName','Times New Roman')
ylabel('Number of measurement x10^3','fontsize',21,'FontWeight','bold','FontName','Times New Roman')
h=legend('LGHW13','HSXL16','CM17','HSL17','Ours','FontSize',12,loc = 0)
set(h,'Fontsize',16,'FontWeight','bold','FontName','Times New Roman');
set(gca,'FontSize',20,'LineWid',2);