在python中画散点图主要是用matplotlib模块中的scatter函数,先来看一下scatter函数的基本信息。

网址为:点击打开链接
可以看到scatter中有很多参数,经常使用的参数主要有以下几个:

c:

marker:


数据、代码和绘制的图如下。
数据(取第一列作为x,取第四列作为y)截图:

代码如下:
import matplotlib.pyplot as plt
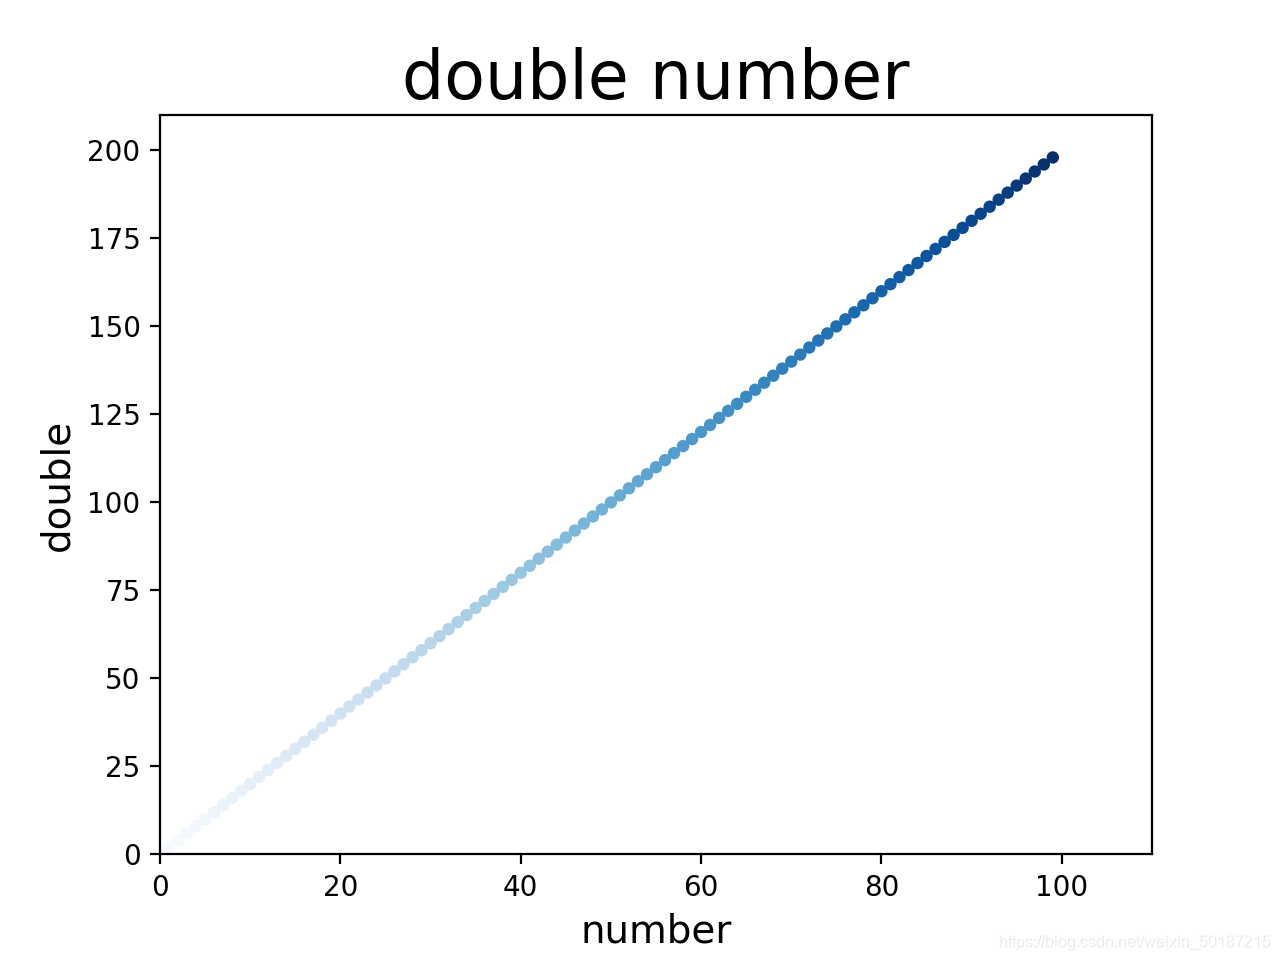
import numpy as np# 定义画散点图的函数
def draw_scatter(n, s):""":param n: 点的数量,整数:param s:点的大小,整数:return: None"""# 加载数据data = np.loadtxt('results.txt', encoding='utf-8', delimiter=',')# 通过切片获取横坐标x1x1 = data[:, 0]# 通过切片获取纵坐标Ry1 = data[:, 3]# 横坐标x2x2 = np.random.uniform(0, 5, n)# 纵坐标y2y2 = np.array([3] * n)# 创建画图窗口fig = plt.figure()# 将画图窗口分成1行1列,选择第一块区域作子图ax1 = fig.add_subplot(1, 1, 1)# 设置标题ax1.set_title('Result Analysis')# 设置横坐标名称ax1.set_xlabel('gamma-value')# 设置纵坐标名称ax1.set_ylabel('R-value')# 画散点图ax1.scatter(x1, y1, s=s, c='k', marker='.')# 画直线图ax1.plot(x2, y2, c='b', ls='--')# 调整横坐标的上下界plt.xlim(xmax=5, xmin=0)# 显示plt.show()# 主模块
if __name__ == "__main__":# 运行draw_scatter(n=2000, s=20)绘制的图如下:


![[Python] 散点图(二维散点图、三维散点图、散点图矩阵)](https://img-blog.csdnimg.cn/07fecaa21d2d432f948829eee5e8b881.png?x-oss-process=image/watermark,type_ZHJvaWRzYW5zZmFsbGJhY2s,shadow_50,text_Q1NETiBA56a-5pyo6aG1,size_20,color_FFFFFF,t_70,g_se,x_16)