本文以springbootdemo-0.0.1-SNAPSHOT.jar 为例,jar内容需与idea保持一致。
1、启动命令
常规jar启动:java -jar springbootdemo-0.0.1-SNAPSHOT.jar
jar包断点调试启动:java -Xdebug -agentlib:jdwp=transport=dt_socket,server=y,suspend=n,address=5005 -jar springbootdemo-0.0.1-SNAPSHOT.jar
-Xdebug #开启调试,不添加在Linux可能无法启动监听-agentlib:jdwp=transport=dt_socket,server=y,suspend=n,address=5005 #加载本机代理库,详情参考 java -agentlib:jdwp=help
java -agentlib:jdwp=help
Java Debugger JDWP Agent Library--------------------------------(see http://java.sun.com/products/jpda for more information)jdwp usage: java -agentlib:jdwp=[help]|[<option>=<value>, ...]Option Name and Value            Description                       Default
---------------------            -----------                       -------
suspend=y|n                      wait on startup?                  y
transport=<name>                 transport spec                    none
address=<listen/attach address>  transport spec                    ""
server=y|n                       listen for debugger?              n
launch=<command line>            run debugger on event             none
onthrow=<exception name>         debug on throw                    none
onuncaught=y|n                   debug on any uncaught?            n
timeout=<timeout value>          for listen/attach in milliseconds n
mutf8=y|n                        output modified utf-8             n
quiet=y|n                        control over terminal messages    nObsolete Options
----------------
strict=y|n
stdalloc=y|nExamples
--------- Using sockets connect to a debugger at a specific address:java -agentlib:jdwp=transport=dt_socket,address=localhost:8000 ...- Using sockets listen for a debugger to attach:java -agentlib:jdwp=transport=dt_socket,server=y,suspend=y ...Notes
------ A timeout value of 0 (the default) is no timeout.Warnings
--------- The older -Xrunjdwp interface can still be used, but will be removed ina future release, for example:java -Xdebug -Xrunjdwp:[help]|[<option>=<value>, ...]
2、idea添加Remote
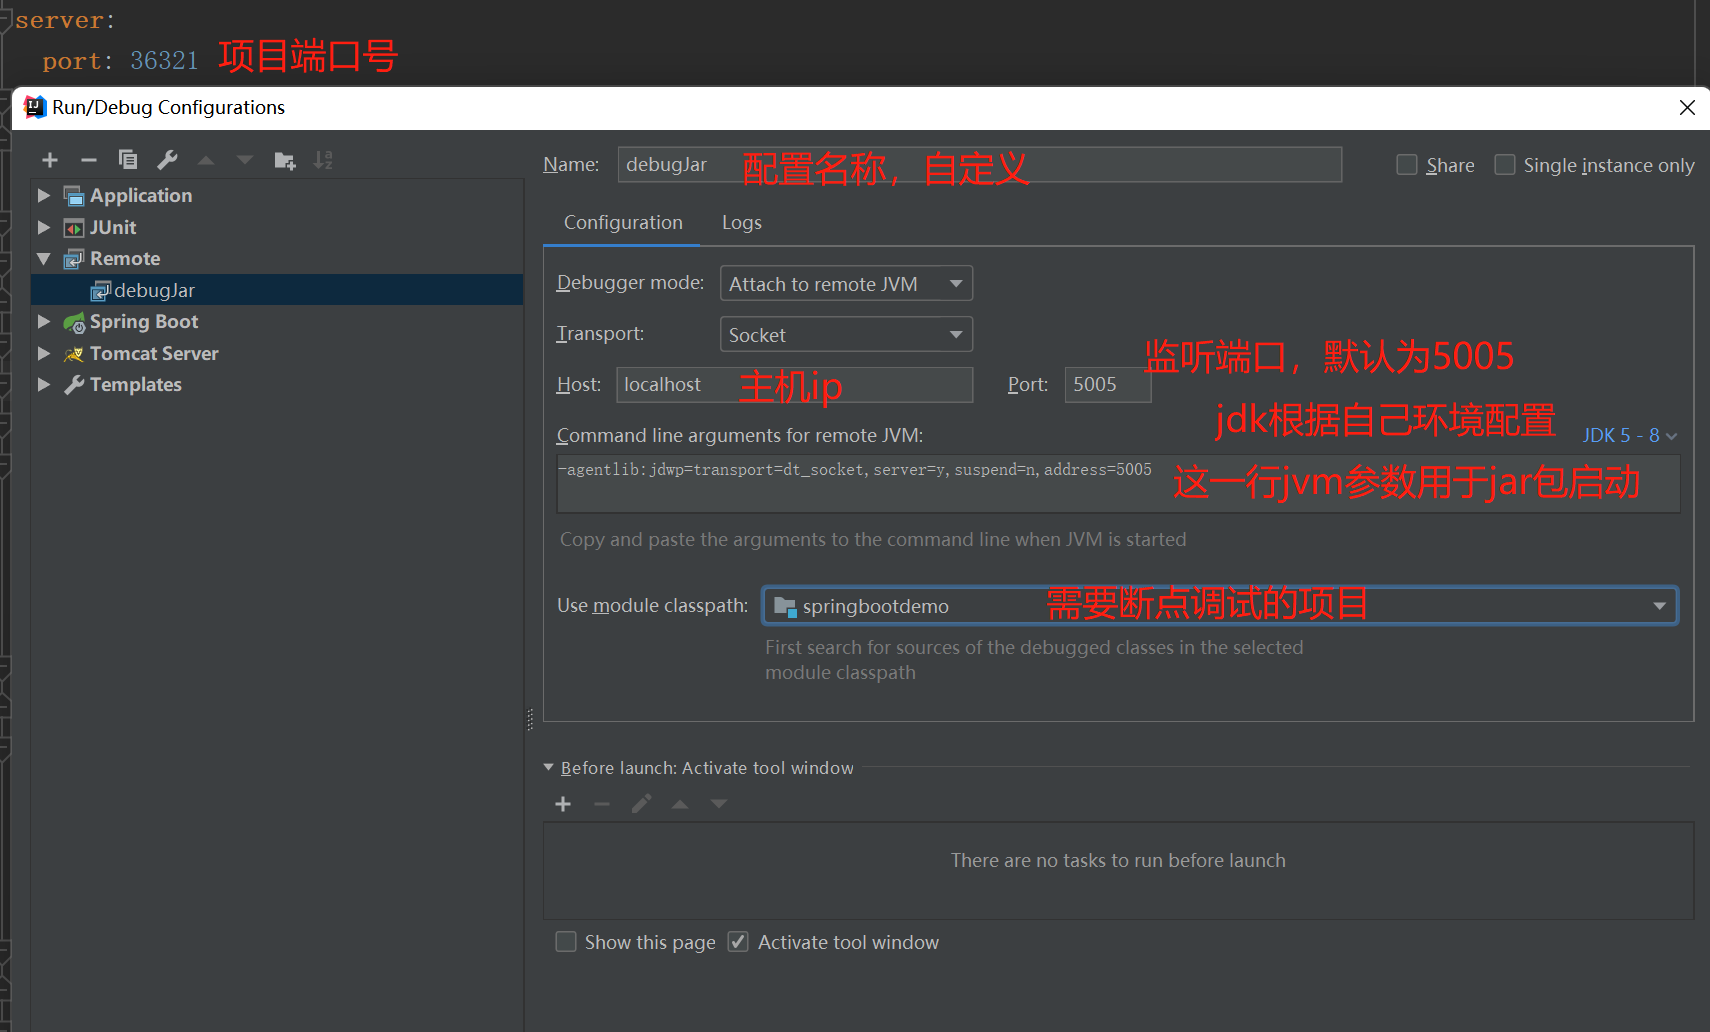
打开idea项目,依次点击 Edit Configurations -> add(+) -> Remote ,出现下图所示
Name : 配置名称,自定义。
Debugger mod : Attach to remote JVM
Transport : Socket
Host : 目标主机IP (jar部署服务器IP)
Port : Java代理监听端口 (address 参数值),默认为5005
Jdk : 根据自己部署环境配置
Command line arguments for remote JVM : -agentlib:jdwp=transport=dt_socket,server=y,suspend=n,address=5005, address值根据实际情况而定。
Use module classpath : 需要断点的项目
3、查询 address 取值
netstat -ano | findstr 端口号  # Windows查询占用端口的进程
netstat -anp | grep 端口号  # linux查询占用端口的进程jps  # 查看系统java进程# 查看java运行参数
jinfo
Usage:jinfo [option] <pid>(to connect to running process)jinfo [option] <executable <core>(to connect to a core file)jinfo [option] [server_id@]<remote server IP or hostname>(to connect to remote debug server)where <option> is one of:-flag <name>         to print the value of the named VM flag-flag [+|-]<name>    to enable or disable the named VM flag-flag <name>=<value> to set the named VM flag to the given value-flags               to print VM flags-sysprops            to print Java system properties<no option>          to print both of the above-h | -help           to print this help message
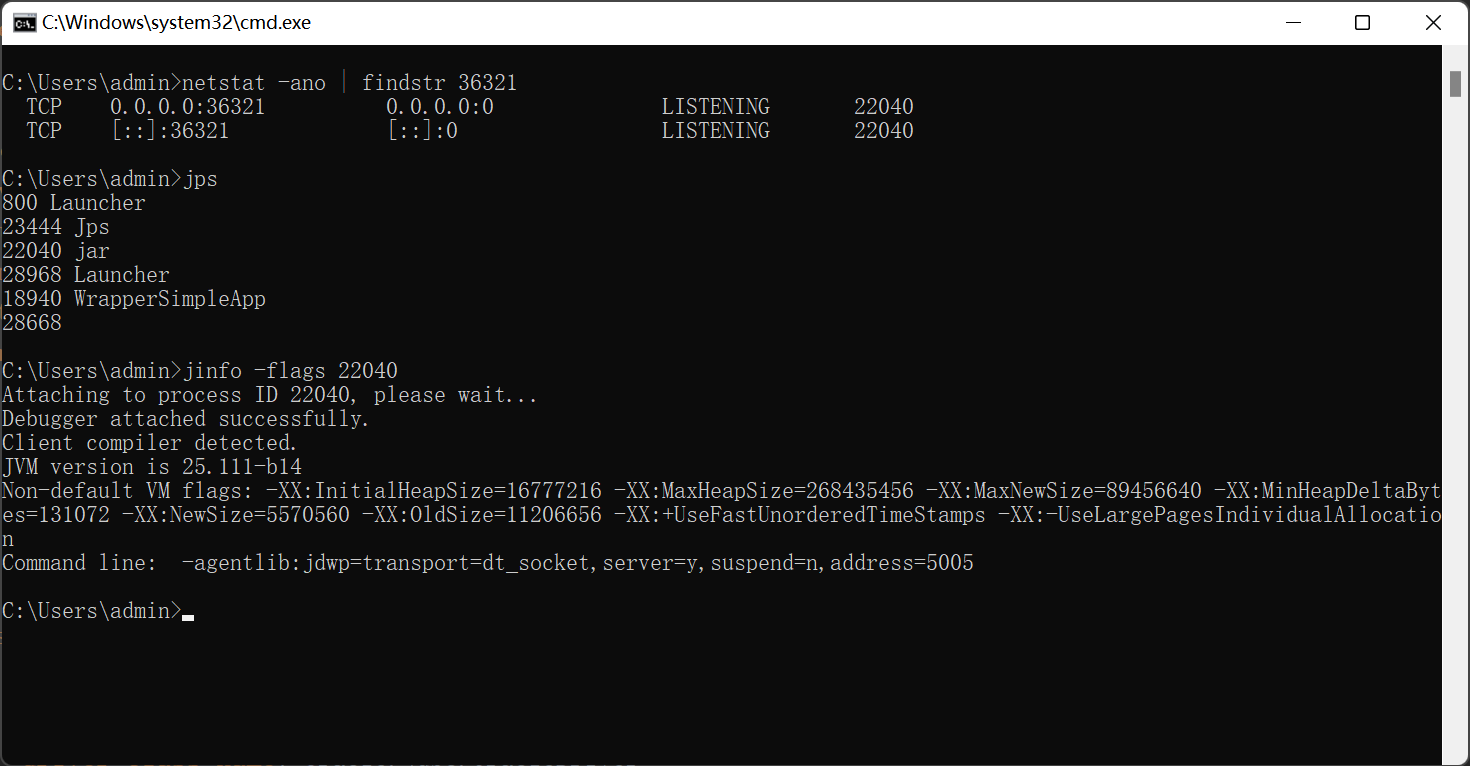
假定Java 进程端口号为 36321
1、Windows使用 netstat -ano | findstr 36321 查询端口占用进程,Linux使用netstat -anp | grep 36123查询端口占用进程,如果不确定端口号的话也可以通过jps查询出所有Java进程从中找出对应进程,查得进程号 22040
2、jinfo -flags 22040 查询Java运行参数。查得Command line 中 address = 5005
4、开放debug端口
进行远程调试时,需关闭防火墙或开放对应端口如:5005,如果是使用云服务器要在管理规则中开放端口
以centos和腾讯云为例
1、开放防火墙
systemctl status firewalld.service   #查看防火墙状态#如果不想配置防火墙,可以直接关闭防火墙
systemctl stop firewalld.service # 不关闭防火墙的情况下需开放对应端口,建议开启防火墙
firewall-cmd --zone=public --list-ports  #查看防火墙开放端口
firewall-cmd --add-port=5005/tcp --permanent  #永久开放5005端口
systemctl restart firewalld.service  # 重启防火墙使得配置生效
2、云服务器开放端口
注意:centos防火墙与云服务器防火墙并不互通, 两者都需开放对应端口。无论centos服务器防火墙是否开启,云服务器都需开放对应端口。
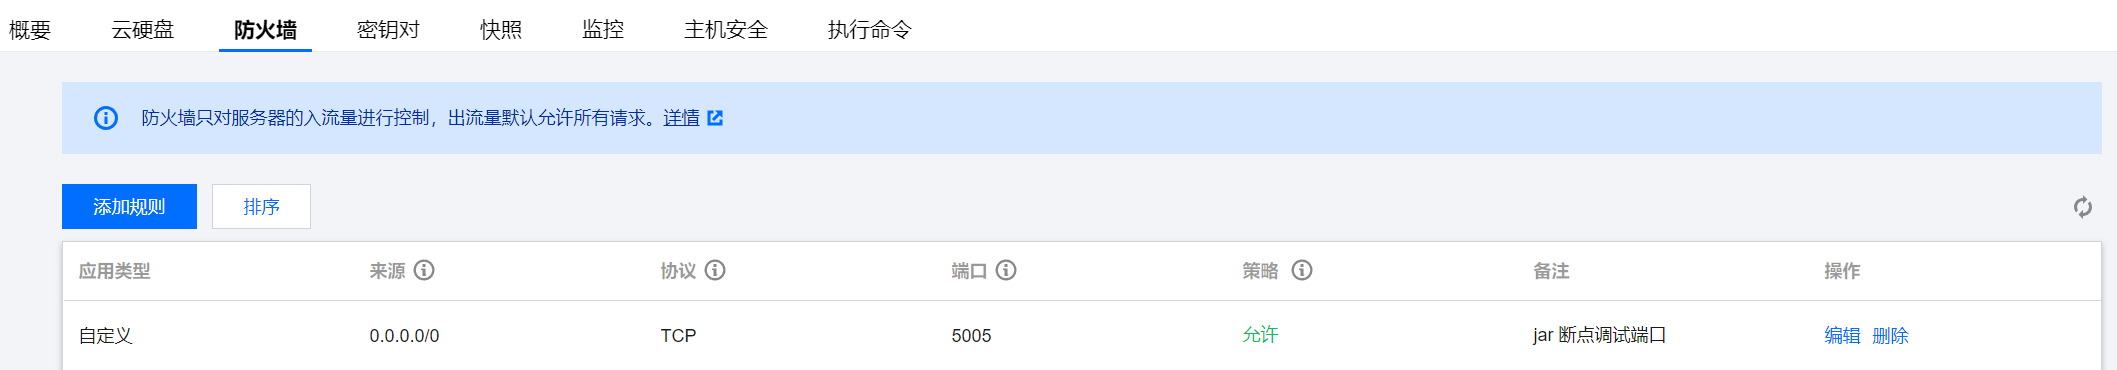
在云服务器防火墙中添加规则,添加后如下图所示
5、开启本地断点进程
假设目标IP为 127.0.0.1。
1 、使用telnet 127.0.0.1 5005 查看远程端口是否可用,如果不可用那可能是防火墙未设置或设置有误,检查一下。
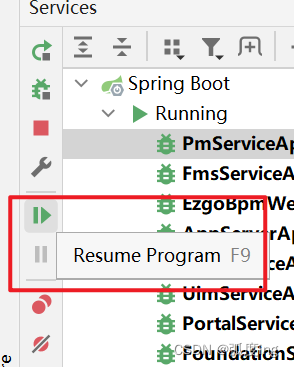
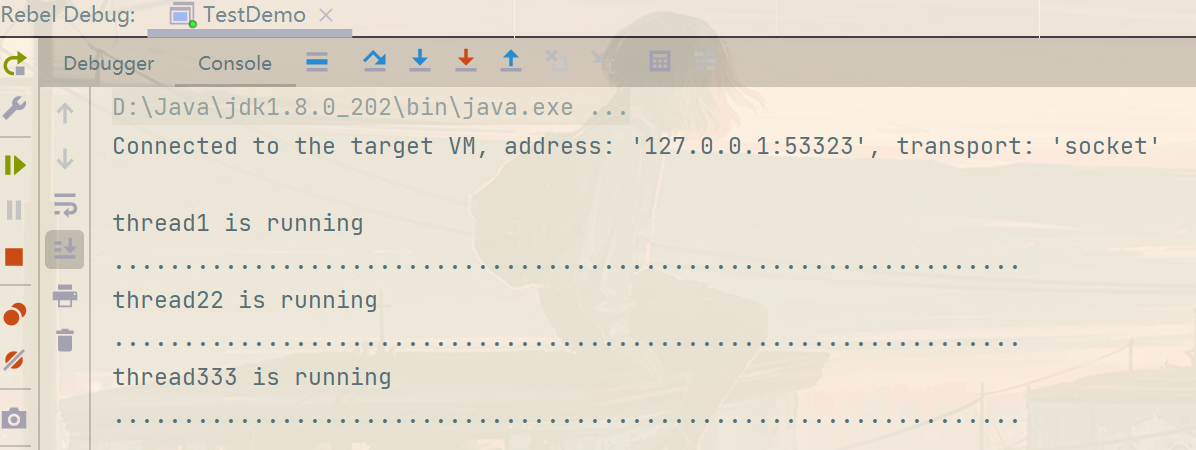
2、idea中启动 添加的remote (debugJar),可以在控制台看到打印
Connected to the target VM, address: '127.0.0.1:5005', transport: 'socket' ,接下来就和本地断点一样了,在对应的代码行添加断点,访问远端项目,可以看到服务进入到对应断点。
](https://img-blog.csdnimg.cn/7b4b2be15b614cb2b7f21adbda58d18a.png)