S变换的Matlab代码
- S变换简介
- Stockwell版S变换程序
- Dash版S变换程序
- 博主自己编写的S变换
- 主函数
- 仿真结果
S变换简介
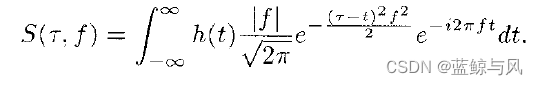
S变换,又称为Stockwell变换,由R. G. Stockwell于1996年提出。具体的定义如下:
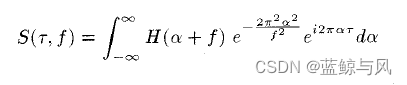
S变换在傅里叶域的表示形式为:
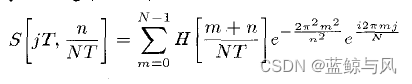
离散的S变换为:
S变换克服了短时傅里叶变换固定窗函数宽度的缺陷,采用了一个随频率变化的高斯窗函数。它的窗函数宽度与频率的倒数成正比,高频时用窄窗,低频用宽窗。所以具有多分辨率分析的思想,也可以看作相位校正的小波变换。
Stockwell版S变换程序
function [st, t, f] = st(timeseries, minfreq, maxfreq, samplingrate, freqsamplingrate)
% Returns the Stockwell Transform of the timeseries.
% Code by Robert Glenn Stockwell.
% Reference is "Localization of the Complex Spectrum: The S Transform"
% from IEEE Transactions on Signal Processing, vol. 44., number 4, April 1996, pages 998-1001.
%
%-------Inputs Needed------------------------------------------------
%
%   *****All frequencies in (cycles/(time unit))!******
%	"timeseries" - vector of data to be transformed
%-------Optional Inputs ------------------------------------------------
%
%"minfreq" is the minimum frequency in the ST result(Default=0)
%"maxfreq" is the maximum frequency in the ST result (Default=Nyquist)
%"samplingrate" is the time interval between samples (Default=1)
%"freqsamplingrate" is the frequency-sampling interval you desire in the ST result (Default=1)
%Passing a negative number will give the default ex.  [s,t,f] = st(data,-1,-1,2,2)
%-------Outputs Returned------------------------------------------------
%
% st     -a complex matrix containing the Stockwell transform.
%			 The rows of STOutput are the frequencies and the
%         columns are the time values ie each column is
%         the "local spectrum" for that point in time
%  t      - a vector containing the sampled times
%  f      - a vector containing the sampled frequencies
%--------Additional details-----------------------
%   %  There are several parameters immediately below that
%  the user may change. They are:
%[verbose]    if true prints out informational messages throughout the function.
%[removeedge] if true, removes a least squares fit parabola
%                and puts a 5% hanning taper on the edges of the time series.
%                This is usually a good idea.
%[analytic_signal]  if the timeseries is real-valued
%                      this takes the analytic signal and STs it.
%                      This is almost always a good idea.
%[factor]     the width factor of the localizing gaussian
%                ie, a sinusoid of period 10 seconds has a
%                gaussian window of width factor*10 seconds.
%                I usually use factor=1, but sometimes factor = 3
%                to get better frequency resolution.
%   Copyright (c) by Bob Stockwell
%   $Revision: 1.2 $  $Date: 1997/07/08% This is the S transform wrapper that holds default values for the function.
TRUE = 1;
FALSE = 0;
%%% DEFAULT PARAMETERS  [change these for your particular application]
verbose = FALSE;
removeedge = FALSE;
analytic_signal = TRUE;
factor = 1;
%%% END of DEFAULT PARAMETERS%%%START OF INPUT VARIABLE CHECK
% First:  make sure it is a valid time_series
%         If not, return the help message
if verbosedisp(' ')
end % i like a line left blankif nargin == 0if verbosedisp('No parameters inputted.')endst_helpt = 0;st = -1;f = 0;return
end% Change to column vector
if size(timeseries, 2) > size(timeseries, 1)timeseries = timeseries';
end% Make sure it is a 1-dimensional array
if size(timeseries, 2) > 1error('Please enter a *vector* of data, not matrix')return
elseif (size(timeseries) == [1, 1]) == 1error('Please enter a *vector* of data, not a scalar')return
end% use defaults for input variablesif nargin == 1minfreq = 0;maxfreq = fix(length(timeseries)/2);samplingrate = 1;freqsamplingrate = 1;
elseif nargin == 2maxfreq = fix(length(timeseries)/2);samplingrate = 1;freqsamplingrate = 1;[minfreq, maxfreq, samplingrate, freqsamplingrate] = check_input(minfreq, maxfreq, samplingrate, freqsamplingrate, verbose, timeseries);
elseif nargin == 3samplingrate = 1;freqsamplingrate = 1;[minfreq, maxfreq, samplingrate, freqsamplingrate] = check_input(minfreq, maxfreq, samplingrate, freqsamplingrate, verbose, timeseries);
elseif nargin == 4freqsamplingrate = 1;[minfreq, maxfreq, samplingrate, freqsamplingrate] = check_input(minfreq, maxfreq, samplingrate, freqsamplingrate, verbose, timeseries);
elseif nargin == 5[minfreq, maxfreq, samplingrate, freqsamplingrate] = check_input(minfreq, maxfreq, samplingrate, freqsamplingrate, verbose, timeseries);
elseif verbosedisp('Error in input arguments: using defaults')endminfreq = 0;maxfreq = fix(length(timeseries)/2);samplingrate = 1;freqsamplingrate = 1;
end
if verbosedisp(sprintf('Minfreq = %d', minfreq))disp(sprintf('Maxfreq = %d', maxfreq))disp(sprintf('Sampling Rate (time   domain) = %d', samplingrate))disp(sprintf('Sampling Rate (freq.  domain) = %d', freqsamplingrate))disp(sprintf('The length of the timeseries is %d points', length(timeseries)))disp(' ')
end
%END OF INPUT VARIABLE CHECK% If you want to "hardwire" minfreq & maxfreq & samplingrate & freqsamplingrate do it here% calculate the sampled time and frequency values from the two sampling rates
t = (0:length(timeseries) - 1) * samplingrate;
spe_nelements = ceil((maxfreq - minfreq + 1)/freqsamplingrate);
f = (minfreq + [0:spe_nelements - 1] * freqsamplingrate) / (samplingrate * length(timeseries));
if verbosedisp(sprintf('The number of frequency voices is %d', spe_nelements))
end% The actual S Transform function is here:
st = strans(timeseries, minfreq, maxfreq, samplingrate, freqsamplingrate, verbose, removeedge, analytic_signal, factor);
% this function is below, thus nicely encapsulated%WRITE switch statement on nargout
% if 0 then plot amplitude spectrum
if nargout == 0if verbosedisp('Plotting pseudocolor image')endpcolor(t, f, abs(st))
endreturn%^^^^^^^^^^^^^^^^^^^^^^^^^^^^^^^^^^^^^^^^^^^^^^^^^^^^^^^^^^^^^^^^^^^^^^^^^^^^^^^^^^^^^^
%^^^^^^^^^^^^^^^^^^^^^^^^^^^^^^^^^^^^^^^^^^^^^^^^^^^^^^^^^^^^^^^^^^^^^^^^^^^^^^^^^^^^^^
%^^^^^^^^^^^^^^^^^^^^^^^^^^^^^^^^^^^^^^^^^^^^^^^^^^^^^^^^^^^^^^^^^^^^^^^^^^^^^^^^^^^^^^
%^^^^^^^^^^^^^^^^^^^^^^^^^^^^^^^^^^^^^^^^^^^^^^^^^^^^^^^^^^^^^^^^^^^^^^^^^^^^^^^^^^^^^^
%^^^^^^^^^^^^^^^^^^^^^^^^^^^^^^^^^^^^^^^^^^^^^^^^^^^^^^^^^^^^^^^^^^^^^^^^^^^^^^^^^^^^^^function st = strans(timeseries, minfreq, maxfreq, samplingrate, freqsamplingrate, verbose, removeedge, analytic_signal, factor);
% Returns the Stockwell Transform, STOutput, of the time-series
% Code by R.G. Stockwell.
% Reference is "Localization of the Complex Spectrum: The S Transform"
% from IEEE Transactions on Signal Processing, vol. 44., number 4,
% April 1996, pages 998-1001.
%
%-------Inputs Returned------------------------------------------------
%         - are all taken care of in the wrapper function above
%
%-------Outputs Returned------------------------------------------------
%
%	ST    -a complex matrix containing the Stockwell transform.
%			 The rows of STOutput are the frequencies and the
%			 columns are the time values
%
%
%----------------------------------------------------------------------% Compute the length of the data.
n = length(timeseries);
original = timeseries;
if removeedgeif verbosedisp('Removing trend with polynomial fit')endind = [0:n - 1]';r = polyfit(ind, timeseries, 2);fit = polyval(r, ind);timeseries = timeseries - fit;if verbosedisp('Removing edges with 5% hanning taper')endsh_len = floor(length(timeseries)/10);wn = hanning(sh_len);if (sh_len == 0)sh_len = length(timeseries);wn = 1 & [1:sh_len];end% make sure wn is a column vector, because timeseries isif size(wn, 2) > size(wn, 1)wn = wn';endtimeseries(1:floor(sh_len/2), 1) = timeseries(1:floor(sh_len/2), 1) .* wn(1:floor(sh_len/2), 1);timeseries(length(timeseries)-floor(sh_len/2):n, 1) = timeseries(length(timeseries)-floor(sh_len/2):n, 1) .* wn(sh_len-floor(sh_len/2):sh_len, 1);end% If vector is real, do the analytic signalif analytic_signalif verbosedisp('Calculating analytic signal (using Hilbert transform)')end% this version of the hilbert transform is different than hilbert.m%  This is correct!ts_spe = fft(real(timeseries));h = [1; 2 * ones(fix((n - 1)/2), 1); ones(1-rem(n, 2), 1); zeros(fix((n - 1)/2), 1)];ts_spe(:) = ts_spe .* h(:);timeseries = ifft(ts_spe);
end% Compute FFT's
tic;
vector_fft = fft(timeseries);
tim_est = toc;
vector_fft = [vector_fft, vector_fft];
tim_est = tim_est * ceil((maxfreq - minfreq + 1)/freqsamplingrate);
if verbosedisp(sprintf('Estimated time is %f', tim_est))
end% Preallocate the STOutput matrix
st = zeros(ceil((maxfreq - minfreq + 1)/freqsamplingrate), n);
% Compute the mean
% Compute S-transform value for 1 ... ceil(n/2+1)-1 frequency points
if verbosedisp('Calculating S transform...')
endif minfreq == 0st(1, :) = mean(timeseries) * (1 & [1:1:n]);
elsest(1, :) = ifft(vector_fft(minfreq+1:minfreq+n).*g_window(n, minfreq, factor));
end%the actual calculation of the ST
% Start loop to increment the frequency point
for banana = freqsamplingrate:freqsamplingrate:(maxfreq - minfreq)st(banana/freqsamplingrate+1, :) = ifft(vector_fft(minfreq+banana+1:minfreq+banana+n).*g_window(n, minfreq+banana, factor));
end % a fruit loop!   aaaaa ha ha ha ha ha ha ha ha ha ha
% End loop to increment the frequency point
if verbosedisp('Finished Calculation')
end%%% end strans function%------------------------------------------------------------------------
function gauss = g_window(length, freq, factor)% Function to compute the Gaussion window for
% function Stransform. g_window is used by function
% Stransform. Programmed by Eric Tittley
%
%-----Inputs Needed--------------------------
%
%	length-the length of the Gaussian window
%
%	freq-the frequency at which to evaluate
%		  the window.
%	factor- the window-width factor
%
%-----Outputs Returned--------------------------
%
%	gauss-The Gaussian window
%% vector(1, :) = [0:length - 1];
% vector(2, :) = [-length:-1];
% vector = vector.^2;
% vector = vector * (-factor * 2 * pi^2 / freq^2);
% % Compute the Gaussion window
% gauss = sum(exp(vector));
%%
lamda=15;%5  15
p=1;%0.5
vector(1,:)=[0:length-1];
vector(2,:)=[-length:-1];
vector=vector.^2;
vector=vector*(-factor*lamda^2*pi^2/(freq.^(2*p)));
gauss=sum(lamda*freq.^p*exp(vector));%-----------------------------------------------------------------------%^^^^^^^^^^^^^^^^^^^^^^^^^^^^^^^^^^^^^^^^^^^^^^^^^^^^^^^^^^^^^^^^^^^^^^^^^^%
function [minfreq, maxfreq, samplingrate, freqsamplingrate] = check_input(minfreq, maxfreq, samplingrate, freqsamplingrate, verbose, timeseries)
% this checks numbers, and replaces them with defaults if invalid% if the parameters are passed as an array, put them into the appropriate variables
s = size(minfreq);
l = max(s);
if l > 1if verbosedisp('Array of inputs accepted.')endtemp = minfreq;minfreq = temp(1);if l > 1maxfreq = temp(2); end;if l > 2samplingrate = temp(3); end;if l > 3freqsamplingrate = temp(4); end;if l > 4if verbosedisp('Ignoring extra input parameters.')endend;endif minfreq < 0 || minfreq > fix(length(timeseries)/2);minfreq = 0;if verbosedisp('Minfreq < 0 or > Nyquist. Setting minfreq = 0.')end
end
if maxfreq > length(timeseries) / 2 || maxfreq < 0maxfreq = fix(length(timeseries)/2);if verbosedisp(sprintf('Maxfreq < 0 or > Nyquist. Setting maxfreq = %d', maxfreq))end
end
if minfreq > maxfreqtemporary = minfreq;minfreq = maxfreq;maxfreq = temporary;clear temporary;if verbosedisp('Swapping maxfreq <=> minfreq.')end
end
if samplingrate < 0samplingrate = abs(samplingrate);if verbosedisp('Samplingrate <0. Setting samplingrate to its absolute value.')end
end
if freqsamplingrate < 0 % check 'what if freqsamplingrate > maxfreq - minfreq' casefreqsamplingrate = abs(freqsamplingrate);if verbosedisp('Frequency Samplingrate negative, taking absolute value')end
end% bloody odd how you don't end a function \%^^^^^^^^^^^^^^^^^^^^^^^^^^^^^^^^^^^^^^^^^^^^^^^^^^^^^^^^^^^^^^^^^^^^^^^^^^% \
function st_help
disp(' ')
disp('st()  HELP COMMAND')
disp('st() returns  - 1 or an error message if it fails')
disp('USAGE::    [localspectra,timevector,freqvector] = st(timeseries)')
disp('NOTE::   The function st() sets default parameters then calls the function strans()')
disp(' ')
disp('You can call strans() directly and pass the following parameters')
disp(' **** Warning!  These inputs are not checked if strans() is called directly!! ****')
disp('USAGE::  localspectra = strans(timeseries,minfreq,maxfreq,samplingrate,freqsamplingrate,verbose,removeedge,analytic_signal,factor) ')disp(' ')
disp('Default parameters (available in st.m)')
disp('VERBOSE          - prints out informational messages throughout the function.')
disp('REMOVEEDGE       - removes the edge with a 5% taper, and takes')
disp('FACTOR           -  the width factor of the localizing gaussian')
disp('                    ie, a sinusoid of period 10 seconds has a ')
disp('                    gaussian window of width factor*10 seconds.')
disp('                    I usually use factor=1, but sometimes factor = 3')
disp('                    to get better frequency resolution.')
disp(' ')
disp('Default input variables')
disp('MINFREQ           - the lowest frequency in the ST result(Default=0)')
disp('MAXFREQ           - the highest frequency in the ST result (Default=nyquist')
disp('SAMPLINGRATE      - the time interval between successive data points (Default = 1)')
disp('FREQSAMPLINGRATE  - the number of frequencies between samples in the ST results')% end of st_help procedure
Dash版S变换程序
function ST=stran(h)% Compute S-Transform without for loops%%% Coded by Kalyan S. Dash %%%
%%% IIT Bhubaneswar, India %%%[~,N]=size(h); % h is a 1xN one-dimensional seriesnhaf=fix(N/2);odvn=1;if nhaf*2==Nodvn=0;
endf=[0:nhaf -nhaf+1-odvn:-1]/N;Hft=fft(h);%Compute all frequency domain Gaussians as one matrixinvfk=[1./f(2:nhaf+1)]';W=2*pi*repmat(f,nhaf,1).*repmat(invfk,1,N);G=exp((-W.^2)/2); %Gaussian in freq domain% End of frequency domain Gaussian computation% Compute Toeplitz matrix with the shifted fft(h)HW=toeplitz(Hft(1:nhaf+1)',Hft);% Exclude the first row, corresponding to zero frequencyHW=[HW(2:nhaf+1,:)];% Compute Stockwell TransformST=ifft(HW.*G,[],2); %Compute voice%Add the zero freq rowst0=mean(h)*ones(1,N);ST=[st0;ST];end
博主自己编写的S变换
function wcoefs = myst(t,Sig,freqlow,freqhigh,alpha)
%==================%
% Stockwell transform ver 1.0 (2021-09-24)
% Copyright (c) by Jinshun Shen,Xidian University
%jsshen@stu.xidian.edu.cn
%This program can not be used for commercialization without the authorization of its author
%======输入======%
%t:时间序列
% Sig: 输入信号
%freqlow,freqhigh:频率范围
%alpha:频率分辨率
%======输出======%
% wcoefs: ST变换计算结果if (nargin <= 2)error('At least 2 parameters required');endif (nargin < 5)alpha=0.05;
elseif (nargin < 4)freqhigh=log(length(t));
elseif (nargin < 3)freqlow=0;
endif size(t,1)>1%t是列向量,则转置t=t';
end
if size(Sig,1)>1%Sig是列向量,则转置Sig=Sig.';
end
% 信号的长度
SigLen = length(Sig);
% 时间的长度
TimeLen = length(t);
dt=t(2)-t(1);
fre=freqlow:alpha:freqhigh;%产生频率范围
% time=1:TimeLen;
if SigLen > TimeLen%信号长度大于时间长度,时间补0t=[t  zeros(1,SigLen-TimeLen)];
end
if SigLen < TimeLen%信号长度小于于时间长度,信号补0Sig=[Sig  zeros(1,TimeLen-SigLen)];
end
% 总频率数量
nLevel=length(fre);
% 分配计算结果的存储单元
wcoefs = zeros(nLevel,TimeLen);
temp=zeros(1,TimeLen);
for m = 1:nLevel
% 计算各频率上的ST系数
% 提取频率参数
f= fre(m);for n=1:TimeLen%计算高斯窗函数Gauss_st=(f/(sqrt(2*pi)))*exp(-0.5*(n*dt-t).^2*(f)^2).*exp(-1i*2*pi*f*t);temp(n)=trapz(t,Sig.*Gauss_st);%效率低,精度稍高end
wcoefs(m,:)=temp;
end
end
主函数
clear;
close all;
clc
%%
fs=2^9;    %采样频率
dt=1/fs;    %时间间隔
timestart=0;
timeend=4;
t=(0:(timeend-timestart)/dt-1)*dt+timestart;
k2=27;
k1=30;
f0=80;
f1=80;
y1=exp((1i)*pi*k2*t.*t+2*pi*1i*f0*t).*(t>=timestart& t<timeend);
y2=exp((1i)*pi*k1*t.*t+2*pi*1i*f1*t).*(t>=timestart& t<timeend);
y=y1+y2;frelow=0;
frehigh=256;
alpha=1;
fre=frelow:alpha:frehigh;
%%
[st_matrix_z,st_times,st_frequencies] = st(y);
myst = myst(t,y,frelow,frehigh,alpha);
fmin=0;
fmax=256;
df=1;
totalscal=(fmax-fmin)/df;
f=fmin:df:fmax-df;%预期的频率figure()
imagesc(t,f,abs(st_matrix_z));
axis([timestart timeend fmin fmax])
colormap(jet);
set(gca,'ydir','normal')
xlabel('Time(s)')
ylabel('Frequency(Hz)')
title('Stockwell Transform')figure()
imagesc(t,fre,abs(myst));
axis([timestart timeend frelow frehigh])
colormap(jet);
set(gca,'ydir','normal')
xlabel('Time(s)')
ylabel('Frequency(Hz)')
title('My Stockwell Transform')
仿真结果
第一幅图是Stockwell版S变换结果,第二幅图是博主自己写的S变换程序的结果。Stockwell版S变换结果明显优于博主的S变换结果,原因在于Stockwell版S变换程序没有使用1996年论文中的形式,它可以看出一种广义的S变换,或者称自适应的S变换。Stockwell版S变换在实际操作中不太好用,如果参数设置不合适,则无法呈现正确的结果。而博主自己写的S变换程序是严格遵循1996年论文中的形式,它可以自由的设置最低频率,最高频率,频率间隔,比较好操作,但是运行比较慢。后续,我会上传一种广义的S变换程序,它的结果如第三幅图所示。


R. G. Stockwell, L. Mansinha, and R. Lowe, “Localization of the
complex spectrum: the S transform,” IEEE transactions on signal
processing, vol. 44, no. 4, pp. 998–1001, 1996.


![微信开发者工具预览/真机调试报错SyntaxError: Invalid or unexpected token [1.06.2210310][win32-x64]](https://img-blog.csdnimg.cn/7f4cfa171bab4b5e9c16c5d16ba4f8ea.png)