“ 引言部分,总领全篇文章的中心内容。”
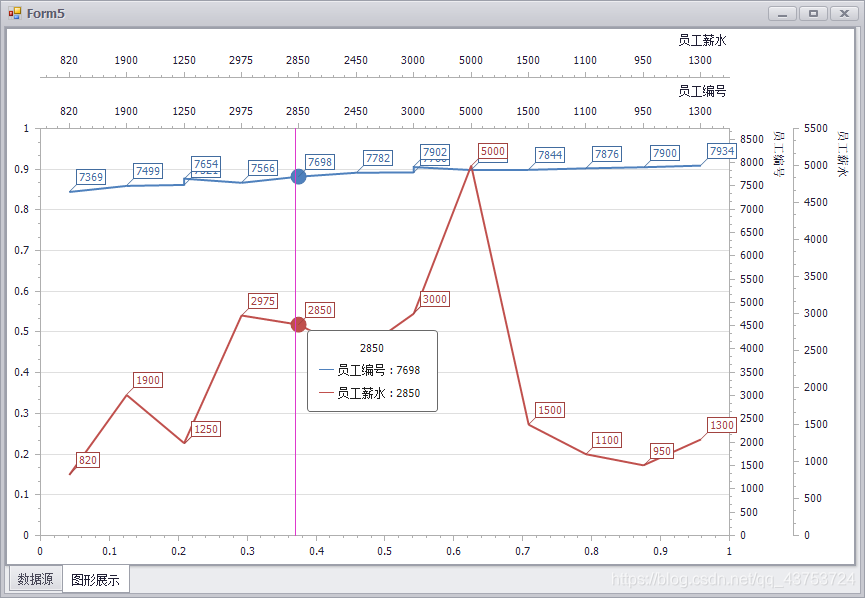
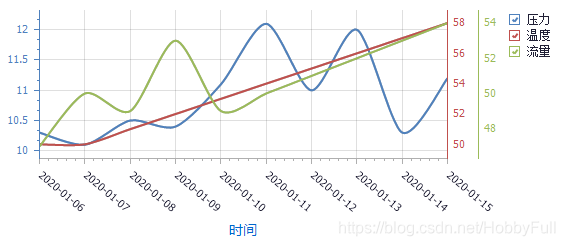
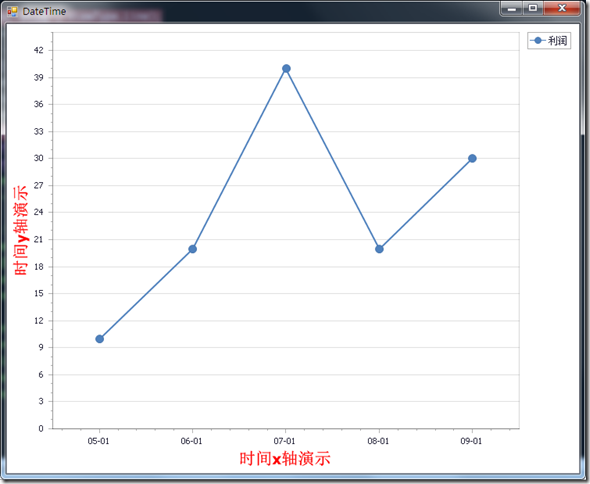
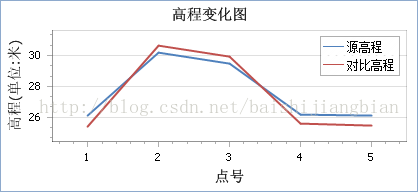
WPF的DevExpress ChartControl是一种功能强大的可视化工具,可帮助您将数据显示为二维或伪三维条形图、区域、线和许多其他形式。
01
—
将数据绑定到Chart Series
Step 1. 创建新项目并添加图表
创建一个新的WPF应用程序项目。将其命名为第1课BindCharttoData。
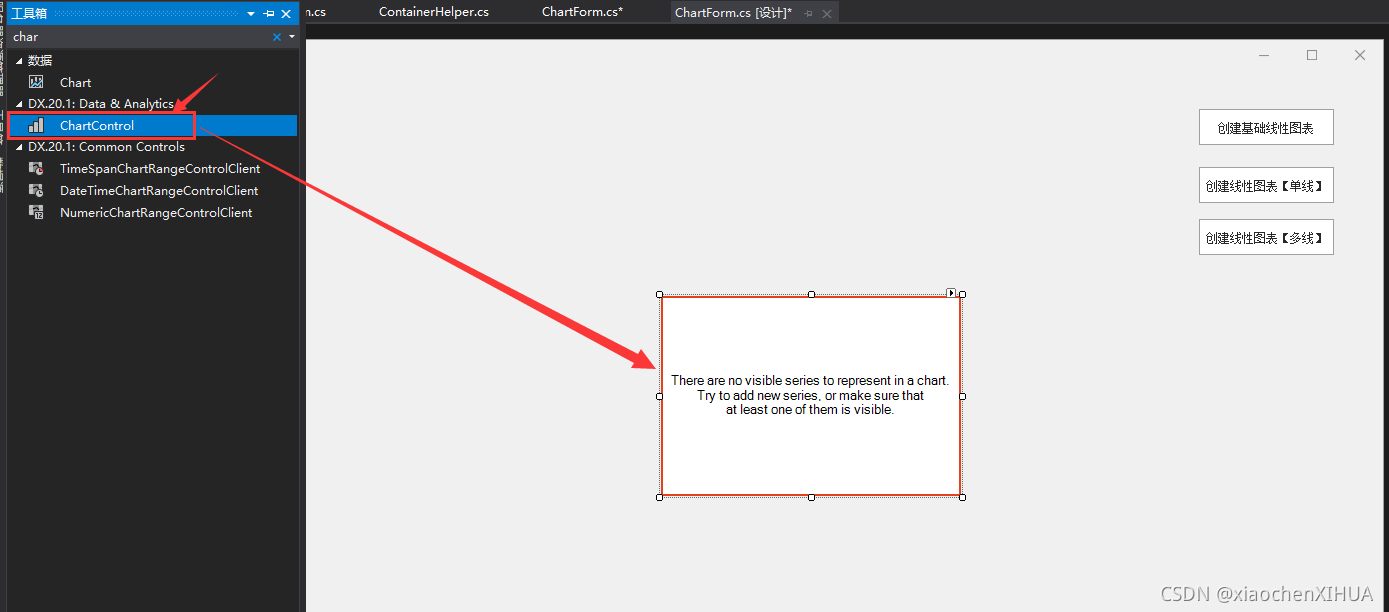
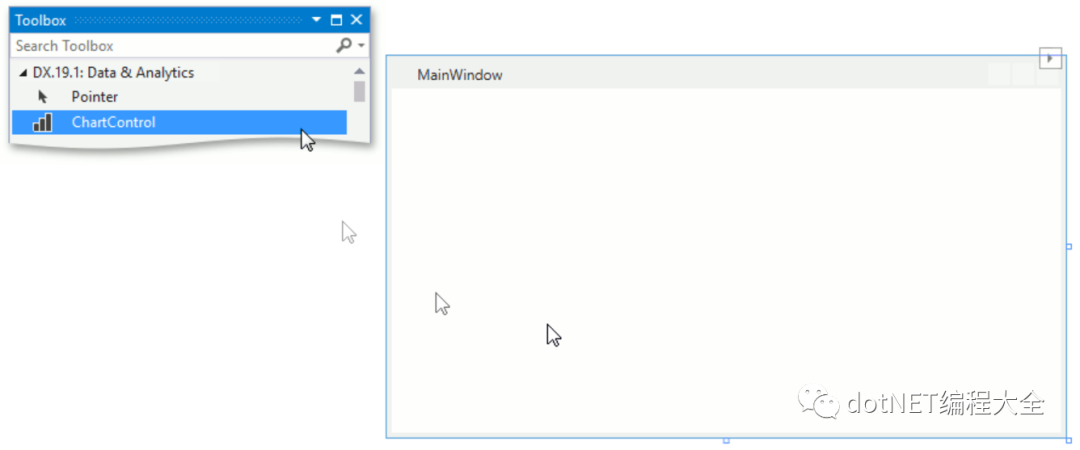
将ChartControl组件从DX.21.2:数据和分析工具箱部分拖动到主窗口。
右键单击图表控件并在关联菜单中选择Layout | Reset All 以使图表填充整个窗口。
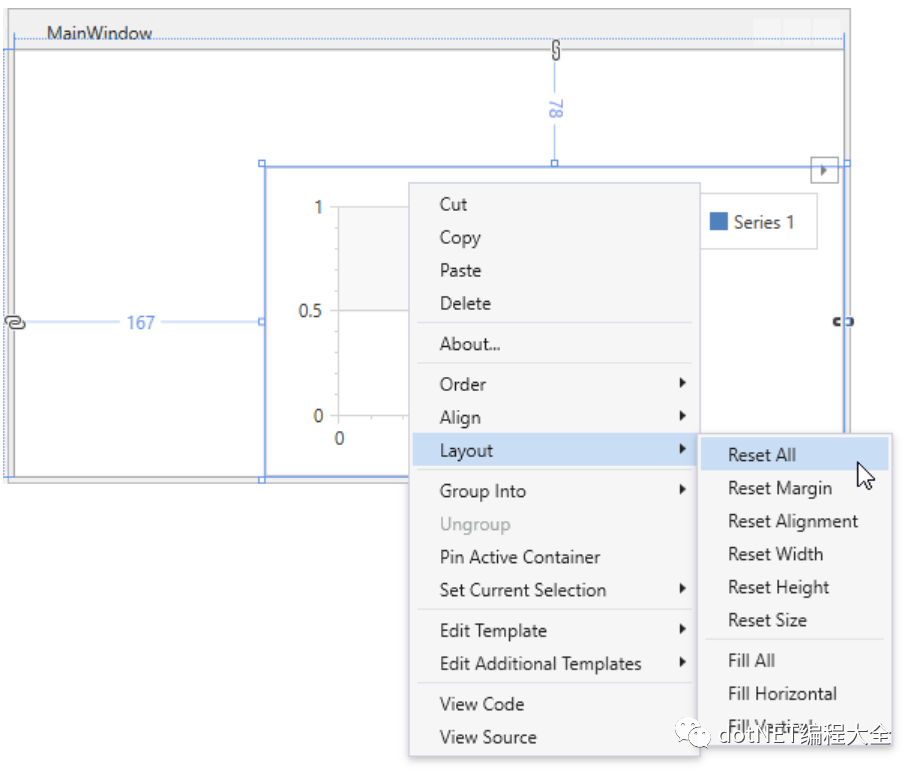
新创建的图表包含一个空白的并排条形图和一个图例。主窗口的标记应如下所示:
<Windowxmlns="http://schemas.microsoft.com/winfx/2006/xaml/presentation"xmlns:x="http://schemas.microsoft.com/winfx/2006/xaml"xmlns:d="http://schemas.microsoft.com/expression/blend/2008"xmlns:mc="http://schemas.openxmlformats.org/markup-compatibility/2006"xmlns:local="clr-namespace:Lesson1BindChartToData"xmlns:dxc="http://schemas.devexpress.com/winfx/2008/xaml/charts" x:Class="Lesson1BindChartToData.MainWindow"mc:Ignorable="d"Title="MainWindow" Height="315" Width="560"><Grid><dxc:ChartControl><dxc:ChartControl.Legends><dxc:Legend/></dxc:ChartControl.Legends><dxc:XYDiagram2D><dxc:BarSideBySideSeries2D DisplayName="Series 1"/></dxc:XYDiagram2D></dxc:ChartControl></Grid>
</Window>
对以下库的引用将自动添加到项目中:
DevExpress.Data.v21.2
DevExpress.Xpf.Core.v21.2
DevExpress.Charts.v21.2.Core
DevExpress.Xpf.Charts.v21.2
DevExpress.Mvvm.v21.2
DevExpress.Xpf.Printing.v21.2
DevExpress.Printing.v21.2.Core
注意:
这些引用是从全局程序集缓存(GAC)中选择的。要在本地复制它们或在以后的产品安装中包含它们,请使用以下目录:
C:\ProgramFiles(x86)\DevExpress 21.2\Components\Bin\Framework\Step 2. 准备数据模型
您可以将图表绑定到数据库、XML文件或运行时创建的数据。数据源应该实现IEnumerable, IListSource 或者他们的后代。有关如何用数据填充图表的更多信息,请参阅提供数据部分。在本主题中,您将图表绑定到ObservableCollection<T>.
使用DataPoint类实现开发数据模型:
using System.Collections.ObjectModel;
using System.Windows;namespace Lesson1BindChartToData {public class DataPoint {public string Argument { get; set; }public double Value { get; set; }public static ObservableCollection<DataPoint> GetDataPoints() {return new ObservableCollection<DataPoint> {new DataPoint { Argument = "Asia", Value = 5.289D},new DataPoint { Argument = "Australia", Value = 2.2727D},new DataPoint { Argument = "Europe", Value = 3.7257D},new DataPoint { Argument = "North America", Value = 4.1825D},new DataPoint { Argument = "South America", Value = 2.1172D}};}}
}
Step 3. 添加ViemModel
使用以下代码实现MainWindowViewModel类:
using System.Collections.ObjectModel;
using System.Windows;namespace Lesson1BindChartToData {public class MainWindowViewModel {public ObservableCollection<DataPoint> Data { get; private set; }public MainWindowViewModel() {this.Data = DataPoint.GetDataPoints();}}
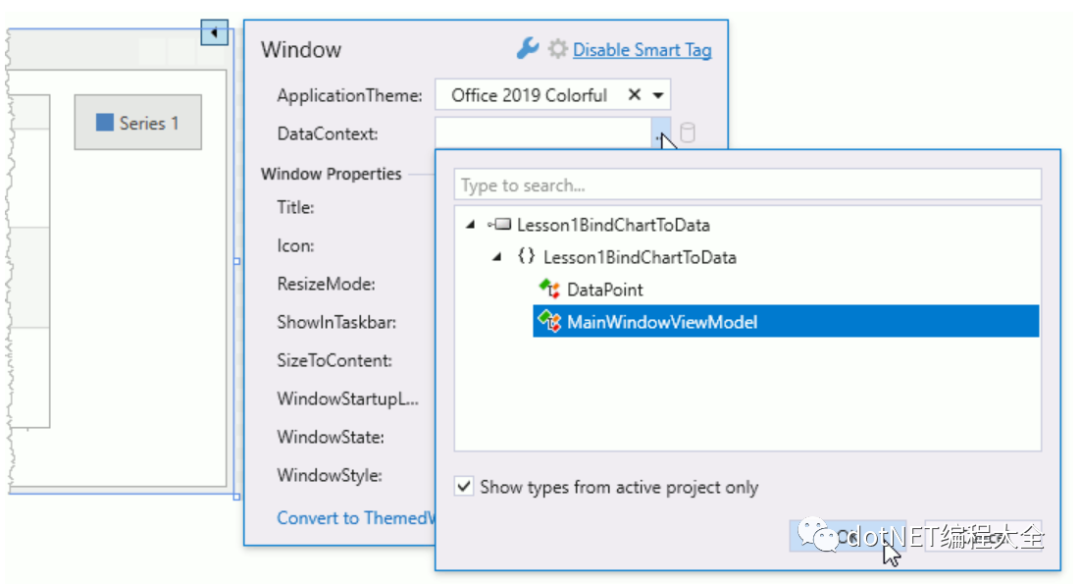
}Step 4. 指定Data Context
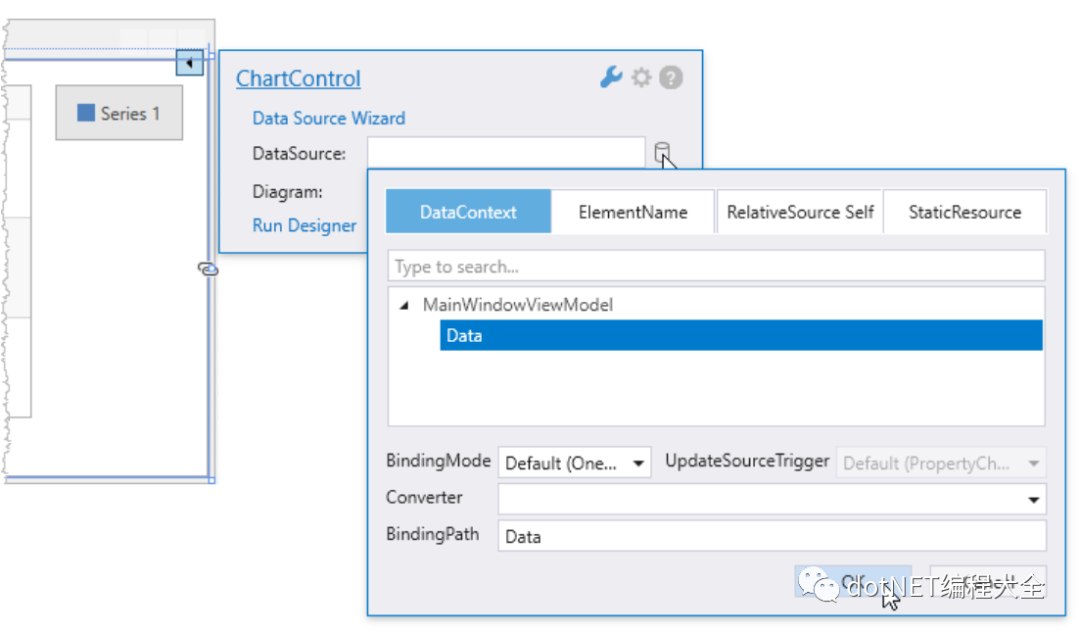
Step 5. 绑定数据给图表
单击图表控件的智能标记。指定ChartControl.DataSource属性,如下图所示:
Step 6. 用数据填充序列
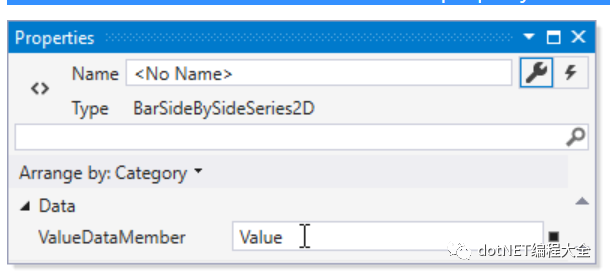
指定应为系列点参数和值提供值的数据源字段。
将序列的series.ArgumentDataMember属性设置为参数。
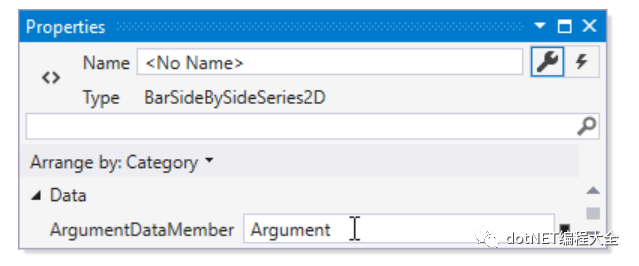
将序列的series.ValueDataMember属性设置为Value。
Step 7. 自定义图表
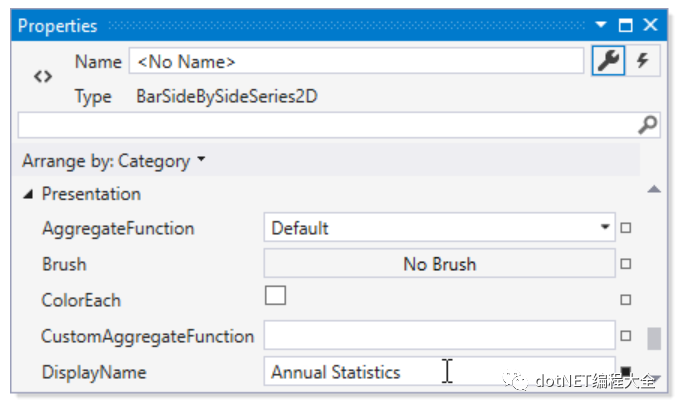
指定序列名称
将Series.DisplayName属性设置为年度统计信息。显示名称标识图例中的系列。
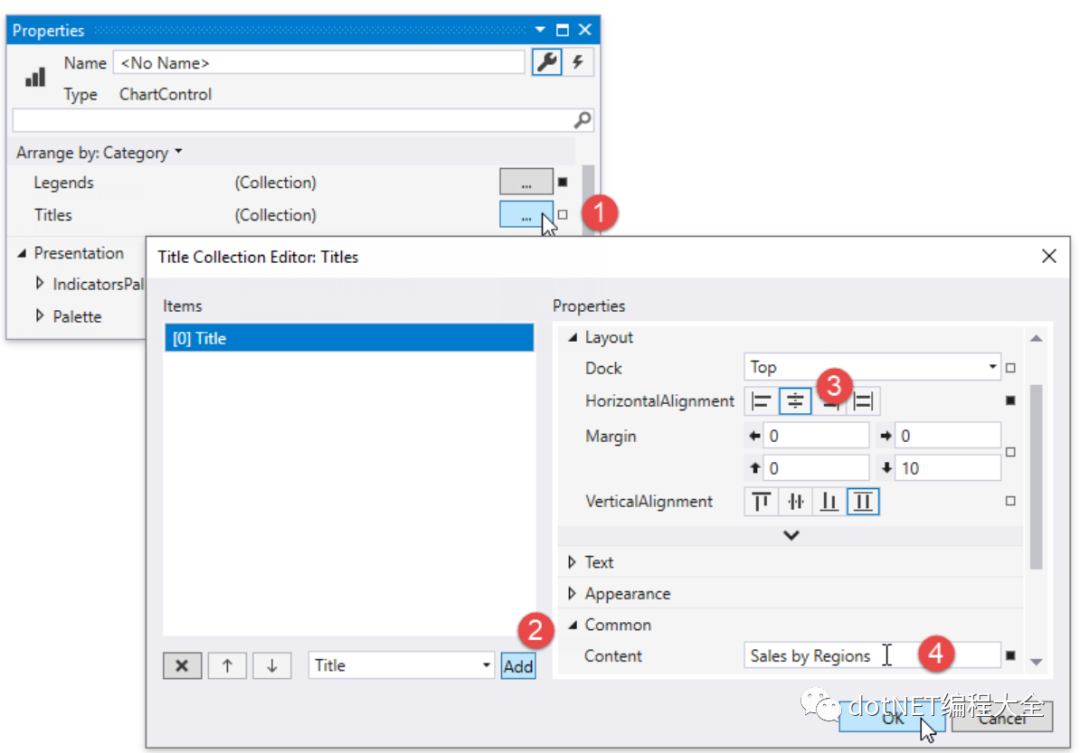
添加图表标题并自定义其位置
单击图表控件标题属性的省略号按钮以调用标题集合编辑器。使用“添加”按钮创建新标题并将其添加到图表中。
将TitleBase.HorizontalAlignment属性设置为“中心”。
定义标题库。按地区销售的内容。单击“确定”。
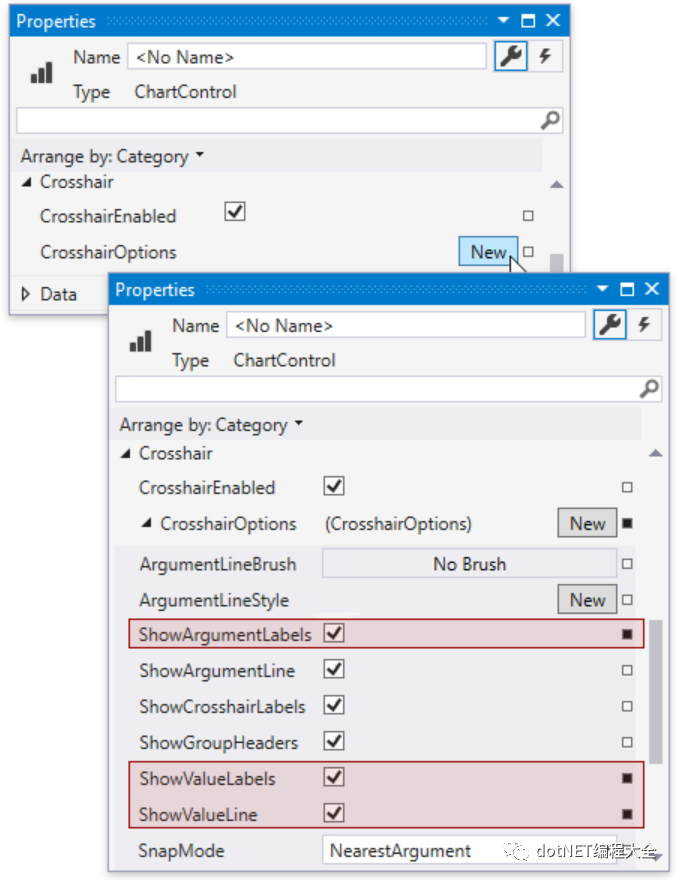
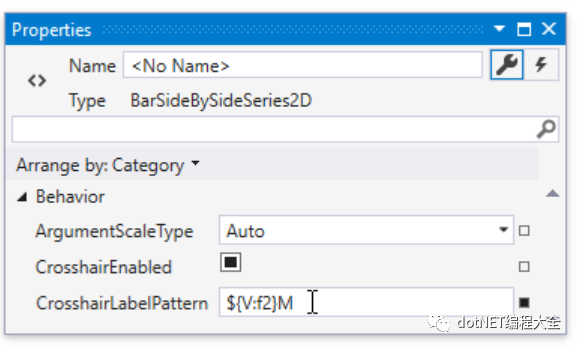
配置十字光标的选项
要自定义十字线选项,请单击ChartControl.CrosshairOptions属性的“新建”按钮以创建十字线选项实例。
启用以下属性:
CrosshairOptions.ShowArgumentLabels
CrosshairOptions.ShowValueLabels
CrosshairOptionBase.ShowValueLine
将XYSeries2D.Crosshair LabelPattern设置为$V:f2}M。
02
—
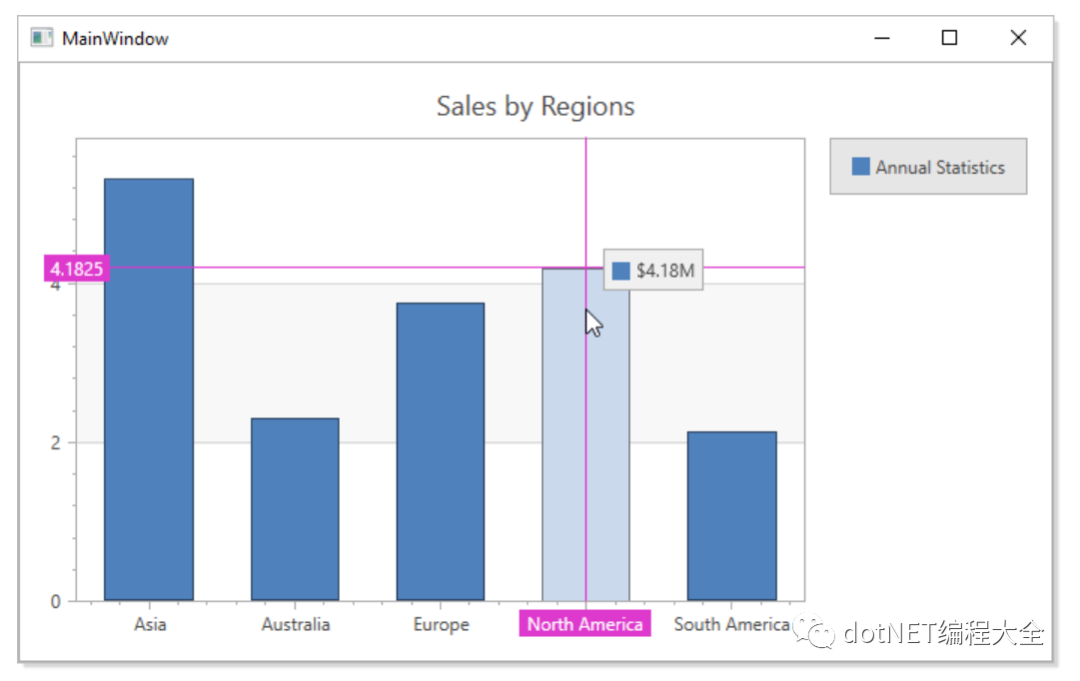
Results
运行项目以查看结果。
生成的代码如下所示:
<Windowxmlns="http://schemas.microsoft.com/winfx/2006/xaml/presentation" xmlns:x="http://schemas.microsoft.com/winfx/2006/xaml" xmlns:d="http://schemas.microsoft.com/expression/blend/2008" xmlns:mc="http://schemas.openxmlformats.org/markup-compatibility/2006" xmlns:local="clr-namespace:Lesson1BindChartToData" xmlns:dxc="http://schemas.devexpress.com/winfx/2008/xaml/charts"xmlns:dx="http://schemas.devexpress.com/winfx/2008/xaml/core" x:Class="Lesson1BindChartToData.MainWindow"mc:Ignorable="d" Title="MainWindow" Height="400" Width="650"><Window.DataContext><local:MainWindowViewModel/></Window.DataContext><Grid><dxc:ChartControl DataSource="{Binding Data}"><dxc:ChartControl.CrosshairOptions><dxc:CrosshairOptions ShowArgumentLabels="True" ShowValueLabels="True" ShowValueLine="True"/></dxc:ChartControl.CrosshairOptions><dxc:ChartControl.Titles><dxc:Title Content="Sales by Regions" HorizontalAlignment="Center"/></dxc:ChartControl.Titles><dxc:ChartControl.Legends><dxc:Legend/></dxc:ChartControl.Legends><dxc:XYDiagram2D><dxc:BarSideBySideSeries2D DisplayName="Annual Statistics" ArgumentDataMember="Argument" ValueDataMember="Value" CrosshairLabelPattern="${V:f2}M"/></dxc:XYDiagram2D></dxc:ChartControl></Grid>
</Window>
C# CODE
using System.Collections.ObjectModel;
using System.Windows;
namespace Lesson1BindChartToData {/// <summary>/// Interaction logic for MainWindow.xaml/// </summary>public partial class MainWindow : Window {public MainWindow() {InitializeComponent();}}public class MainWindowViewModel {public ObservableCollection<DataPoint> Data { get; private set; }public MainWindowViewModel() {this.Data = DataPoint.GetDataPoints();}}public class DataPoint {public string Argument { get; set; }public double Value { get; set; }public static ObservableCollection<DataPoint> GetDataPoints() {return new ObservableCollection<DataPoint> {new DataPoint { Argument = "Asia", Value = 5.289D},new DataPoint { Argument = "Australia", Value = 2.2727D},new DataPoint { Argument = "Europe", Value = 3.7257D},new DataPoint { Argument = "North America", Value = 4.1825D},new DataPoint { Argument = "South America", Value = 2.1172D}};}}
}
原文链接:https://docs.devexpress.com/WPF/9757/controls-and-libraries/charts-suite/chart-control/getting-started/lesson-1-bind-chart-series-to-data#results
翻译小编:mm1552923
公众号:dotNet编程大全