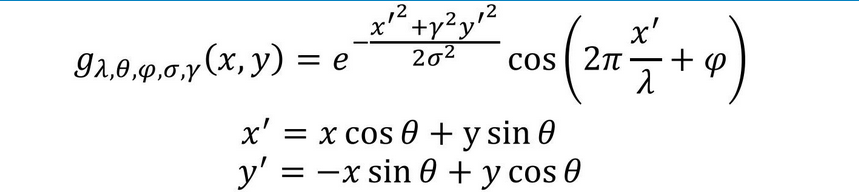
Gabor函数与人眼的生物作用相仿,尤其对于图片的方向和尺度特征可以很好的捕捉。所以,经常用于纹理、物体识别。对于Gabor的原理、公式不再赘述。
下面对Gabor滤波器用pytorch实现,并进行可视化:
import math
import torch
import numpy as np
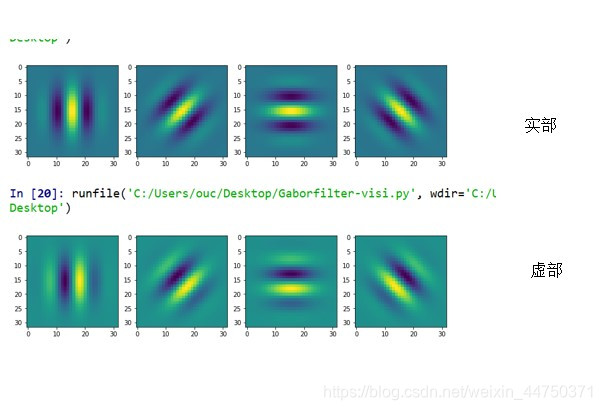
from matplotlib import pyplot as pltdef getGaborFilterBank(nScale, M, h, w):#nscale表示波长,M表示方向,h表示图片的长,w表示图片的宽Kmax = math.pi / 2f = math.sqrt(2)sigma = math.pisqsigma = sigma ** 2postmean = math.exp(-sqsigma / 2)if h != 1:gfilter_real = torch.zeros(M, h, w)for i in range(M):theta = i / M * math.pik = Kmax / f ** (nScale - 1)xymax = -1e309xymin = 1e309for y in range(h):for x in range(w):y1 = y + 1 - ((h + 1) / 2)x1 = x + 1 - ((w + 1) / 2)tmp1 = math.exp(-(k * k * (x1 * x1 + y1 * y1) / (2 * sqsigma)))#tmp2 = math.cos(k * math.cos(theta) * x1 + k * math.sin(theta) * y1) - postmean # For real parttmp2 = math.sin(k * math.cos(theta) * x1 + k * math.sin(theta) * y1) # For imaginary partgfilter_real[i][y][x] = k * k * tmp1 * tmp2 / sqsigma xymax = max(xymax, gfilter_real[i][y][x])xymin = min(xymin, gfilter_real[i][y][x])gfilter_real[i] = (gfilter_real[i] - xymin) / (xymax - xymin)else:gfilter_real = torch.ones(M, h, w)return gfilter_real#可视化
def plots(ims, interp=False, titles=None):ims=np.array(ims)mn,mx=ims.min(),ims.max()f = plt.figure(figsize=(12,24))for i in range(len(ims)):sp=f.add_subplot(1, len(ims), i+1)if not titles is None: sp.set_title(titles[i], fontsize=18)plt.imshow(ims[i], interpolation=None if interp else 'none', vmin=mn,vmax=mx)G=getGaborFilterBank(4,4,32,32)
plots(G)结果如图所示: