写在前面
该命令可用于查看虚拟机中对象实例数以及占用空间大小,生成堆转储文件,之后结合jvirsualvm等工具进行可视化查看,辅助定位程序的内存异常问题。
- 测试代码
public class ManyObj {private static List<People> peopleList = new ArrayList<>();public static void main(String[] args) throws Exception {System.out.println("test begin");IntStream.rangeClosed(1, 99999).forEach(__ -> peopleList.add(new People()));System.out.println("test end");System.in.read();}
}
1:获取对象实例数
$ jmap -histo 26396num     #instances         #bytes  class name
----------------------------------------------1:         99999        1599984  dongshi.daddy.zhengxi.People2:           950         479976  [Ljava.lang.Object;3:          5138         479224  [C...
class name:类名称,[C is a char[],[S is a short[],[I is a int[],[B is a byte[],[[I is a int[][]。
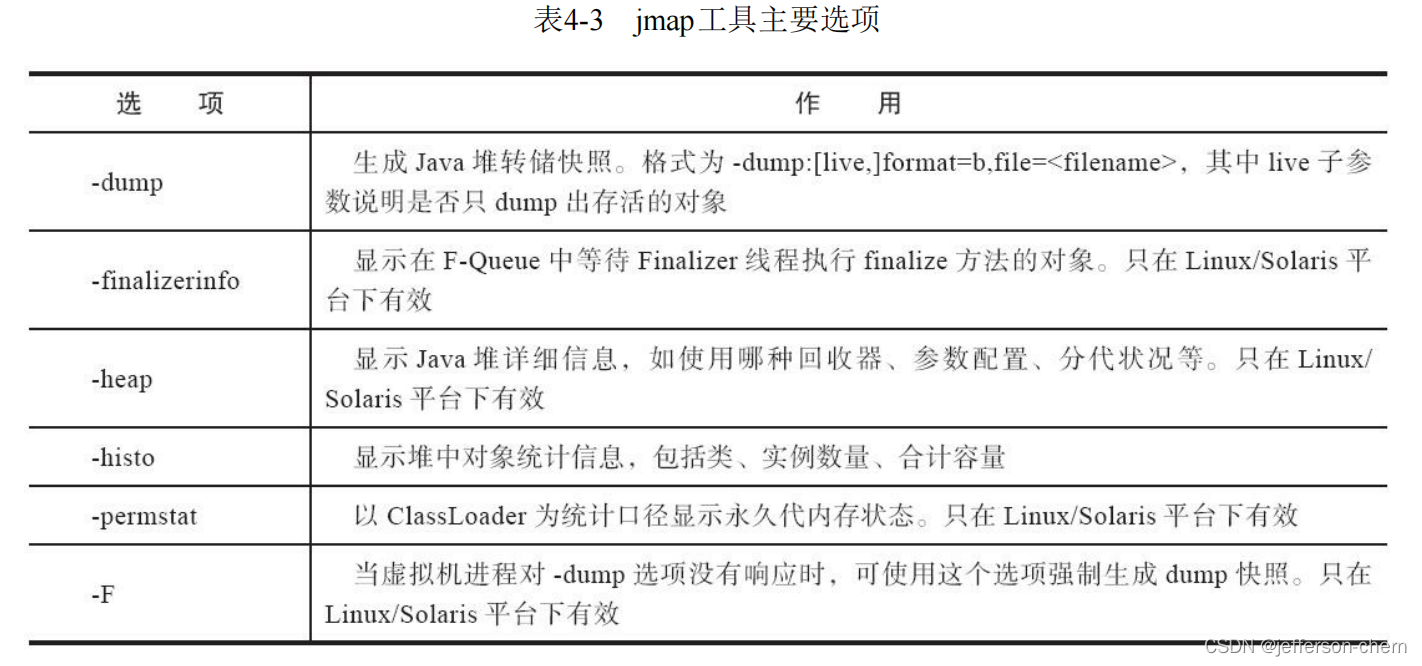
2:查看堆信息

3:生成堆转储文件并可视化
3.1:生成堆转储文件
$ jmap -dump:live,format=b,file=d:\\test\\manyobjdump.hprof 26396
Dumping heap to D:\test\manyobjdump.hprof ...
Heap dump file created
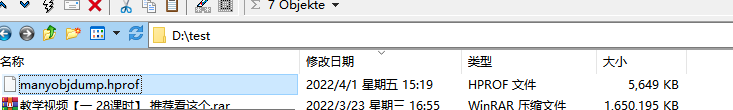
3.2:可视化查看
我们使用jvisualvm来查看文件->载入:

写在后面
jmap-查看实例个数以及占用内存大小 。